

Abstract
Even if speech perception has been reported to involve both left and right hemispheres, converging data have posited the existence of a functional asymmetry at the level of secondary auditory cortices. Using fMRI in 12 right‐handed French men listening passively to long connected speech stimuli, we addressed the question of neuronal networks involved in the integration of low frequency bands of speech by comparing 1) differences in brain activity in two listening conditions (FN, NF) differing in the integration of pitch modulations (in FN, low frequencies, obtained by a low‐pass filter, are addressed to the left ear while the whole acoustic message is simultaneously addressed to the right ear, NF being the reverse position); 2) differences in brain activity induced by high and low degrees of prosodic expression (expressive vs. flat); and 3) effects of the same connected speech stimulus in the two listening conditions. Each stimulus induced a specific cerebral network, the flat one weakening activations which were mainly reduced to the bilateral STG for both listening conditions. In the expressive condition, the specific sensory integration FN results in an increase of the articulatory loop and new recruitments such as right BA6‐44, left BA39‐40, the left posterior insula and the bilateral BA30. This finding may be accounted for by the existence of temporal windows differing both in length and in acoustic cues decoding, strengthening the “asymmetric sampling in time” hypothesis posited by Poeppel (Speech Commun 2003; 41:245–255). Such an improvement of prosodic integration could find applications in the rehabilitation of some speech disturbances. Hum Brain Mapp, 2005. © 2005 Wiley‐Liss, Inc.
Keywords: connected speech perception, low‐pass filtered speech, pitch modulations, hemispheric lateralization, neuronal network, fMRI
INTRODUCTION
The neural basis of speech perception has been widely studied over the years and converging studies have reported a functional anatomic model implicating both left and right hemispheres [Buchanan et al., 2000; Klein et al., 2001; Meyer et al., 2000; Schlosser et al., 1998; Seger et al., 2000], specifically, both posterior superior temporal gyri [Belin et al., 2000; Binder et al., 2000; Mummery et al., 1999; Scott et al., 2000]. Results of functional neuroimaging studies provide evidence that human speech perception might be based on multiple, hierarchical, and bilateral processing pathways, and that different kinds of representations could be preferentially treated in different “streams.” In fact, decoding a stream of sound into a meaningful utterance appears to require many hierarchical stages such as (1) extracting speech‐relevant information from the stream of sound, (2) mapping this onto stored representations, and (3) combining these representations to derive the overall meaning. These hierarchical stages not only involve the primary and secondary auditory areas, but also a wider neuronal network that encompasses inferior parietal areas and prefrontal areas [Scott and Johnsrude, 2003]. Hence, a bilateral dorsal‐ventral model of speech processing, with a preferential leftwards involvement, has emerged from many convergent studies [Binder et al., 1996; Binder and Frost, 1998; Hickok and Poeppel, 2004; Rauschecker and Tian, 2000]. This model has posited: (i) a dorsal pathway, i.e., the “where stream,” where an acoustic‐phonetic‐articulatory transformation linking auditory representations to motor representations is reported to occur in superior temporal/parietal areas and ultimately in frontal areas [Buchsbaum et al., 2001]; and (ii) a ventral pathway, i.e., the “what stream,” where speech‐derived representations interface with lexical semantic representation, reported to involve the superior, middle, and inferior temporal gyri [Binder et al., 2000; Hickock and Poeppel, 2000; Scott et al., 2000].
Nonetheless, even if the superior temporal system specialized for speech sound recognition is but an early stage in a processing stream that ultimately projects to all components of this distributed system [Binder et al., 2000; Grabowski and Damasio, 2000], its functional role still remains a matter of debate. An increasing body of data suggests that the right temporal lobe, and more specifically, the right superior temporal gyrus (STG) and the superior temporal sulcus, plays a critical role in the analysis of speech signals, notwithstanding “left‐hemisphere imperialism” [Buchman et al., 1986; Binder et al., 2000; Burton et al., 2000; Hickok and Poeppel, 2000; Norris et al., 2000]. A key question is whether these right and left posterior superior temporal areas execute the same processes in the analysis of speech signals or whether they compute different aspects of the acoustic speech signal. Some converging studies have posited that while both primary auditory cortices are stimulated in the same way by the stream of sound, thus leading to no specific functional asymmetry at the level of core auditory cortices, there does exist a functional asymmetry at the level of secondary auditory cortices [Poeppel, 2003]. For example, many neuroimaging studies have revealed a left preferential involvement of the STG in phonetic and phonological processing [Scott et al., 2000], whereas the right STG has been reported to be preferentially involved in melody and more particularly in speech melodic processing [Griffiths et al., 1998; Warren et al., 2002]. These findings, resting on a speech vs. music opposition, have been discussed in terms of sound parameters: durational sound parameters in the “asymmetric sampling in time” (AST) hypothesis posited by Poeppel [2003], or spectral sound parameters in the view of Zatorre and colleagues [Belin et al., 1998; Zatorre et al., 1992, 1994]. Nonetheless, temporal and spectral acoustic sound parameters appear to be more complementary than divergent phenomena. In fact, all these studies have attempted to account for data on segregation and lateralization and a general consensus regarding the involvement of superior temporal areas in speech perception has emerged: left superior temporal areas have been associated with rapid durational processes such as the analysis of formant transitions, while slow durational processes, or fine spectral processes such as the analysis of intonation contour (i.e., F0 variations, or pitch modulations) have been associated with right superior temporal mechanisms [Belin et al., 2000; Cancelliere and Kertesz, 1990; Kreiman and Van Lancker, 1988; Mummery et al., 1999; Pell and Baum, 1997; Scott et al., 2000; Sidtis and Feldmann, 1990; Sidtis and Volpe, 1988; Sidtis, 1980, 1984; Van Lancker and Sidtis, 1992; Zatorre et al., 1992, 1994, 2002; Zatorre and Belin, 2001; Zatorre, 1988]. Taken together, these results suggest that in normal right‐handed subjects, the perception of a stream of speech sounds induces a double analysis based on temporally, or spectrally, delimited windows in which the low‐frequency bands of speech (i.e., F0 variations which carry pitch information) are preferentially processed by the right STG, whereas simultaneously, the left STG processes the entire spectrum of speech frequencies in which rapid durational acoustic cues are extracted.
It can thus be hypothesized that preferentially delivering F0 modulations to the right hemisphere (i.e., presenting it with a much less complex acoustic message since only frequency bands ranging from 0–350 Hz are retained) should induce a better integration of the prosodic factors which are mainly carried by F0 modulations. Moreover, since speech exists over time, one means of testing this hypothesis is to use long connected speech stimuli which appear to favor a better integration of pitch modulations, since they present much more F0 modulations than isolated words or sentences do. That is why we addressed the question of the anatomical substratum involved in the specific integration of low‐frequency bands of speech when hearing (1) long connected speech, and (2) high degrees of prosodic information.
In the present study, we used functional magnetic resonance imaging (fMRI) and two 30‐s‐long connected speech stimuli differing in degrees of prosodic information (high and low degrees) to assess the neuronal networks specifically involved in prosodic integration when slow acoustic cues, i.e., F0 modulations are preferentially addressed to the right hemisphere (RH). Results were analyzed in order to (1) identify the activated neuronal network of the unimpaired human brain when pitch modulations of a recorded continuous speech production with high degrees of prosodic information (mainly carried by slow F0 variations) are specifically addressed to the right hemisphere (using a low‐pass filter keeping frequencies ranging from 0–350 Hz), while the whole acoustic message is simultaneously addressed to the left hemisphere, (FN listening condition); (2) compare this cerebral network with the network obtained in the reverse position (NF listening condition); and (3) assess the effect of prosody by comparing each of the cerebral networks elicited by the two listening conditions in an expressive speech production (prosodic speech) with those elicited by a flat one (aprosodic speech) which can be considered as a baseline, thereby making it possible to isolate the prosodic factor proper.
SUBJECTS AND METHODS
Subjects
Twelve right‐handed, French men (ages 24–38 years, mean 28) participated in the study after giving informed written consent in accordance with the guidelines approved by the Ethics Committee of the Bordeaux Medical University. Subjects had no hearing or neurological disorders and normal structural MRI scans. They had no prior experience of the task and were not familiar with the stimulus material.
Stimuli
Two different 30‐s‐long connected speech stimuli were chosen, both in French: a very expressive recording and a flat one (the flat speech presentation was purposely different in content from the expressive one in order to prevent subjects from retrieving any prosodic features from the former expressive speech stimulus).
The expressive speech stimulus used a recording of a passage from Edmond Rostand's drama Cyrano de Bergerac. The flat speech stimulus used a recording of a passage from an economic newspaper.
The recording was performed by a trained male speaker in a soundproof room (IAC) at a 16 bits/41.1 kHz sampling rate. To achieve an acoustic signal exclusively reduced to its prosodic information, the original connected speech was low‐pass‐filtered using a 10‐pole Butterworth filter (using MatLab DSP Toolbox) providing a 60dB/oct attenuation, with a 300 Hz cut‐off frequency. From a linguistic point of view the signal derived from this filtering procedure comprised an F0 contour and amplitude envelope, which represents speech melody (distribution and type of pitch accents and boundary markers of prosodic domains). However, acoustic cues interact with one another in such a way that isolating a single acoustic cue in connected speech remains impossible, which entails that our two connected speech presentations also differed in rhythm, speech rate, and stress, and so did their respective acoustic correlates (duration and intensity). Nonetheless, it is generally agreed that F0 modulations are the main acoustic correlate of prosody.
Thus, the two low‐pass‐filtered connected speech stimuli present different F0 modulations depending on their prosodic content: the more expressive the speech stimulus, the more important F0 modulations. Hence, the expressive filtered speech stimulus presents pitch modulations ranging from 75–300 Hz (Fig. 1A), whereas the flat filtered speech stimulus presents pitch modulations ranging from 70–150 Hz (Fig. 1B).
Figure 1.
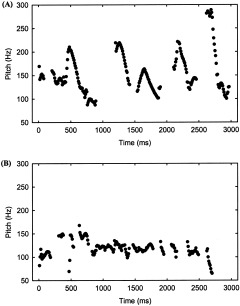
Pitch modulations of the first 3 s extracted with WaveSurfer Software [Sjölander and Beskow, 2000]. The upper image (A) illustrates the pitch contour of the expressive speech presentation. The lower image (B) illustrates the pitch contour of the toneless speech presentation.
So as not to alter the connected speech stimuli, i.e., to preserve the authenticity of the speech stimuli, the low‐pass‐filtered stimuli were not amplitude‐adjusted. In the present experiment, as the low‐pass‐filtered speech stimuli were never presented alone but always combined with the unfiltered speech. This made a comparison between the listening conditions possible since the differences in loudness were the same when using whether the unfiltered speech stimuli or the unfiltered ones.
Listening Conditions
The original and the filtered connected speech productions were presented as follows in four listening conditions for either connected speech stimuli (expressive and flat):
NN: normal speech stimuli (unfiltered speech) presented to both ears;
FF: same low pass‐filtered speech stimuli presented to both ears;
FN: filtered speech stimuli presented to the left ear and simultaneously unfiltered speech stimuli presented to the right ear;
NF: unfiltered speech stimuli presented to the left ear and simultaneously filtered speech stimuli presented to the right ear.
While the low‐pass filtered speech stimulus (FF) is hardly comprehensible by itself, since it can be described as sounding like speech listened to from behind a door, when combined with the unfiltered speech, i.e., the FN and NF listening conditions, the low‐pass‐filtered speech stimulus F is masked by the unfiltered speech stimulus N. In fact, FN and NF speech stimuli can be described as sounding like monaural speech. So as to assess the level of intelligibility of the speech after low‐pass filtering, tests of performances of intelligibility were achieved through the shadowing procedure, which consists of repeating the exact speech a couple of seconds after having just heard it. These tests were performed after the scanning session so as to prevent subjects from memorizing the stimuli.
In order to avoid any confusion of issues, the present study will restrict the analysis to the FN and NF presentations. However, the experimental paradigm and acquisition data are described as they were performed, i.e., taking into account the four listening conditions.
Procedure
Participants were presented with sixteen 30‐s‐long stimuli and were asked to listen to the stimuli while remaining motionless and keeping their eyes closed. For each speech presentation, each listening condition was repeated twice as follows: FF ‐ FN ‐ NF ‐ NN ‐ FN ‐ FF ‐ NF ‐ NN. Half of the participants were first presented with the expressive speech stimulus, whereas the other half first received the flat one. The speech stimuli were presented binaurally through headphones specifically designed for use in the scanner at 80 db. To allow for an epoch‐related data analysis, all successive presentations of each listening condition lasting 30 s (10 dynamic scans per slice) were separated by an intertrial interval of rest lasting 18 s (six dynamic scans per slice). Then the hemodynamic response was allowed to return to baseline level. Each speech stimulus was thus composed of nine intertrial intervals of rest and eight activation phases (i.e., 134 dynamic scans each), the total length of the procedure being 402 s.
Data Acquisition
MRI data were collected at 1.5 T using a Gyroscan ACS NT Power track 6000 (Philips Medical System, Best, Netherlands) equipped with echo planar imaging capabilities. Each subject underwent a high‐resolution T1‐weighted anatomic scan including 30 slices parallel to AC‐PC (anterior commissure/posterior commissure) covering the whole cortex (no gap, thickness 4 mm). Acquisition parameters: TR/TE = 274/25 ms; matrix = 256 × 256; field of view (FOV) = 260 mm. The fMRI data were processed using T2*‐weighted gradient echo, echo‐planar sequence. Thirty slices (parallel to AC‐PC, no gap, thickness 4 mm) were acquired during each TR. Acquisition parameters: TR/TE = 3,000/60ms, flip angle = 90°; matrix = 64 × 64; FOV = 260 mm; 134 images per slice were acquired per session.
Data Analysis
All data were transferred to a workstation and analyzed using Statistical Parametric Mapping software (Wellcome Department of Cognitive Neurology, London UK, SPM 99) for image realignment and for creation of statistical maps of significant relative regional BOLD (blood oxygenation level‐dependent) response changes [Friston et al., 1995].
Individual analysis
For both connected speech stimuli, session scans were realigned and statistical maps of BOLD response changes were created using a boxcar model convoluted by hemodynamic response for each listening condition allowing for the construction of two main contrasts, FN/ISI, NF/ISI (ISI standing for the interstimulus interval, i.e., the resting period).
Voxels were identified as significant only when passing a height threshold of T = 3 (P < 0.001, uncorrected for multiple comparison) and a minimum three voxels was selected per ROI (region of interest) for cluster analysis (192 mm3). For each subject, statistical maps of functional activation were overlaid on each subject's anatomical image so as to identify the anatomical location of significant areas of functional activation. Thus, using anatomical criteria and Brodmann's classification, 10 different ROIs assigned by two experts (M.A. and I.H.) were revealed across the 12 subjects. These ROIs refer to BA 6, BA 44, posterior insula, BA 39‐40, BA 41‐42, BA 22 post, BA 22 ant, BA 21 post, BA 21 ant, and BA 38.
In the second place, ROI analysis based on repeated‐measures ANOVA, considering four factors (listening conditions, prosody, hemisphere, and ROIs), was performed. For each stimulus the volume of activation of each subject within an ROI (number of activated voxels) was used as the variable of the ANOVA, with a significance level of P < 0.05. This strategy was adopted since (1) no assumptions were made about the location of activated areas, as the present study is an exploratory one; (2) each ROI was activated in each subject; and (3) each subject was compared with himself. In the present experiment, such an analysis allows for limiting (i) the interindividual variability of the BOLD response since the vascular architecture remains unchanged, and (ii) the interareas variability for the same subject, even if it is less accurate for the interhemispheric variability.
The purpose of the individual analysis was (1) to aid anatomical localization of significant activations from the group analysis, and (2) to compare the individual activation patterns among subjects with those obtained in the group analysis.
Group analysis
The AC and PC points were identified and functional datasets from each subject were smoothed (Gaussian kernel of 10 mm) and normalized into a standard stereotaxic space [Talairach and Tournoux, 1988], using both the intercommissural line as the reference plane for the transformation and a representative brain from the Montreal Neurological Institute (MNI) series as template. Areas were thereafter defined both in terms of standard stereotaxic coordinates in the x, y, and z axes (converted from MNI to Talairach coordinates) and in Brodmann's areas. So as to determine areas specifically activated in all subjects, data were analyzed using a Random Effects Model for group analysis. For each listening condition, two main contrasts, FN/ISI and NF/ISI, were constructed for each connected speech stimulus with a height threshold of T = 3 (P < 0.001, uncorrected for multiple comparison) and a minimum of 20 voxels was selected per ROI for cluster analysis (1,280 mm3).
To statistically determine differences in the activated neural network across (1) the listening conditions (FN and NF), and (2) the prosodic content (expressive and flat), two sample t‐tests were performed (i) between the two listening conditions for the same connected speech stimulus, i.e., expressive FN/ISI vs. NF/ISI and flat FN/ISI vs. NF/ISI (P < 0.001), and (ii) between the two original connected speech stimuli for each listening condition, i.e., expressive FN/ISI vs. flat FN/ISI and expressive NF/ISI vs. flat NF/ISI, (P < 0.001), the interstimulus interval (ISI) being the baseline. As no assumptions were made about the direction of effects in the condition contrasts, all contrasts were tested and reported for both directions.
In addition to this whole brain analysis, a four‐way repeated‐measures ANOVA with factors Listening condition × Hemisphere × Prosody × ROIs was performed to determine local task‐related differences in activation. For each subject the ROIs were first functionally defined based on significant clusters of activation within the group data, applying statistical thresholds (Fig. 2). For each hemisphere, each ROI was delineated with respect to the local maximal Z score.
Figure 2.
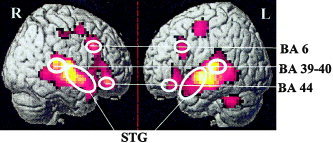
Functional ROIs on normalized and smoothed Subject #4 (right and left BA 6, BA 44, BA 39‐40, and BA 41‐42, 22, 21, 38 (STG)).
However, since, contrary to the individual analysis, group analysis requires normalization and smoothing, thus impeding a precise assignment of the activated brain areas in the superior temporal gyrus, contrary to the individual analysis, temporal brain regions were divided into thee major brain areas (BA 41‐42, BA 22‐21, and BA 38), leading to six regions of interest such as BA 6, BA 44, BA 39‐40, BA 41‐42, BA 22‐21, and BA 38.
The group ROI analysis follows the same logic as the individual ROI analysis.
RESULTS
Behavioral Data
Results from tests of performance of intelligibility achieved through the shadowing procedure after the scanning session revealed that subjects were able to repeat both connected speech stimuli, whatever the listening condition (100% of correct shadowing). All the subjects reported that both listening conditions sounded like monaural speech.
fMRI Data
Figure 3 presents maps of activation in each listening condition for each connected speech stimulus and Table I summarizes this map in terms of loci, activated volumes, and significance. Table II summarizes results of loci, activated volumes, and significance of prosodic and filtering effects.
Figure 3.
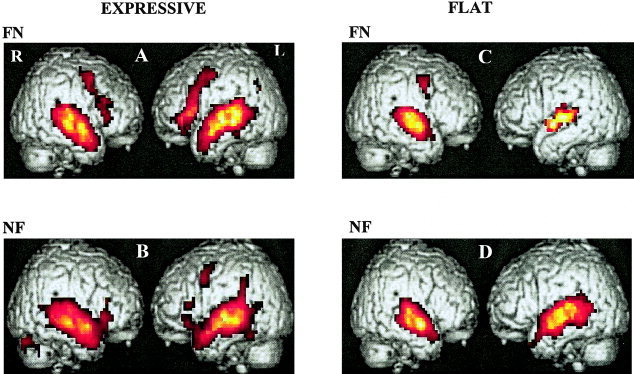
Patterns of activation elicited by the two following listening conditions: filtered speech stimulus to the left ear and normal speech stimulus to the right ear (FN), normal speech stimulus to the left ear and filtered speech stimulus to the right ear (NF), in a prosodic connected speech presentation and a flat one. A: Expressive speech presentation: filtered speech stimulus to the left ear and normal speech stimulus to the right ear (FN), Z ranging from 5.80–13.72. B: Expressive speech presentation in normal speech stimulus to the left ear and filtered speech stimulus to the right ear (NF), Z ranging from 3.66–15.68. C: Flat speech presentation: filtered speech stimulus to the left ear and normal speech stimulus to the right ear (FN), Z ranging from 6.40–12.30. D: Flat speech presentation: normal speech stimulus to the left ear and filtered speech stimulus to the right ear (NF), Z ranging from 3.89–13.28.
Table I.
Expressive and flat speech presentations in FN and NF1
| Location‐ BA | Left hemisphere | Right hemisphere | ||||||||
|---|---|---|---|---|---|---|---|---|---|---|
| K | Z score | Talairach coordinates | K | Z score | Talairach coordinates | |||||
| x | y | z | x | y | z | |||||
| Expressive FN presentation | ||||||||||
| LPG/6 | 135 | 4.78 | −50 | −10 | 42 | 110 | 5.80 | 44 | −7 | 45 |
| IFG/44 | 300 | 7.58 | −44 | 17 | 9 | 113 | 7.85 | 44 | 17 | 9 |
| IPG/39–40 | — | — | — | — | — | 1088* | 14.88 | 56 | −44 | 16 |
| STG/22 | 1182* | 15.78 | −41 | −34 | 7 | 1088* | 13.72 | 56 | −30 | −2 |
| STG/21 | 1182* | 8.68 | −56 | −37 | −6 | — | — | — | — | — |
| ITG/38 | 1182* | 12.81 | −47 | −7 | −16 | 1088* | 3.81 | 50 | −7 | −9 |
| SPG/7 | 156* | 5, 19 | −27 | −54 | 34 | — | — | — | — | — |
| IPG/39–40 | 156* | 4, 56 | −25 | −75 | 21 | — | — | — | — | — |
| Flat FN presentation | ||||||||||
| LPG/6 | — | — | — | — | — | 65 | 9.74 | 25 | −17 | 42 |
| HG/41–42 | 650* | 10, 54 | −41 | −34 | 7 | 666* | 15, 95 | 56 | −40 | 4 |
| STG/22 | 650* | 10.97 | −47 | −24 | −1 | 666* | 12.30 | 50 | −24 | −8 |
| ITG/38 | — | — | — | — | — | 666* | 6.40 | 54 | −10 | −7 |
| Expressive NF presentation | ||||||||||
| LPG/6 | 65 | 6.49 | −44 | −7 | 42 | — | — | — | — | — |
| IFG/44 | 22 | 4.71 | −54 | 24 | 10 | |||||
| STG/22 | — | — | — | — | — | 1135* | 20.77 | 47 | 24 | 17 |
| STG/21 | 1113* | 15.68 | −59 | −34 | −8 | — | — | — | — | — |
| ITG/38 | 1113* | 13.10 | −56 | −10 | −6 | 1135* | 12.47 | 47 | −3 | −9 |
| Cerebellum | — | — | — | — | — | 86 | 6.53 | 17 | −81 | −29 |
| Flat NF presentation | ||||||||||
| HG/41–42 | 1128* | 14.02 | −40 | −34 | 7 | 783* | 21.40 | 50 | −27 | 5 |
| STG/22 | — | — | — | — | — | 783* | 12.07 | 54 | −27 | −5 |
| ITG/38 | 1128* | 13.28 | −47 | −7 | −7 | — | — | — | — | — |
1This table and Table II list results of loci, activated volumes, and significance of each listening condition, K standing for the number of voxels. Localization is based on stereotaxic coordinates [Talairach and Tournoux, 1988] after the conversion of MNI coordinates to Talairach. These coordinates refer to the location of maximal activation indicated by the Z score in a particular anatomical structure which is also indicated in Brodmann's areas (BA). Distances are relative to the intercommissural (AC‐PC) line in the horizontal (x), anterior‐posterior (y), and vertical (z) directions. The table only lists activation clusters exceeding a minimal size of 20 voxels. LPG, lateral prefrontal gyrus; IFG, inferior frontal gyrus; OFG, orbito‐frontal gyrus; HG, Herschel's gyrus; STG, superior temporal gyrus; ITG, inferior temporal gyrus; SPG, superior parietal gyrus; IPG, inferior parietal gyrus; FG, fusiform gyrus; OG, occipital gyrus; pINS, posterior insula; pCG, posterior cingulate gyrus.
FN refers to filtered speech stimulus to the left ear and normal speech stimulus to the right ear. NF refers to normal speech stimulus to the left ear and filtered speech stimulus to the right ear.
Since group analysis requires smoothing and normalization, K calculation may represent overlapping volumes corresponding to neighboring maximal activation, i.e., different brain areas. As it is thus impossible to determine the specific activated volume in each brain area, K was repeated.
Table II.
Prosodic and filtering effects1
| Location‐ BA | Left hemisphere | Right hemisphere | ||||||||
|---|---|---|---|---|---|---|---|---|---|---|
| K | Z score | Talairach coordinates | K | Z score | Talairach coordinates | |||||
| x | y | z | x | y | z | |||||
| Expressive FN > flat FN presentations | ||||||||||
| IPG/39–40 | 80 | 4.46 | −34 | −48 | 35 | — | — | — | — | — |
| STG/22 post | 113 | 3.91 | −50 | −37 | 1 | 77 | 5.07 | 50 | −58 | 6 |
| ITG/38 | — | — | — | — | — | 57 | 4.21 | 44 | −10 | −22 |
| FG/37 | 44 | 3.51 | −38 | −64 | 9 | — | — | — | — | — |
| Flat FN > expressive FN presentations | ||||||||||
| — | — | — | — | — | — | — | — | — | — | — |
| Expressive NF > flat NF presentations | ||||||||||
| OFG/10 | 25 | 4.35 | −38 | 51 | 15 | 34 | 3.22 | 25 | 55 | 18 |
| OG/19 | 99 | 3.67 | −1 | −75 | 24 | 62 | 4.19 | 54 | −58 | 3 |
| Flat NF > expressive NF presentations | ||||||||||
| pIns | 247 | 3.93 | −34 | −17 | 5 | — | — | — | — | — |
| Thalamus | — | — | — | — | — | 81 | 3.70 | 19 | −30 | −2 |
| Cerebellum | — | — | — | — | — | 102 | 4.11 | 10 | −64 | −28 |
| Expressive FN > expressive NF presentations | ||||||||||
| IPG/39–40 | 152 | 6.11 | −29 | −44 | 50 | — | — | — | — | — |
| pIns | 165 | 6.04 | −38 | −14 | 9 | — | — | — | — | — |
| pCG/30 | 126 | 6.33 | −25 | −71 | 21 | 62 | 4.73 | 41 | −10 | 12 |
| Expressive NF > expressive FN presentations | ||||||||||
| Cerebellum | — | — | — | — | — | 33 | 3.89 | 13 | −89 | −33 |
| Flat FN > flat NF presentations | ||||||||||
| OG ‐ 19 | 79 | 3.49 | −4 | −92 | 20 | — | — | — | — | — |
| Flat NF > flat FN presentations | ||||||||||
| — | — | — | — | — | — | — | — | — | — | — |
1FN refers to filtered speech stimulus to the left ear and normal speech stimulus to the right ear by comparison with interstimulus interval (FN/ISI).
NF refers to normal speech stimulus to the left ear and filtered speech stimulus to the right ear by comparison with interstimulus interval (NF/ISI).
Table IIIA reveals results of the four‐way repeated‐measures ANOVA for group analysis as Table IIIB does for individual analysis. Figure 4A plots means of interactions of Listening condition × Prosody × Hemisphere in each area for group analysis, as Figure 4B does for individual analysis.
Table III.
Repeated‐measures analysis of variance
| Condition | F | P |
|---|---|---|
| Group analysis | ||
| Listening condition | F1,11 = 9.289 | <0.0011 |
| Hemisphere | F1,11 = 0.975 | 0.3446 |
| Prosody | F1,11 = 149.358 | <0.0001 |
| Listening condition × Hemisphere | F1,11 = 0.001 | 0.9723 |
| Listening condition × Prosody | F1,11 = 3.273 | 0.0978 |
| Hemisphere × Prosody | F1,11 = 0.247 | 0.6712 |
| Listening condition × Hemisphere × Prosody | F1,11 = 0.014 | 0.9047 |
| Areas | F5,55 = 28.445 | <0.0001 |
| Areas × Listening condition | F5,55 = 1.580 | 0.1811 |
| Areas × Hemisphere | F5,55 = 0.967 | 0.4461 |
| Areas × Prosody | F5,55 = 5.872 | <0.0002 |
| Areas × Listening condition × Hemisphere | F5,55 = 4.504 | 0.0016 |
| Areas × Listening condition × Prosody | F5,55 = 2.727 | 0.0285 |
| Areas × Hemisphere × Prosody | F5,55 = 0.588 | 0.7090 |
| Areas × Listening condition × Hemisphere × Prosody | F5,55 = 1.487 | 0.2091 |
| Individual analysis | ||
| Listening condition | F1,11 = 64.470 | <0.0001 |
| Hemisphere | F1,11 = 1.446 | 0.2545 |
| Prosody | F1,11 = 17.096 | <0.0017 |
| Listening condition × Hemisphere | F1,11 = 0.293 | 0.5988 |
| Listening condition × Prosody | F1,11 = 2.298 | 0.1577 |
| Hemisphere × Prosody | F1,11 = 0.984 | 0.3425 |
| Listening condition × Hemisphere × Prosody | F1,11 = 0.035 | 0.035 |
| Areas | F9,99 = 23.760 | <0.0001 |
| Areas × Listening condition | F9,99 = 3.710 | 0.0005 |
| Areas × Hemisphere | F9,99 = 0.807 | 0.6104 |
| Areas × Prosody | F9,99 = 4.602 | <0.0001 |
| Areas × Listening condition × Hemisphere | F9,99 = 0.313 | 0.9692 |
| Areas × Listening condition × Prosody | F9,99 = 0.404 | 0.9305 |
| Areas × Hemisphere × Prosody | F9,99 = 0.229 | 0.9896 |
| Areas × Listening condition × Hemisphere × Prosody | F9,99 = 0.199 | 0.9938 |
Figure 4.
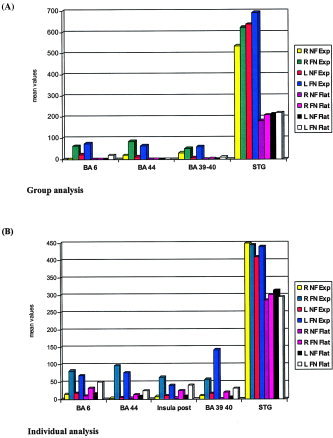
Plots of means of ROI × Listening condition × Hemisphere × Prosody (A: group analysis and B: individual analysis, the STG—BA 41‐42, BA 22, BA 21, BA 38—being pooled).
Global view
Group analysis revealed that both FN and NF listening conditions induced a specific pattern of activation which depends on each connected speech stimulus. Nonetheless, for both listening conditions prosodic utterances produced more activity than flat ones as evidenced by Tables I and II and Figure 3. The main areas, which were more or less activated depending on the prosodic information and the listening condition, were the superior temporal gyrus (BA 41‐42, BA 22, BA 21, BA 38), the articulatory loop (left BA 6‐44) and its right counterpart as well as the left inferior parietal gyrus (BA 39‐40).
In addition, the four‐way repeated‐measures ANOVA revealed significant main effects of listening condition (F1,11 = 9.289, P < 0.0111), of prosody (F1,11 = 149.358, P < 0.0001) and of areas (F5,55 = 28.445 P < 0.0001), whereas no main effect of hemisphere was found, as reported in Table IIIA. Moreover, follow‐up analyses revealed a significant second‐level interaction between Areas × Prosody but no interaction between Listening condition × Prosody. In addition, significant third‐level interactions between Areas × Listening condition × Hemisphere and Areas × Listening condition × Prosody were found.
These follow‐up analyses results suggest that the influence of the factors listening condition, hemisphere, and prosody are closely linked to the factor areas as shown in Figure 4A, which reveals differences between the STG and other brain areas such as the articulatory loop and its right counterpart, as well as the inferior parietal gyrus. Consequently, a new four‐way repeated‐measures ANOVA without the STG was performed to assess the influence of the STG. Not only did the results confirm the main significant effects of listening condition (F1,11 = 31.937, P < 0.0001) and of prosody (F1,11 = 35.265, P < 0.0001) as well as the nonsignificant effect of hemisphere (F1,11 = 0.125, P = 0.7298), but they also revealed a second‐level interaction between listening Condition × Prosody (F1,11 = 19.656, P < 0.0001).
To sum up, these results show that (1) the differences between the listening conditions depend on prosodic information, and that (2) these differences do not concern the STG but other areas such as the articulatory loop, its right counterpart, and the left inferior parietal gyrus.
Results from repeated‐measures ANOVAs performed on individual analysis revealed main significant effects of listening condition, of areas, and of prosody, as shown in Table IIIB. In addition, Figure 4B revealed the high scores of the STG, confirming results from group analysis. As for the group analysis, a new four‐way repeated‐measures ANOVA without the STG not only confirmed the main significant effects of listening condition (F1,11 = 46.803 P < 0.0001) and of prosody (F1,11 = 12.278, P < 0.0049) as well as the nonsignificant effect of hemisphere (F1,11 = 1.045, P = 0.3286), but also revealed an interaction between Listening condition × Prosody (F1,11 = 11.469, P < 0.0061).
Effects in each ROI
Each ROI was subjected to ANOVA so as to specifically compare activation between the listening conditions for each connected speech stimulus. Conversely, each ROI was subjected to ANOVA so as to specifically compare activation between the prosodic stimuli for each listening condition.
Effects of Listening Condition: FN vs. NF
FN vs. NF in expressive connected speech presentation
The STG was bilaterally activated in both listening conditions as shown in Table I and Figure 3. No significant differences in activation were reported for the temporal cortex (F1,11 = 0.437, P = 0.5221 for the left hemisphere and F1,11 = 0.248, P = 0.6283 for the right hemisphere). No interhemispheric differences were observed (F1,11 = 0.369, P = 0.5556 for FN and F1,11 = 0.259, P = 0.6206 for NF).
The articulatory loop was activated in both listening conditions but NF significantly decreased activations (F1,11 = 5.701, P < 0.0360 for left BA 6 and F1,11 = 18.406, P < 0.0013 for left BA 44). Moreover, NF suppressed the right prefrontal activation as well as the left inferior parietal activations as reported in Figure 3 and elicited new right cerebellar activations as shown in Table I.
In addition, analyses of expressive FN > NF presentations revealed a left involvement of the inferior parietal gyrus (BA 39‐40) (F1,11 = 8.074, P < 0.0160), and of the posterior insula, as well as a bilateral involvement of the posterior cingulate gyrus. The reverse contrast revealed a slight right cerebellar involvement (Table II).
FN vs. NF in flat connected speech presentation
The temporal cortex was bilaterally activated in both listening conditions, without any significant differences between the two listening conditions (F1,11 = 0.117, P = 0.7384 for the left hemisphere and F1,11 = 1.731, P = 0.2150 for the right hemisphere). No interhemispheric differences were observed (F1,11 = 0.130, P = 0.7255 for FN and F1,11 = 0.886, P = 0.3667 for NF).
FN elicited new activations in the left lateral prefrontal cortex and analyses of flat FN > NF presentations revealed a left involvement of the occipital cortex (BA 19), whereas the reverse contrast did not reveal any significant activated areas (Table II).
Effects of Prosodic Information: Expressive vs. Flat
Expressive vs. flat in FN
The STG was bilaterally activated (Table I, Figure 3), even if the flat condition significantly reduced activations (F1,11 = 21.234, P < 0.0008 for the left hemisphere, and F1,11 = 13.483, P < 0.0037 for the right hemisphere).
Moreover, the articulatory loop was more activated in expressive FN than in flat FN, as evidenced by both analyses of effects of expressive FN > flat FN presentations and ANOVAs (F1,11 = 7.247, P < 0.0021 for BA 6 and F1,11 = 26.007, P < 0.0003 for BA 44). In the same way, expressive FN > flat FN induced an involvement of the right prefrontal cortex (F1,11 = 5.406 P < 0.0202 for BA 6 and F1,11 = 13.117, P < 0.0040 for BA 44), the inferior parietal gyrus bilaterally (BA 39‐40), (F1,11 = 5.382, P < 0.0046 for the left hemisphere, and F1,11 = 9.449, P < 0.0016 for the right hemisphere), and the left fusiform gyrus (BA 37). In addition, concerning the STG, bilateral BA 22 was found to be more involved in expressive FN than in flat FN (F1,11 = 7.370, P < 0.0120 for the left hemisphere and F1,11 = 8.345, P < 0.0014 for the right hemisphere). The reverse contrast did not reveal any significant activated areas (Table II).
Expressive vs. flat in NF
The STG was bilaterally activated (Table I, Figure 4), even if the flat condition significantly reduced activations (F1,11 = 18.241, P < 0.0013 for the left hemisphere, and F1,11 = 8.411, P < 0.0144 for the right hemisphere).
The expressive NF presentation induced significant activations in the left lateral prefrontal gyrus (F1,11 = 13.895, P < 0.0033).
Moreover, analyses of effects of expressive NF > flat NF presentations revealed a bilateral involvement of the orbito frontal gyrus (BA 10) and of the occipital cortex (BA 19) (Table II). The reverse contrast revealed a left involvement of the posterior insula and of the thalamus as well as a right cerebellar activation (Table II).
DISCUSSION
The most important result reported here is that the two listening conditions (FN and its counterpart NF) were found to recruit two different neural networks in the expressive condition, a finding which can be attributed to the prosodic factor proper, since the flat condition did not induce any significant differences between these two listening conditions. While both listening conditions induced bilateral activations of the STG without any significant differences whatever, the degree of prosodic content (expressive vs. flat), in the case of high degrees of prosodic content (expressive speech), the specific listening condition which consists in addressing the low‐pass‐filtered speech to the left ear (FN) resulted in an increase of the articulatory loop and a new recruitment of other areas such as the right prefrontal cortex (BA 6‐44), the left inferior parietal gyrus (BA 39‐40), the left posterior insula, as well as the posterior cingulate gyrus bilaterally. These results show that even if speech perception involves a very widespread, bilateral, and parallel working network in which many different brain areas are closely intertwined, the functional cerebral network largely depends on sensory integration, which is different for each listening condition.
Whatever the listening conditions and the nature of recorded speech (prosodic or flat), auditory areas subserving speech comprehension were found to be bilaterally activated, which is in accordance with neuroimaging studies on the processing of spoken words [Binder et al., 2000; Mazoyer et al., 1993] and sentences [Dehaene et al., 1997; Kuperberg et al., 2000; Meyer et al., 2002]. Moreover, neither the order of presentation of connected speech stimuli (i.e., whether the expressive speech stimulus was presented in first or second place), nor the orders of presentation of listening conditions induced any significant differences in the recruited neuronal patterns. However, in the present experiment group analysis as well as individual analysis revealed that the expressive FN and NF conditions did not induce a left STG dominance, contrary to the findings of previous studies focusing on general syntactic operations at sentence level [Friederici et al., 2000; Humphries et al., 2001; Meyer et al., 2000; Scott et al., 2000]. Methodological differences such as the duration of the stimuli and the nature of the task may account for this discrepancy in results. In addition, in the case of flat presentation, bilateral activations in the STG were still observed, but they were weaker than those induced by expressive speech (Fig. 3). A pilot study conducted before the fMRI experiment revealed that when expressive speech was presented in a flat tone (even if presented before expressive speech), subjects reported that by subvocalizing they could not help retrieving the specific prosodic aspects of the well‐known declamation used. That is why, to make sure that prosodic vs. aprosodic discrimination would be effective, two speech stimuli differing in their semantic content were proposed.
However, the major point here is to account for these different neuronal networks since the length of the stimuli (30 s) should have allowed for information transfer via the corpus callosum. In fact, the present experiment seeking to preferentially solicit each hemisphere simultaneously in order to favor a better integration of the prosodic factor hypothesized that the manipulation which consists in addressing an acoustic subset of a connected speech stimulus to one ear while the whole message is addressed to the other ear would be a means of preferentially involving contralateral connections. In a competitive situation, numerous studies have shown that under dichotic listening (DL) conditions, lexical material such as words is detected more easily in the right ear in subjects with a language dominant hemisphere [for review, see Hugdahl, 1995]. This degree of ear advantage for a task with hemispheric specialization has been reported as a function of acoustic competition over very short durations (20–40 ms). In the present experiment, although the term DL may appear a misuse of language given the duration of the stimuli (30 s), it is assumed that there does exist a competitive situation which is based on spectral and/or durational temporal windows, allowing for a preferential involvement of the right STG when low‐frequency bands of speech are presented to the left ear while the whole spectrum is presented to the left STG via the right ear. In other words, whatever its length, the stream of sounds must be divided into temporal windows whose length must differ according to each hemisphere, which is in line with the “asymmetric sampling in time” (AST) hypothesis [Poeppel, 2003] and with results from Belin et al. [1998], who reported that auditory processing of rapid acoustic transitions was left lateralized in the human brain. In fact, the AST hypothesis, which posits that this temporal asymmetry seems to be generated by small differences in neuronal integration constants, is based on both psychological and electrophysiological evidence which suggested that the perceptual information is analyzed in temporally delimited windows, underlying the discontinuous processing in the time domain [Hirsh and Watson, 1996; Näätänen, 1992; Pöppel, 1997; Theunissen and Miller, 1995; Viemeister and Plack, 1993; Warren, 1999]. In particular, Poeppel et al. [2004] reported that rapid frequency modulation (FM) sweeps processing (40 ms) were left‐lateralized, whereas slow FM sweeps processing (300 ms) were right‐lateralized. Taken together, these observations as well as the different neuronal networks induced by each listening condition in the present experiment strongly suggest that the specific FN listening condition does allow for a better integration of the prosodic factor than its reverse position. Contrary to the “double filtering by frequency” (DFF) model [Ivry and Robertson, 1998], which posits that higher vs. lower frequency of a stimulus are relative to the attentional defined spectral point, the present hypothesis rather assumes that the preferential right STG involvement in low frequencies processes is simply a part of the architecture of the speech‐processing system, independent of the attentional system.
There is ample evidence that speech perception requires such a highly distributed network that many brain regions beyond the traditional language areas of Wernicke and Broca are involved, especially the right prefrontal cortex (BA 6‐44). The prefrontal activations revealed by our results vary according to the listening conditions. Both the expressive FN and NF conditions yielded a left prefrontal activation (BA 6‐44) (although NF significantly reduced these activations compared to FN), which is in accordance with previous work suggesting a functional connection between the auditory cortex and the prefrontal associative cortex involved both in the retrieval and rehearsal of auditory information and in auditory working memory [Buchanan et al., 2000; Demonet et al., 1992; Zatorre et al., 1992, 1996]. Broca's area (left BA 44) has also been reported to be activated during speech perception [Baddeley et al., 1992; Caplan et al., 2000; Mazoyer et al., 1993; Paulesu et al., 1993; Poldrack et al., 1999]. More specifically, this left frontal operculum activation, as suggested by its suppression in flat speech presentation, may reflect rhythm processes, as revealed by many studies underlining the involvement of Broca's area (as well as of its right counterpart) in temporal analyses [Fiez et al., 1995; Platel et al., 1997; Schubotz et al., 2000; Tallal et al., 1993].
Moreover, the right prefrontal activation (BA 6‐44) only revealed in the expressive FN condition (the flat FN presentation suppressed it) strongly suggests a specific involvement of this right prefrontal area in the processing of prosodic information. This was strengthened by results from both individual and group ANOVAs, which suggest that (1) the differences between the listening conditions depend on the prosodic information, and (2) these differences do not concern the STG but other areas such as the articulatory loop, its right counterpart, and the left inferior parietal gyrus. A right hemispheric dominance for the recognition of the so‐called emotional prosody has been widely assumed by neuroimaging studies [Breitenstein et al., 1998; George et al., 1996; Imaizumi et al., 1997; Ross et al., 1997]. More specifically, rhythm analysis tasks have revealed either a bilateral prefrontal activation—BA 6‐44 [Schubotz et al., 2000]—or a right‐lateralized one [Riecker et al., 2000; Zatorre et al., 1992, 1994]. All these results were obtained by asking subjects to determine differences between stimuli presented in binaural listening conditions, whereas the right prefrontal activation revealed in the present study was induced by a particular listening strategy in which subjects were not asked to perform any tasks. Indeed, this specific right prefrontal activation could be attributed to a direct delivery of acoustic information restricted to F0 modulations, i.e., prosody.
When compared to NF (Table II), FN was found to recruit left cortical areas specifically such as the angular gyrus (BA 39) and the supramarginal gyrus (BA 40), as well as the left posterior insula. The left inferior parietal lobule has been widely described as playing a role in speech comprehension processing and more particularly as being involved both (1) in the processing of auditory spatial information, the “where” pathway [Rauschecker et al., 2000; Weeks et al., 1999; Zatorre et al., 1992], and (2) in the processing of passive phonological store [Paulesu et al., 1993; Shallice and Vellar, 1990; Wildgruber et al., 1999]. A handful of studies have also reported an involvement of the posterior insula of both hemispheres in the process of emotional information [Bush et al., 2000; Davidson et al., 1999; Devinsky et al., 1995; Maddock, 1997; Raichle et al., 1994; Wildgruber et al., 2001; Zatorre et al., 1992]. Even if the precise function of the insula remains unclear, the aforementioned studies as well as other brain lesion studies seem to lend credence to the idea of an involvement of the insula in verbal‐auditory processing.
GENERAL CONCLUSIONS
The specific sensory integration which consists in presenting the low frequencies bands of a 30‐s continuous speech—by keeping frequencies from 0–350 Hz—to the right hemisphere, whereas the entire acoustic spectrum is presented simultaneously to the left hemisphere, recruits a much wider neuronal network in case of prosodic content than the reverse listening condition does. This finding, which strongly suggests that information transfer via the corpus callosum does not occur in spite of the length of the stimulus may be accounted for by the existence of temporal windows differing both in length and in acoustic cues decoding, thus strengthening the AST hypothesis [Poeppel, 2003]. Moreover, it can be assumed that this specific FN listening condition allows for a better integration of the prosodic factor proper by triggering activations in a wider neuronal network involved in speech perception. Prospective studies are in progress, hypothesizing that such a prosodic integration improvement, although remaining useless in the case of the mother tongue in normal subjects, would appear to be relevant not only in the field of the rehabilitation of clinical aspects of speech disturbances such as aphasia or dyslexia, but also in the field of foreign language learning.
Acknowledgements
We thank Jacques Alliaume for stimulating discussion on FN stimulus, Dr. Didier Cugy for help with data collection and analysis, and Drs. Anne‐Marie Carassou and Ray Cooke for editing the English version of the manuscript.
REFERENCES
- Baddeley AD, Emslie H, Nimmo‐Smith I (1992): Speed and capacity of language processing (SCOLP) test. Bury St Edmunds (UK): Thames Valley Test Co. [Google Scholar]
- Belin P, Zilbovicius M, Crozier S, Thivard L, Fontaine A, Masure MC, Samson Y (1998): Lateralization of speech and auditory temporal pocessing. J Cogn Neurosci 10: 536–540. [DOI] [PubMed] [Google Scholar]
- Belin P, Zatorre RJ, Lafaille P, Ahad P, Pike B (2000): Voice‐selective areas in human auditory cortex. Nature 403: 309–312. [DOI] [PubMed] [Google Scholar]
- Binder JR, Frost MS (1998): Functional MRI studies of language processing in the brain. Neurosci News 1: 15–23. [Google Scholar]
- Binder JR, Frost JA, Hammeke TA, Rao SM, Cox RW (1996): Function of the left planum temporale in auditory and linguistic processing. Brain 119: 1239–1247. [DOI] [PubMed] [Google Scholar]
- Binder JR, Frost JA, Hammeke TA, Bellgowan PSF, Springer JA, Kaufman JN, Possing ET (2000): Human temporal lobe activation by speech and non‐speech sounds. Cereb Cortex 10: 512–528. [DOI] [PubMed] [Google Scholar]
- Breitenstein C, Van Lancker D, Kempler D, Daum I, Waters CH (1998): The contribution of working memory to the perception of emotional prosody in Parkinson's disease. Brain Lang 65: 243–246. [Google Scholar]
- Buchanan L, Kiss I, Burgess C (2000): Word and non‐word reading in a deep dyslexic: phonological information enhances performance. Brain Cogn 43: 65–68. [PubMed] [Google Scholar]
- Buchman A, Garron D, Trost‐Cardamone J, Witcher M, Schwartz M (1986): Word deafness: one hundred years later. J Neurol Neurosurg Psychiatry 49: 489–499. [DOI] [PMC free article] [PubMed] [Google Scholar]
- Buchsbaum B, Hickok G, Humphries C (2001): Role of left posterior superior temporal gyrus in phonological encoding for speech perception and production. Cogn Sci 25: 663–678. [Google Scholar]
- Burton MW, Small S, Blumstein SE (2000): The role of segmentation in phonological processing: an fMRI investigation. J Cogn Neurosci 12: 679–690. [DOI] [PubMed] [Google Scholar]
- Bush G, Luu P, Posner MI (2000): Cognitive and emotional influence in anterior cingulate cortex. Trends Cogn Sci 4: 215–222. [DOI] [PubMed] [Google Scholar]
- Cancelliere A, Kertesz A (1990): Lesion localization in acquired deficits of emotional expression and comprehension. Brain Cogn 13: 133–147. [DOI] [PubMed] [Google Scholar]
- Caplan D, Alpert N, Waters G, Olivieri A (2000): Activation of Broca's area by syntactic processing under conditions of concurrent articulation. Hum Brain Mapp 9: 65–71. [DOI] [PMC free article] [PubMed] [Google Scholar]
- Davidson RJ, Irwin W (1999): The functional neuroanatomy of emotion and affective style. Trends Cogn Sci 3: 11–21. [DOI] [PubMed] [Google Scholar]
- Dehaene S, Dupoux E, Mehler J, Cohen L, Paulesu E, Perani D, van de Moortele P, Lehricy S, Le Bihan D (1997): Anatomical variability in the cortical representation of first and second language. Neuroreport 8: 3809–3815. [DOI] [PubMed] [Google Scholar]
- Démonet JF, Chollet F, Ramsay S, Cardebat D, Nespoulous JL, Wise R, Rascol A, Frackowiak RSJ (1992): The anatomy of phonological and semantic processing in normal subjects. Brain 115: 1753–1768. [DOI] [PubMed] [Google Scholar]
- Devinsky O, Morrell MG, Vogt BA (1995): Contributions of anterior cingulate cortex to behaviour. Brain 118: 279–306. [DOI] [PubMed] [Google Scholar]
- Fiez JA, Tallal P, Raichle ME, Katz WF, Miezin FM, Petersen SE (1995): PET studies of auditory and phonological processing: effects of stimulus type and task condition. J Cogn Neurosci 7: 357–375. [DOI] [PubMed] [Google Scholar]
- Friederici AD, Meyer M, von Cramon DY (2000): Auditory language comprehension: an event related fMRI study on the processing of syntactic and lexical information. Brain Lang 75: 465–477. [PubMed] [Google Scholar]
- Friston KJ, Ashburner J, Poline JB, Frith CD, Heather JD, Frackowiak RSJ (1995): Spatial registration and normalization of images. Hum Brain Mapp 2: 165–189. [Google Scholar]
- George MS, Parekh PI, Rosinsky N (1996): Understanding emotional prosody activates right hemisphere regions. Arch Neurol 53: 665–670. [DOI] [PubMed] [Google Scholar]
- Grabowski TJ, Damasio AR (2000): Investigating language with functional neuroimaging In: Toga AW, Mazziota JC, editors. Brain mapping: the systems. San Diego: Academic Press; p 425–461. [Google Scholar]
- Griffiths TD, Buchel C, Frackowiak RSJ, Patterson RD (1998): Analysis of temporal structure in sound by the human brain. Nat Neurosci 1: 422–427. [DOI] [PubMed] [Google Scholar]
- Hickok G, Poeppel D (2000): Towards a functional neuroanatomy of speech perception. Trends Cogn Sci 4: 131–138. [DOI] [PubMed] [Google Scholar]
- Hickok G, Poeppel D (2004): Dorsal and ventral streams: a framework for understanding aspects of the functional anatomy of language. Cognition 92: 67–99. [DOI] [PubMed] [Google Scholar]
- Hirsh I, Watson CS (1996): Auditory psychophysics and perception. Annu Rev Psychol 47: 461–484. [DOI] [PubMed] [Google Scholar]
- Hugdahl K (1995): Dichotic listening: probing temporal lobe functional integrity In: Davidson RG, Hugdahl K, editors. Brain asymmetry. Cambridge, MA: MIT Press; p 123–156. [Google Scholar]
- Humphries C, Buchsbaum C, Hickok G (2001): Role of the anterior temporal cortex in auditory sentence comprehension: an fMRI study. Neuroreport 12: 1749–1752. [DOI] [PubMed] [Google Scholar]
- Imaizumi S, Mori K, Kiritani S, Kawashima R, Sugiura M, Fukuda H, Itoh K, Kato T, Nakamura A, Hatano K, Kojima S, Nakamura K (1997): Vocal identification of speaker and emotion activates different brain regions. Neuroreport 8: 2809–2812. [DOI] [PubMed] [Google Scholar]
- Ivry R, Robertson LC (1998): The two sides of perception. Cambridge, MA: MIT Press, Series in Cognitive Neurosciences. [Google Scholar]
- Klein D, Zatorre RJ, Milner B, Zhao V (2001): A cross‐linguistic PET study of tone perception in Mandarin Chinese and English speakers. Neuroimage 13: 646–653. [DOI] [PubMed] [Google Scholar]
- Kreiman J, Van Lancker D (1988): Hemispheric specialization for voice recognition: evidence from dichotic listening. Brain Lang 34: 246–252. [DOI] [PubMed] [Google Scholar]
- Kuperberg GR, Mc Guire PK, Bullmore ET, Brammer MJ, Rabe‐Hesketh S, Wright IC, Lythgoe DJ, Williams SCR, David AS (2000): Common and distinct neural substrates for pragmatic, semantic, and syntactic processing of spoken sentences: an fMRI study. J Cogn Neurosci 12: 321–341. [DOI] [PubMed] [Google Scholar]
- Maddock RJ, Buonocore MH (1997): Activation of left posterior cingulate gyrus by the auditory presentation of treat‐related words: an fMRI study. Psychiatry Res 5: 1–14. [DOI] [PubMed] [Google Scholar]
- Mazoyer BM, Tzourio N, Frak V, Syrota A, Murayama N, Levrier O, Salamon G, Dehaene S, Cohen L, Mehler J (1993): The cortical representation of speech. J Cogn Neurosci 5: 467–479. [DOI] [PubMed] [Google Scholar]
- Meyer M, Friederici AD, von Cramon DY (2000): Neurocognition of auditory sentence comprehension: event‐related fMRI reveals sensitivity violations and task demands. Brain Res Cogn Brain Res 9: 19–33. [DOI] [PubMed] [Google Scholar]
- Meyer M, Alter K, Friederici AD, Lohmann G, von Cramon DY (2002): fMRI reveals brain regions mediating slow prosodic modulations in spoken sentences. Hum Brain Mapp 17: 73–88. [DOI] [PMC free article] [PubMed] [Google Scholar]
- Mummery CJ, Ashburner J, Scott SK, Wise RJ (1999): Functional neuroimaging of speech perception in six normal and two aphasic subjects. J Acoust Soc Am 106: 449–457. [DOI] [PubMed] [Google Scholar]
- Näätänen R (1992): Attention and brain function. Hillsdale, NJ: Lawrence Erlbaum. [Google Scholar]
- Norris D, Wise R (2000): The study of prelexical and lexical processes in comprehension: psycholinguistics and functional neuroimaging In: Gazzinga M. editor. The new cognitive neurosciences Cambridge, MA: MIT Press. [Google Scholar]
- Paulesu E, Frith CD, Frackowiak RSJ (1993): The neural correlates of the verbal components of working memory. Nature 362: 342–345. [DOI] [PubMed] [Google Scholar]
- Pell MD, Baum SR (1997): The ability to perceive and comprehend intonation in linguistic and affective contexts by brain‐damaged adults. Brain Lang 57: 80–89. [DOI] [PubMed] [Google Scholar]
- Platel H, Price C, Baron JC, Wise R, Lambert J, Frackowiak RSJ (1997): The structural components of music perception: a functional anatomical study. Brain 120: 229–243. [DOI] [PubMed] [Google Scholar]
- Poeppel D (2003): The analysis of speech in different temporal integration windows: cerebral lateralization as “asymmetric sampling in time.” Speech Commun 41: 245–255. [Google Scholar]
- Poeppel D, Guillemin A, Thompson J, Fritz J, Bavelier D, Braun AR (2004): Auditory lexical decision, categorical perception, and FM direction discrimination differentially engage left and right auditory cortex. Neuropsychologia 42: 183–200. [DOI] [PubMed] [Google Scholar]
- Poldrack RA, Wagner AD, Prull MW, Desmond JE, Glover GH, Gabrieli JDE (1999): Functional specialization for semantic and phonological processing in the left inferior prefrontal cortex. Neuroimage 10: 15–35. [DOI] [PubMed] [Google Scholar]
- Pöppel E (1997): A hierarchical model of temporal perception. Trends Cogn Sci 1: 56–61. [DOI] [PubMed] [Google Scholar]
- Raichle ME, Fiez JA, Videen TO, McLeod AM, Pardo JV, Fox PT, Petersen SE (1994): Practice‐related changes in human brain functional anatomy during non‐motor learning. Cereb Cortex 4: 8–26. [DOI] [PubMed] [Google Scholar]
- Rauschecker JP, Tian B (2000): Mechanisms and stream for processing “what” and “where” in auditory cortex. Proc Natl Acad Sci U S A 97: 11800–11806. [DOI] [PMC free article] [PubMed] [Google Scholar]
- Riecker A, Ackermann H, Wildgruber D, Dogil G, Grodd W (2000): Opposite hemispheric lateralization effects during speaking and singing at motor cortex, insula and cerebellum. Neuroreport 11: 1997–2000. [DOI] [PubMed] [Google Scholar]
- Ross ED, Thompson RD, Yenkosky J (1997): Lateralization of affective prosody in brain and the callosal integration of hemispheric language functions. Brain Lang 56: 27–54. [DOI] [PubMed] [Google Scholar]
- Schlosser MJ, Aoyagi N, Fulbright RK, Gore JC, McCarthy G (1998): Functional MRI studies of auditory comprehension. Hum Brain Mapp 6: 1–13. [DOI] [PMC free article] [PubMed] [Google Scholar]
- Schubotz RI, Friederici AD, Von Cramon DY (2000): Time perception and motor timing: a common cortical and subcortical basis revealed by fMRI. Neuroimage 11: 1–12. [DOI] [PubMed] [Google Scholar]
- Scott SK, Johnsrude IS (2003): The neuroanatomical and functional organization of speech perception. Trends Neurosci 26: 100–107. [DOI] [PubMed] [Google Scholar]
- Scott SK, Blank CC, Rosen S, Wise RJS (2000): Identification of a pathway for intelligible speech in the left temporal lobe. Brain 123: 2400–2406. [DOI] [PMC free article] [PubMed] [Google Scholar]
- Seger CA, Desmond JE, Glover GH, Gabrieli JD (2000): Functional magnetic resonance imaging evidence for right‐hemisphere involvement in processing unusual semantic relationships. Neuropsychology 14: 361–369. [DOI] [PubMed] [Google Scholar]
- Shallice T, Vellar G (1990): The impairment of auditory verbal short‐term storage In: Vellar G, Shallice T, editors. Neuropsychological impairments of short‐term memory. Cambridge, UK: Cambridge University Press. [Google Scholar]
- Sidtis JJ (1980): On the nature of the cortical function underlying right hemisphere auditory perception. Neuropsychologia 18: 321–330. [DOI] [PubMed] [Google Scholar]
- Sidtis JJ (1984): Music, pitch perception and the mechanisms of cortical hearing. Handbook of cognitive science. New York: Plenum Press. [Google Scholar]
- Sidtis JJ, Feldmann E (1990): Transient ischemic attacks presenting with a loss of pitch perception. Cortex 26: 469–471. [DOI] [PubMed] [Google Scholar]
- Sidtis JJ, Volpe BT (1988): Selective loss of complex‐pitch or speech discrimination after unilateral lesions. Brain Lang 34: 235–245. [DOI] [PubMed] [Google Scholar]
- Sjölander K, Beskow J (2000): WaveSurfer — an open source speech tool. Bejing, China: Proceedings of ICSLP.
- Talairach J, Tournoux P (1988): Co‐planar stereotaxic atlas of the human brain. New York: Thieme. [Google Scholar]
- Tallal P, Miller S, Fitch R (1993): Neurobiological basis of speech: a case for the pre‐eminence of temporal processing. In: Tallal P, Galaburda AM, Llinas R, von Euler editors. Temporal information processing in the nervous system: special reference to dyslexia and dysphasia. Ann N Y Acad Sci 682: 27–47. [DOI] [PubMed] [Google Scholar]
- Theunissen F, Miller JP (1995): Temporal encoding in nervous systems: a rigorous definition. J. Comput Neurosci 2: 149–162. [DOI] [PubMed] [Google Scholar]
- Van Lancker D, Sidtis JJ (1992): The identification of affective‐prosodic stimuli by left‐and right‐hemisphere‐damaged subjects: all errors are not created equal. J Speech Hear Res 35: 963–970. [DOI] [PubMed] [Google Scholar]
- Viemeister NF, Plack CJ (1993): Time analysis In: Yost WA, Popper AN, Fay RR, editors. Human psychophysics. New York: Springer. [Google Scholar]
- Warren RM (1999): Auditory perception. Cambridge, UK: Cambridge University Press. [Google Scholar]
- Warren JD, Zielinski BA, Green GG, Rauschecker JP, Griffiths TD (2002): Perception of sound source motion by the human brain. Neuron 34: 139–148. [DOI] [PubMed] [Google Scholar]
- Weeks RA, Aziz‐Sultan A, Bushara KO, Tian B, Wessinger CM, Dang N, Rauschecker JP, Hallett M (1999): A PET study of human auditory spatial processing. Neurosci Lett 252: 155–158. [DOI] [PubMed] [Google Scholar]
- Wildgruber D, Kischka U, Ackermann H, Klose U, Grodd W (1999): Dynamic pattern of brain activation during sequencing of word strings evaluated by fMRI. Brain Res Cogn Brain Res 7: 285–294. [DOI] [PubMed] [Google Scholar]
- Wildgruber D, Ackermann H, Grodd W (2001): Differential contributions of motor cortex, basal ganglia, and cerebellum to speech motor control: effects of syllable repetition rate evaluated by fMRI. Neuroimage 13: 101–109. [DOI] [PubMed] [Google Scholar]
- Zatorre RJ (1988): Pitch perception of complex tones and human temporal‐lobe function. J Acoust Soc Am 84: 566–572. [DOI] [PubMed] [Google Scholar]
- Zatorre RJ, Belin P (2001): Spectral and temporal processing in human auditory cortex. Cereb Cortex 11: 946–953. [DOI] [PubMed] [Google Scholar]
- Zatorre RJ, Evans AC, Meyer E, Gjedde A (1992): Lateralization of phonetic and pitch discrimination in speech processing. Science 256: 846–849. [DOI] [PubMed] [Google Scholar]
- Zatorre RJ, Evans AC, Meyer E (1994): Neural mechanisms underlying melodic perception and memory for pitch. J Neurosci 14: 1908–1919. [DOI] [PMC free article] [PubMed] [Google Scholar]
- Zatorre RJ, Halpern AR, Perry DW, Meyer E, Evans AC (1996): Hearing in the mind's ear: a PET investigation of musical imagery and perception. J Cogn Neurosci 8: 29–46. [DOI] [PubMed] [Google Scholar]
- Zatorre RJ, Belin P, Penhunen VB (2002): Structure and function of auditory cortex: music and speech. Trends Cogn Sci 6: 37–46. [DOI] [PubMed] [Google Scholar]