

Abstract
We have previously shown that event‐related functional magnetic resonance imaging (ER‐fMRI) may be used to record responses to the rapid, interleaved presentation of stimuli in the three‐stimulus oddball task. The present study examined the sensitivity of ER‐fMRI responses to variations in the range of inter‐stimulus intervals (ISIs, calculated as the time from the offset of one stimulus to the onset of the next stimulus) and the type of behavioral response task used. ISIs were varied between a wide ISI range (550–2,050 msec) and a narrow ISI range (800–1,200 msec), while maintaining a similar mean ISI (approximately 1 stimulus per sec) between experiments. The response task was varied between button press and subvocal target counting. Gradient echo, echo planar images were acquired for each of three experiments (wide ISI with button press, narrow ISI with button press, and wide‐ISI with counting) in five subjects. Target stimuli generated increased fMRI signal in a wide range of brain regions. The use of a narrow ISI range generated a greater volume of subcortical activity and a reduced volume of cortical activity relative to a wide ISI range. The counting task generated a larger amplitude and longer lasting evoked response in brain regions that responded during all three experiments. Rare distractor stimuli evoked fMRI signal change primarily in orbitofrontal, ventral‐medial prefrontal and superior parietal cortex. These results illustrate that although ER‐fMRI is relatively insensitive as a technique to small variations in the timing of stimulus‐evoked responses, it is remarkably sensitive to consequences such variations have for the topographic location and amplitude of neural responses to stimuli. Hum. Brain Mapping 14:116–127, 2001. © 2001 Wiley‐Liss, Inc.
Keywords: brain mapping, neuroimaging, cognition, attention, visual cortex, psychophysiology, arousal, event‐related potentials, magnetic resonance imaging
INTRODUCTION
Infrequent target stimuli generate the P3 or P300 event‐related potential (ERP) component, which has a positive scalp polarity that peaks within 300–600 msec after stimulus presentation. The P3 is one of the largest and most ubiquitous of the ERP components. Multiple P3 sub‐components have been observed, including the P3a and P3b, which differ in latency and topography. These components may be elicited using the three‐stimulus oddball task, which involves the presentation of rare target stimuli that evoke the P3b component, and rare distractor stimuli, which evoke the P3a. These P3 sub‐components have provided useful information for the study of brain function in CNS disorders [Bauer, 1997; Polich, 1998; Knight, 1984].
Although ERPs offer exquisite temporal resolution for the description of neural events, and are relatively inexpensive to perform, a variety of obstacles have limited the application of this method for clinical and experimental studies. Of primary concern is that many different versions of the oddball task have been used previously that differed in the exact stimulus parameters and behavioral response task used. Such variations can influence the neural responses to stimuli, making comparisons across studies problematic. For instance, P3 amplitude has been found to be larger as target presentation becomes less predictable and more “surprising” [Donchin, 1981]. The P3 occurs not only in response to unexpected physical differences between stimuli, but also to stimuli occurring at unexpected points in time, or not occurring at expected points in time. Previous studies have also found an effect of behavioral response task on P3 amplitude and latency. Polich [1987] found that having subjects count the number of targets led to a larger and slightly later P3 component compared to having subjects responding with a manual button press. Although P3 components with comparable topography have been generated in these different studies, subtle difference have been observed that suggest that response amplitude or the anatomical location of the neural responses to stimuli may differ depending on the specific task parameters used, and that this alters the ERP amplitude recorded at the scalp surface [Polich and Kok, 1995; Swick and Knight, 1998]. Differences in the precise anatomical locations of activity evoked between paradigms could be used to help guide the design of experiments meant to assess activity within specific brain regions, if such specificity were known.
This leads to a second concern regarding previous P3 ERP research, namely the limited anatomical resolution of scalp‐recorded ERP data. This results from the spatial summation and smoothing of activity across large sections of brain tissue when ERPs are recorded from the scalp, due in part to the high resistivity of the skull. Voltage amplitude falls off as the square of the distance between the site of ERP generation and the recording electrodes, resulting in the emphasis of superficial activity located nearby the scalp recording electrodes, while minimizing contributions from deeper sources, including subcortical regions. One possible effect of this limited anatomic resolution is that similar changes in ERP amplitude have been observed for a variety of illnesses that differ greatly in their etiology [Polich, 1992]. The spatial filtering inherent in ERP generation may reduce anatomic specificity that might be helpful in the analysis of abnormalities in specific brain regions associated with certain CNS disorders. Methods designed to infer the anatomic locations of scalp‐recorded ERP generators are limited by the under‐determination of the inverse problem [Helmholtz, 1853], which limits the accuracy and precision of these algorithms. Improved anatomic resolution can be obtained by recording ERPs from brain tissue directly using electrodes implanted to monitor epileptic activity and in other severe CNS disorders [Baudena et al., 1995; Halgren et al., 1995a,b]. Although this method has provided valuable information in these clinical populations, it cannot be used where such invasive electrode placements are not typically performed.
Alternative methods must be used to identify the anatomical locations of stimulus‐evoked responses in healthy subjects. This may provide a more sensitive measure of stimulus and task effects in the oddball task, and may eventually provide a more sensitive measure of CNS involvement in neurological disorders besides epilepsy. Event‐related functional magnetic resonance imaging (ER‐fMRI) provides one method whereby the anatomical locations of stimulus‐evoked responses can be identified. The temporal resolution of ER‐fMRI is greatly limited by the delay and dispersion of the hemodynamic response, which limits its application to questions regarding the effects of changes in stimulus timing. The exquisite spatial resolution of fMRI, however, provides a mechanism for assessing the effects of changes in stimulus timing on neural activity through the analysis of changes in the anatomical distribution and altered metabolic activity observed in the evoked response. This method was used in the present study to examine differences in regional activity between versions of the oddball task where the range of variability in ISI and response task were varied.
MATERIALS AND METHODS
To precisely replicate previous ERP studies using rapid rates of stimulus presentation (averaging 1 sec/stimulus), we have developed a method whereby rapid, randomly ordered and interleaved stimulus trains may be used with fMRI that are identical in every respect with previous ERP paradigms [Clark et al., 1998, 2000]. A variable ISI was employed, which adds significant power and discriminability to the analysis when rapid rates of stimulus presentation are used [Burock et al., 1998]. Five healthy right‐handed subjects (2 women, mean age 29 years) were tested using three separate versions of the three‐stimulus oddball task. Each subject was tested on three separate days to ensure that complete datasets were acquired for each. Also, by acquiring data on separate days, we expected that subjects were less likely to count targets during the button press condition, or to initiate a right thumb response during the count condition. Multiple linear regression was used to identify responses to different stimuli [Friston et al., 1995]. This method provides better statistical power and discriminability between interleaved stimulus conditions when compared with other methods of fMRI data analysis. It also provides a method for examining higher‐order stimulus responses that are dependent on the recent history of stimulus presentation, in addition to the main effect of stimulus presentation, as discussed below.
Paradigm development
The order of experiments was varied across subjects. Stimuli were frequent standard stimuli (the letter “T”), rare distractor stimuli (the letter “C”), and rare target stimuli (the letter “X”) single black letter stimuli presented on a white background sequentially for 200 msec each. Pseudo‐random stimulus sequences were presented in a randomized, interleaved order. The range of inter‐stimulus intervals (ISI range) and the method of behavioral response were varied across experiments. In Experiments 1 and 2, ISI was varied randomly from 550 msec to 2,050 msec across trials (the wide ISI condition), while in Experiment 3, ISI was varied between 800 and 1,200 msec (the narrow ISI condition). In Experiments 1 and 3, subjects were instructed to make a speeded right thumb button press response to each presentation of the target letter (the button press condition), whereas in Experiment 2, subjects counted the number of targets and reported the number verbally at the end of each run (the count condition). Total data acquisition time was 36 min per experiment, split into runs of approximately 3 min each. The exact duration of runs varied due to random variability inherent in the stimulus sequence development process, described below. Approximately 1,200 stimuli were presented to each subject during each experiment when summed across individual runs, including 120 of each rare type (120 targets and 120 distractors). Each run began with a series of warning stimuli (“Ready,” “Set,” “Go” …) that began coincident with the initiation of scanning and lasted a total of 8.6 sec before the first trial. Target and distractor sequences were exchanged between runs to ensure that their presentation was equated within experiments, and that any differences found between rare stimulus types were not confounded by differences in stimulus presentation.
Methods of stimulus development and data analysis have been previously described [see Clark et al., 1998, 2000]. Briefly, many random stimulus sequences were generated. For each sequence, the expected main effect neural responses to the three stimulus types were modeled as square waves with the same time course as the stimuli (on = 1, off = 0). A model of the expected BOLD response was modeled by convolving these square waves with a Gaussian model of the hemodynamic response function using experimentally derived values (SD = 1.8 sec, delay = 4.8 sec) [Maisog et al., 1995]. Stimulus sequences were selected for use in this experiment that had non‐significant correlations of predicted hemodynamic responses to rare target, rare distractor, and frequent standard stimuli of (|r| < 0.2). Thus, the predicted responses to the three types of stimuli embedded in each sequence were nearly orthogonal. To remove the potentially confounding differences in presentation sequences between target and distractor stimuli, target and distractor sequences were exchanged between runs. This resulted in exactly identical sequences of target and distractor stimuli presented within each experiment, and ensured that activation differences between target and distractor stimuli were not confounded by presentation sequences. Identical stimulus sequences were used for Experiments 1 and 2, whereas different stimulus sequences (using the narrow ISI range) were used in Experiment 3. Due to random variation, some subtle differences in mean ISI and stimulus frequency were present in sequences chosen for use in the wide and narrow ISI conditions, as shown in Table I.
Table I.
Stimulus conditions and response task for experiments
| ISI Range (msec) | Mean ISI (msec) | Rare stimulus probability* | Target response method | |
|---|---|---|---|---|
| Experiment 1 | 550–2050 | 1203 | 8.8% | Button press |
| Experiment 2 | 550–2050 | 1203 | 8.8% | Counting |
| Experiment 3 | 800–1200 | 999 | 10.6% | Button press |
Rare stimulus probability is the proportion of either the target or distractor stimuli to all stimuli presented in the experiment. As the sequence of target and distractor stimuli were switched between runs, both stimulus types had identical proportions within an experiment.
fMRI PROCEDURES
Data were collected from five different subjects on 3 separate days, for a total of 15 scanning sessions. Informed consent was obtained from the subjects after the nature of the experimental procedures was explained. The order of the three experiments was varied across subjects to reduce the possibility of order effects. A Siemens Vision 1.5 Tesla MRI system was used, with single‐shot gradient echo, echo‐planar imaging (EPI), (TE = 40 msec, repetition time (TR) = 2.15 sec, FOV 25.6 mm, 20 oblique/axial slices, 6 mm thick, in‐plane resolution 4 mm2). The whole neocortex and dorsal cerebellum were imaged. An additional 12.9 sec of EPI data (6 TRs) were collected after the last stimulus trial to fully assess the hemodynamic response to stimuli presented near the end of each run. High‐resolution T1‐weighted inversion‐recovery MPRAGE images were acquired in the same orientation to obtain anatomical information.
Analysis
Spatial registration and normalization were performed using SPM99. After normalization, data were spatially smoothed to 1 cm3 FWHM resolution by convolution with a Gaussian smoothing kernel. Individual voxels were selected for analysis that had a mean intensity that was at least 10% of the maximum intensity found across all voxels when averaged across all time points. Multiple regression was performed for each experiment separately using the functional imaging data analysis platform (FIDAP), and these results were compared across experiments. Multiple regression is a standard parametric statistical procedure based on the general linear model. Multiple regression derives a weighted sum of regressors designed to model the expected hemodynamic response to each stimulus type (in this case, target, distractor, and standard stimuli) that together predict the hemodynamic response. Time series following the stimulus time course were modeled separately for each stimulus main effect (target, distractor, and standard stimuli) and for linear trends in signal change with repeated stimulus presentation (target linear trend, distractor linear trend). The linear trend regressors modeled the response to each successive stimulus presented within one experimental run in a linearly graded fashion, from a maximum of one polarity for the first stimulus to a maximum in the opposite polarity for the last stimulus (Fig. 1). The linear trend regressors were completely uncorrelated and therefore orthogonal with the main effect regressors. These models of neural metabolic response were then used to model the expected hemodynamic response by convolution with a Gaussian model of the hemodynamic response function (delay = 4.8 sec, SD = 1.8 sec) [Maisog et al., 1995]. Mean differences between runs and linear ramping effects within runs were removed using additional regressors. The weighted sum of these regressors that best fit the experimentally obtained timecourse were computed using least squares separately for each voxel. The resulting F and df for the effects of interest were adjusted for temporal overlap [Maisog et al., 1995], and converted to Z statistic. A test of spatial contiguity was then performed separately on regions with positive and negative direction of signal change (voxel‐wise |Z| > 3.09, region‐wise P < 0.05) with identified regions of interest (ROIs) [Friston et al., 1994]. Once these were obtained, ROIs overlapping across the three experiments were identified. Stimulus‐onset time locked average time series were obtained for ROIs for the three stimulus types.
Figure 1.
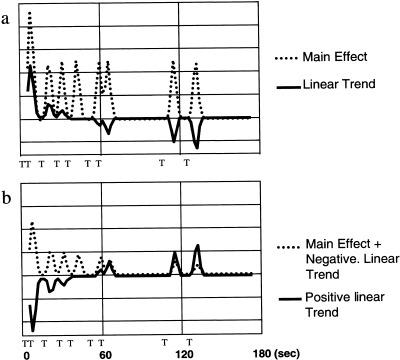
Example regressors used in this experiment. (a) Modeled hemodynamic response time series (black lines) shown for the target stimuli for one representative run. Approximate time of presentation of each target stimulus in this run shown as the letter “T” placed below the abscissa. Main effect regressor (dotted line) modeled average stimulus response magnitude. Linear trend regressor (solid line) modeled response amplitude as dependent upon the number of prior stimuli presented in this run, as shown. Responses overlapping in time were modeled as adding in a linear manner, explaining the large early response in both regressors. Similar regressors were used for distractor stimuli, following the time course of distractor stimulus presentation. (b) Two examples of weighted linear sums of main effect and linear trend regressors. Dotted line shows predominant main effect regressor with some diminution of response modeled by the addition of a negative linear trend regressor. This combination models a predominant main effect with a small reduction over stimulus repetitions due to habituation. Solid line shows linear trend regressor inverted, with no contribution from main effect regressor. This negative to positive pattern of response was found to predominate for the distractor stimulus in orbitofrontal cortex.
RESULTS
Behavioral data
Subjects performed well in all experiments. In Experiment 1 (using wide‐ISI range and button press), subjects detected target stimuli with an average reaction time of 491 msec (SD 46 msec) and an average 98.4% correct hits (SD 6%) and 0.54% (SD 2.2%) false alarms to distractor stimuli. Subjects performed at an equivalent level in Experiment 3 (using a narrow‐ISI range and button press), with an average reaction time of 485 msec (SD 54 msec) and an average 94.8% correct hits (SD 10.6%) and 0.28% (SD 1.2%) false alarms to distractor stimuli. Subjects tended to slightly under‐report the number of targets in the counting task, reporting an average of 93% of targets (SD 17%). No reaction time or false alarm data could be obtained in the counting task.
Target stimuli
All experiments
Regions were found that showed a significant main effect of target stimulus presentation that overlapped across all three experiments (Fig. 2a). Significant signal increases were observed for all experiments in the bilateral middle frontal gyri (BA9), the left inferior frontal gyrus, and in the bilateral inferior parietal lobules (BA40) with a larger volume in the left inferior parietal lobule compared with the right.
Figure 2.

Regions responding to target stimuli in all experiments. (a) Regions that responded to target stimuli with a significant main effect of increased evoked signal intensity in all three experiments. Legend shows relative activation levels compared across the three tasks for this and all following figures. As illustrated in the legend in lower right of figure, regions that responded more during Experiment 1 (button press, wide‐ISI range) shown in red, regions that responded more during Experiment 2 (counting, wide‐ISI range) shown in green, regions responding more in Experiment 3 (button press, narrow ISI range) shown in blue. Regions responding to multiple tasks shown as a linear combination of red, green or blue depending on relative Z score value obtained for each. Spatially normalized statistical data averaged over all 5 subjects were plotted onto the normalized structural scan of one subject. Slices moving from left to right going from more inferior to more superior in the brain. (b) Percentage change in signal intensity in response to target stimuli relative to baseline, defined as the mean of the −2.15 sec and 0 sec time points. Data averaged across all voxels that responded with significant signal increases to all three tasks. Response for Experiment 1 (button press, wide‐ISI range) shown in thick red, Experiment 2 (counting, wide‐ISI range) shown in thin green, and Experiment 3 (button press, narrow ISI range) shown in dashed blue. (c) Regions that responded to target stimuli with a significant decrease in evoked signal intensity in all three tasks. Legend as in (a). (d) Percentage change in signal intensity in response to target stimuli averaged across all voxels that responded to target stimuli with significant signal decrease in all three tasks. (e) Regions with significant negative linear trend response across repetitions of target stimuli for all three experiments.
Within this group of regions that responded to target stimuli across all three experiments, the counting task evoked a larger peak magnitude, delayed peak latency, and longer duration of positive response compared to the two button press tasks (Fig. 2b). No significant difference in response amplitude was observed between the narrow and wide ISI ranges.
A significant main effect of signal decrease was observed in response to target stimuli in all three experiments in the anterior cingulate gyrus (BA 32) (Fig. 2c,d). Adjacent portions of the medial frontal gyrus (BA 11) showed signal reductions in regions that overlapped for the two wide ISI range conditions (Experiments 1 and 2), but not for the narrow ISI range condition (Experiment 3).
A number of regions were also found that showed a significant change in response amplitude with repeated target stimulus presentations (e.g., less positive or more negative with successive stimulus repetitions) across all three experiments. This included the bilateral lateral cerebellar hemispheres, bilateral lingual/fusiform gyri (BA 18, 19), bilateral superior parietal lobe (BA 7), right middle frontal gyrus (BA 6), right inferior parietal lobule (BA 40) and left precentral gyrus (BA 6). (Fig. 2e). In general, these regions of significant reduction in response amplitude with repeated stimulus presentations did not overlap areas with a significant main effect response to target stimuli.
Figure 3.
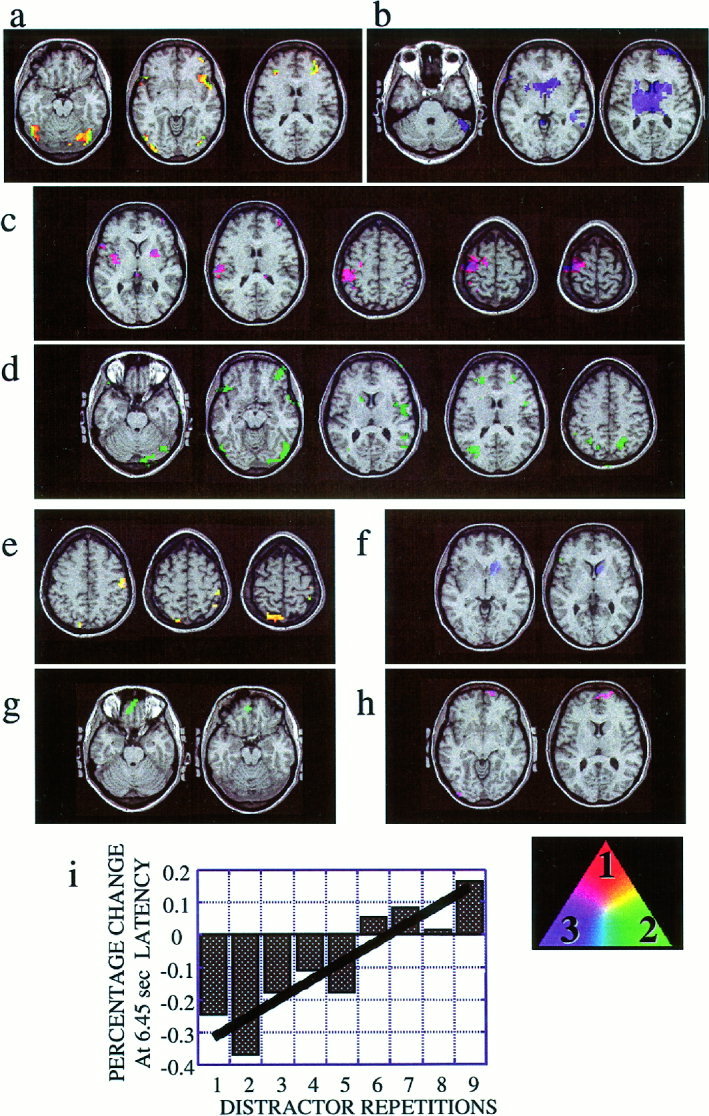
Comparisons among experiments. (a) Regions that responded to target stimuli with a significant main effect in both wide‐ISI experiments (1 and 2) but not in the narrow‐ISI experiment (3). (b) Regions that responded to target stimuli during the narrow‐ISI experiment, but not during the wide‐ISI experiments. (c) Regions that responded during the button press experiments (1 and 3), but not during the counting task experiment (2). The somato‐motor strip was primarily activated. (d) Regions that responded during the counting task, but not during the button press task. (e) Regions that responded to rare distractor stimuli with a significant main effect in both wide‐ISI experiments (1 and 2) but not in the narrow‐ISI Experiment (3). (f) Regions that responded to target stimuli during the narrow‐ISI experiment, but not during the wide‐ISI experiments. (g) Shows regions that responded to the distractor stimuli with a significant linear trend in the counting experiment (2) alone. (h) Regions that responded to the distractor stimuli with a significant linear trend in both button press experiments (1 and 3). (i) Percentage change for each distractor stimulus in sequence at 6.45 sec latency relative to mean of pre‐stimulus baseline for medial prefrontal ROI shown in 3g. Solid line shows best‐fit linear regression of signal amplitude across repetitions.
Comparisons between conditions
Target stimuli
Target stimuli generated increased BOLD signal in both cortical and subcortical regions in all conditions. The two wide‐ISI range experiments (1 and 2) generated a greater volume of significant cortical activity, however, whereas the narrow ISI range condition (Experiment 3) generated a greater volume of significant subcortical activity. Regions that showed significant signal increases in response to target stimuli presented during both experiments using the wide ISI range but not during the single experiment using the narrow ISI range included the bilateral lingual and fusiform gyri, bilateral insulae (larger on the right), bilateral superior frontal gyri (BA 10), bilateral post‐central gyri, bilateral inferior parietal lobules (BA 40), bilateral left middle temporal gyrus (BA 37) and the right lateral cerebellum. In contrast, a number of subcortical regions were found that were only active during the narrow‐ISI range condition (Experiment 3), but not during the two wide ISI experiments. This included a large portion of the bilateral striatum, bilateral thalamus, and also the bilateral middle frontal gyrus (BA 9/10) larger on the right, and the right middle temporal gyrus (BA 22/39). Individual variability was observed between subjects in the magnitude and precise anatomical location of activity across experiments. All subjects, however, showed a smaller volume of cortical activity during the narrow ISI range experiment compared with the wide ISI range experiment.
Analyses were also performed to compare regions that changed their activity depending on the response method used. Regions that responded to target stimuli during both button press experiments but not during the counting task primarily included left somato‐motor regions surrounding the left central sulcus, contralateral to the responding hand. This also included portions of the bilateral anterior insulae (larger on the left), bilateral superior temporal gyri (BA42/22), right fusiform gyrus, right striatum, and right superior frontal gyrus (BA 9). Regions that responded only during the counting experiment but not during either button press experiment included bilateral intraparietal sulci (BA 19), right middle frontal gyrus (BA 10), right middle occipital gyrus (BA19), right posterior insula/transverse gyrus (BA 41/42), and left middle temporal gyrus (BA 19).
Distractor stimuli
Responses to the rare non‐target distractor stimuli were more restricted than to target stimuli, replicating our previous findings using similar tasks with ER‐fMRI [Clark et al., 2000]. No regions were found that responded to distractor stimuli in the same way in all three experiments. Regions showing a significantly increased main effect of BOLD response during the two wide ISI range experiments but not the narrow ISI range experiment included the left superior parietal gyrus and right postcentral gyrus. Regions showing increased signal during the narrow ISI range experiment only included the right caudate and adjacent portions of the striatum. Significant regions of positive linear trend in signal intensity with successive distractor stimulus presentations were found in the two button press conditions only in the left inferior occipital gyrus (BA 19) and right superior/middle frontal gyrus (BA 10), and for the counting task only in the left medial frontal gyrus (BA 11). There was a slightly greater slope of signal change (resulting in a reversal of response polarity after fewer stimuli) in the narrow‐ISI experiment compared with the wide‐ISI experiments. This difference, however, was relatively small and highly variable across subjects and regions. The wide‐ISI button press experiment also generated a larger volume of positive linear trend in signal intensity with successive distractor stimulus presentations in cerebellar and medial temporal regions compared with the narrow‐ISI experiment. This activity was not observed in the wide‐ISI count experiment.
DISCUSSION
Variations in stimulus parameters and response task used in the three‐stimulus oddball task resulted in significant differences in the anatomical location and amplitude of event‐related fMRI BOLD activity. Most strikingly, the use of a narrow range of trial‐to‐trial inter‐stimulus intervals (800–1,200 msec) resulted in an enlarged volume of subcortical activity and a reduced volume of cortical activity relative to a wide ISI range (550–2,050 msec). This difference in response topography occurred despite the fact that all experiments used the identical experimental subjects and block letter stimuli, and a similar mean ISI and stimulus frequency across conditions, leaving only the width of ISI range used to account for these results.
Many previous ERP studies have shown that a larger P3 ERP component was evoked when target stimulus presentations were less predictable [Donchin, 1981]. This could have occurred in the present study when a more variable and less predictable trial to trail ISI range was used in the wide ISI range conditions. Increased P3 responses associated with using a more variable ISI have also been ascribed to differences in habituation over repeated target presentations [reviewed in Loveless, 1983]. It has been hypothesized that more target repetitions are required to produce the same degree of habituation when stimulus presentations were less predictable. The present results suggest that effects of habituation and stimulus predictability, if present, may vary substantially across brain regions, and may even show the opposite effect between cortical and subcortical regions. The reduced surface‐recorded ERP amplitude with a restricted ISI range is consistent with a smaller volume of cortical activity, as superficial cortical activity is emphasized in the scalp‐recorded ERP more than deep sub‐cortical activity due to the proximity of dorsal cortical regions to the recording electrodes. Indeed, modeling the P3b component generators as two dipole sources placed bilaterally in symmetrical regions of the supramarginal gyrus was found to be sufficient to explain most of the P3 component topography in the combined ERP/fMRI study of Menon et al., [1997]. In the present fMRI study, the amplitude of activity evoked by target stimuli in the supramarginal gyri and adjacent regions was found to be relatively unaffected by ISI range (see Fig. 2). Instead, increased ISI range resulted in a larger volume of cortical brain activity outside of the supramarginal gyrus region, suggesting that it is the increased volume of activity outside of the supramarginal gyrus area that may be responsible for the larger scalp‐recorded ERP, and not a greater magnitude of evoked activity within the supramarginal gyrus. The increased subcortical responses found in the narrow ISI condition suggests that these brain regions respond more strongly when target stimuli are more temporally predictable, with the opposite pattern of change than that found in cortex. This effect did not depend on response type, so must involve more than planning or executing motor responses to stimuli.
There was only a limited main effect of distractor presentation. Instead, the analysis of trend effects revealed an effect of stimulus repetition on response amplitude and polarity for distractor stimuli in ventral‐medial prefrontal cortex. This activity began with a negative signal change to the first stimuli presented, which reversed to a positive going signal change after a small number of repetitions (averaging 5 repetitions). This replicated our previous findings using the same task and analysis techniques [Clark et al., 2000]. The anatomical location of this response is in agreement with previous depth recording studies of distractor evoked activity using similar tasks [Baudena et al., 1995]. The width of ISI range and response task produced some variation in the anatomical location and slope of this trend response. In addition to the trend response, a main effect of distractor presentation was observed in the parietal lobe in the present study during the wide‐ISI conditions. This is in contrast to the results of our previous studies, and may have resulted here from the use of spatial smoothing, which reduced noise and increased signal detectability.
Comparison of button press vs. counting behavioral response tasks revealed that the button press task generated a significant response along the central sulcus and adjacent regions that were contralateral to the responding hand. Activity was not observed in these regions during performance of the counting task, suggesting that this activity results from the execution of a motor response to the presentation of target stimuli. Activity was found in somato‐motor regions well outside of the relatively discrete area thought to be involved in the somatic perception and motor control of the right thumb [Lotze et al., 2000; Maldjian et al., 1999; Yue et al., 2000]. This broad swath of activity included cortex involved with a large portion of the right side of the body. Such a large spread of activity cannot be accounted for by spatial smoothing, nor by inter‐individual variability, as it stretched for several cm. One possible explanation for this is that subjects were asked to remain as still as possible while responding, and might have tensed muscles in their arm and torso in response to this instruction, thus generating a pattern of activity beyond the representation of the right thumb.
The counting task also resulted in a larger peak magnitude, delayed peak latency, and longer duration of positive response within regions that responded during all three experiments. This agrees with the findings of Polich [1987], who compared counting and button press response in the oddball task using ERPs. The longer delay of peak activity in the counting task found in the present study (1 TR or 2.15 sec) was much greater than that found using ERPs. This increased delay may have resulted from the greater cognitive demands of the counting task relative to the button press task, resulting in a heightened state of alertness and attention to the stimuli. Although similar topographic differences in the BOLD response evoked by target stimuli in counting and button‐press oddball tasks have been previously reported [Kirino et al., 2000; Linden et al., 1999], this difference in BOLD response amplitude and duration has not.
The later and more dispersed response evoked in the temporal‐parietal junction area by target stimuli during the counting task relative to the button press task suggests that the cognitive basis of the response in this region involves more than the perceptual recognition of target stimuli. Activity in this region may also involve some aspect of the response made to target stimuli. This is inferred from the assumption that the temporal constraints on the speeded button press task force subjects to initiate the manual response immediately upon target recognition, while no such temporal demands are present for the counting task, where the actual overt response phase of the counting task does not occur until the end of the run. As the counting task presents no specific temporal constraints on the response to individual targets, it may lend itself to greater variability in the timing of the neural response involved in the updating of target numbers to be reported at the end of each run. Given that the perception/recognition stage of stimulus processing is most likely completed before the presentation of subsequent stimuli, the speed of information processing itself would not be expected to vary greatly across the counting and button press response tasks. Thus, the present result suggests that temporal‐parietal activation is influenced by the response task used, and by inference may be involved in some aspect of response selection and execution. This result is in agreement with previous ERP studies using similar tasks, which have found that inter‐trail variation in P3b latency covaries with inter‐trail variation in response latency [Ritter et al., 1972]. Although the temporal precision of ER‐fMRI as used here is not adequate to perform a similar analysis, it is reasonable to hypothesize that related neural and cognitive activity may underlie both previous ERP and current ER‐fMRI findings.
A variety of previously published studies have used ER‐fMRI to record responses to target stimuli presented in the oddball task [Downar et al., 2000; Kiehl et al., 2001; Kirino et al., 2000; Krystal et al., 1998; Linden et al., 1999; McCarthy et al., 1997; Menon et al., 1997; Opitz et al., 1999; Yoshiura et al., 1999]. These studies all agree that increased fMRI signal is evoked in response to target stimuli in the temporal‐parietal junction area. Previous ER‐fMRI studies that have examined responses to rare novelty‐distractor stimuli (that generate the P3a component) have met with more limited success [Kirino et al., 2000; Knight and Nakada, 1998]. A few, very small regions of activity have been found, in contrast to depth recorded ERP studies which have found many areas that respond to similar stimuli [Baudena et al., 1995; Halgren et al., 1995a,b]. These ER‐fMRI studies have used single trial stimuli with slow, fixed stimulus presentation rates to reduce the overlap of the hemodynamic response evoked by consecutive trials [Bandettini and Cox, 2000]. These rates (8 sec or longer between successive target stimuli) are slower than that used in typical ERP experiments. This slower rate of presentation might have led to differences in the cognitive response to the stimuli and the attention and arousal state of the subjects. This makes the direct comparison of results between these ER‐fMRI studies and event‐related ERP studies problematic.
The present study, as well as our previous study [Clark et al., 2000], used rapid rates of stimulus presentation which more closely replicate previous ERP studies using similar stimuli. The use of a shorter ISI led to overlap of BOLD ER‐FMRI activity to successive stimuli. Using multiple regression, this overlapping activity evoked by different stimulus types was separated. One potential criticism of multiple regression used in this manner is based on its assumption that BOLD responses to temporally adjacent stimuli add in a linear manner, when there is evidence of deviation from additive linearity in overlapping BOLD responses to successive stimuli [Boynton et al., 1996; Dale and Buckner, 1997; Pollman et al., 2000]. Such deviations from linearity were found to be small in these previous studies, however, thus supporting the assumption that the BOLD response to visual stimuli adds in an approximately linear fashion, which further validates the use of rapid ER‐fMRI techniques. In addition, the reductions in BOLD response amplitude that have been observed for rapidly presented stimuli are offset by gains derived from signal averaging a larger number of samples obtained in the same period of time [Dale, 1999]. Thus, statistical power is enhanced by the use of multiple regression analysis of rapidly presented stimulus sequences, even in the presence of non‐linearities in the amplitude of temporally overlapping BOLD responses. A further finding illustrating the advantages of event‐related paradigm designs is that the BOLD response to individually presented stimuli is greater than predicted from blocked experimental designs, which is perhaps related to the increased neural response generated by discrete stimuli as compared with blocked stimulus trains [Bandettini, 2000]. Another potential criticism of multiple regression as applied here stems from the use of a single hemodynamic response function across regions. Comparisons among different brain regions within subjects and mean differences across subjects have revealed slightly different delay and dispersion values during ER‐fMRI as applied here [Clark et al., 1998, 2000], which could reduce the power of the analysis. The current study, however, showed that even when the experimentally obtained hemodynamic response differs substantially from the assumed response (as was shown by the longer and later target evoked response during the counting task when compared with the response evoked during the button press task), this method was able to detect the response with adequate power. Thus, there are many advantages to the application of fast event‐related designs over slower presentation rates, and in the use of multiple regression for deconvolution and statistical analysis.
CONCLUSIONS
The results of the present study demonstrate that large differences in the response to stimuli presented in the three‐stimulus oddball task may occur by varying the range of variability in trial to trial inter‐stimulus interval, and by varying the response task used. This illustrates the exquisite sensitivity of BOLD fMRI to subtle variations in task design. There are two important consequences of these findings. First, differences between studies could result from relatively small differences in the stimulus sequences and behavioral response task used. As illustrated here, even experiments using the identical subjects, visual stimuli and behavioral response, and similar mean ISI, but with large variations in ISI range can generate very different anatomical patterns of neural response. This also illustrates that fMRI, although relatively insensitive to small variations in the timing of stimulus‐evoked BOLD responses, may still be sensitive to the consequences of changes in stimulus timing through differences in the topographic locations of activity. When different populations or data from different imaging modalities are to be compared, it is essential that the identical experimental paradigms be used for each.
Second, the exact version of the paradigm to be used must be considered when specific brain regions are to be investigated. The results of the present study suggest that for the three stimulus oddball task used here, a wide ISI range may be optimal for the examination of cortical brain regions, whereas a more restricted ISI range may provide a better sampling of subcortical activity. In addition, a more robust response may be elicited using a covert counting task, which could aid in increasing the detectability of the target‐evoked response. Other modifications may serve to further optimize this task for the study of specific elements of cognitive processing, such as object perception, working memory and response inhibition.
Acknowledgements
This paper is dedicated to the memory of Dr. Gale Ramsby. We would like to thank T. Wojtusik for help in editing this manuscript, Drs. Jose Maisog and James Haxby for the use of the FIDAP analysis package, the staff of the UCHC Department of Diagnostic Imaging and Therapeutics, and our patient subjects.
REFERENCES
- Bandettini PA, Cox RW (2000): Event‐related fMRI contrast when using constant inter‐stimulus interval: theory and experiment. Magn Reson Med 43: 540–548. [DOI] [PubMed] [Google Scholar]
- Baudena P, Halgren E, Heit G, Clarke JM (1995): Intracerebral potentials to rare target and distractor auditory and visual stimuli. III. Frontal cortex. Electroencephalogr Clin Neurophysiol 94: 251–264. [DOI] [PubMed] [Google Scholar]
- Boynton GM, Engel SA, Glover GH, Heeger DJ (1996): Linear systems analysis of functional magnetic resonance imaging in human V1. J Neurosci 16: 4207–4221. [DOI] [PMC free article] [PubMed] [Google Scholar]
- Burock MA, Buckner RL, Woldorff MG, Rosen BR, Dale AM (1998): Randomized event‐related experimental designs allow for extremely rapid presentation rates using functional MRI. Neuroreport 9: 3735–3739. [DOI] [PubMed] [Google Scholar]
- Clark VP, Fannon S, Lai S, Benson R, Bauer L (2000): Responses to rare visual target and distractor stimuli using event‐related fMRI. J Neurophysiol 83: 3133–3139. [DOI] [PubMed] [Google Scholar]
- Clark VP, Maisog JMa, Haxby JV (1998): An fMRI study of face perception and memory using random stimulus sequences. J Neurophysiol 79: 3257–3265. [DOI] [PubMed] [Google Scholar]
- Dale A, Buckner R (1997): Selective averaging of rapidly presented individual trials using fMRI. Hum Brain Mapp 5: 329. [DOI] [PubMed] [Google Scholar]
- Dale AM (1999): Optimal experimental design for event‐related fMRI. Hum Brain Mapp 8: 109–114. [DOI] [PMC free article] [PubMed] [Google Scholar]
- Donchin E (1981): Surprise!…Surprise? Psychophysiology 18: 493–513. [DOI] [PubMed] [Google Scholar]
- Downar J, Crawley AP, Mikulis DJ, Davis KD (2000): A multimodal cortical network for the detection of changes in the sensory environment. Nat Neurosci 3: 277–283. [DOI] [PubMed] [Google Scholar]
- Friston KJ, Holmes AP, Poline JB, Grasby PJ, Williams CR, Frackowiak RSJ (1995): Analysis of fMRI time‐series revisited. Neuroimage 2: 45–53. [DOI] [PubMed] [Google Scholar]
- Friston KJ, Worsley K, Frackowiak RSJ, Mazziotta JC, Evans AC (1994): Assessing the significance of focal activations using their spatial extent. Hum Brain Mapp 1: 210–220. [DOI] [PubMed] [Google Scholar]
- Halgren E, Baudena P, Clarke JM, Heit G, Marinkovic K, Devaux B, Vignal JP, Biraben A (1995a): Intracerebral potentials to rare target and distractor auditory and visual stimuli. II. Medial, lateral and posterior temporal lobe. Electroencephalogr Clin Neurophysiol 94: 229–250. [DOI] [PubMed] [Google Scholar]
- Halgren E, Baudena P, Clarke JM, Heit G, Liegeois C, Chauvel P, Musolino A (1995b): Intracerebral potentials to rare target and distractor auditory and visual stimuli. I. Superior temporal plane and parietal lobe. Electroencephalogr Clin Neurophysiol 94: 191–220. [DOI] [PubMed] [Google Scholar]
- Helmholtz H von (1853): Uber einige Gesetze der Vertheilung electrischer Stome in korperlochen Leitern, mit Anwedung auf die thierisch‐elektrischen Versuche. Annalen der Physik und Chemie 7: 211–233, 353–377. [Google Scholar]
- Kiehl KA, Laurens KR, Duty TL, Forster BB, Liddle PF (2001): Neural sources involved in auditory target detection and novelty processing: an event‐related fMRI study. Psychophysiology 38: 133–142. [PubMed] [Google Scholar]
- Kiehl KA, Liddle PF, Hopfinger JB (2000b): Error processing and the rostral anterior cingulate: an event‐related fMRI study. Psychophysiology (in press). [PubMed] [Google Scholar]
- Kirino E, Belger A, Gore JC, Goldman‐Rakic PS, McCarthy G (2000): A comparison of prefrontal activation to infrequent visual targets and non‐target novel stimuli: a functional MRI study. Soc Neurosci Abstr 23: 493. [DOI] [PMC free article] [PubMed] [Google Scholar]
- Knight RT (1984): Decreased response to novel stimuli after prefrontal lesions in man. Electroencephalogr Clin Neurophysiol 59: 9–20. [DOI] [PubMed] [Google Scholar]
- Knight RT, Nakada T (1998): Cortico‐limbic circuits and novelty: a review of EEG and blood flow data. Rev Neurosci 9: 57–70. [DOI] [PubMed] [Google Scholar]
- Krystal JH, Belger A, Kirino E, Madonick S, Gatenby CJ, Gore JC, McCarthy G (1998): Modulation of cingulate activation to infrequent visual targets by ketamine: a functional MRI study. Soc Neurosci Abstr 24: 259. [Google Scholar]
- Linden DEJ, Prvulovic D, Formisano E, Vollinger M, Zanella FE, Goebel R, Dierks T (1999): The functional neuroanatomy of target detection: an fMRI study of visual and auditory oddball tasks. Cereb Cortex 9: 815–824. [DOI] [PubMed] [Google Scholar]
- Lotze M, Erb M, Flor H, Huelsmann E, Godde B, Grodd W (2000): fMRI evaluation of somatotopic representation in human primary motor cortex. Neuroimage 11: 473–481. [DOI] [PubMed] [Google Scholar]
- Loveless N. (1983): The orienting response and evoked potentials in man In: Siddle D, editor. Orienting and habituation: perspectives in human research. New York: Wiley. [Google Scholar]
- Maisog JMa, Clark VP, Courtney S, Haxby JV (1995): Estimating the hemodynamic response and effective degrees of freedom in functional MRI time series. Hum Brain Mapp S1: 147. [Google Scholar]
- Maldjian JA, Gottschalk A, Patel RS, Detre JA, Alsop DC (1999): The sensory somatotopic map of the human hand demonstrated at 4 Tesla. Neuroimage 10: 55–62. [DOI] [PubMed] [Google Scholar]
- McCarthy G, Luby M, Gore J, Goldman‐Rakic P (1997): Infrequent events transiently activate human prefrontal and parietal cortex as measured by functional MRI. J Neurophysiol 77: 1630–1634. [DOI] [PubMed] [Google Scholar]
- Menon V, Ford JM, Lim KO, Glover GH, Pfefferbaum A (1997): Combined event‐related fMRI and EEG evidence for temporal‐parietal cortex activation during target detection. Neuroreport 8: 3029–3037. [DOI] [PubMed] [Google Scholar]
- Opitz B, Mecklinger A, Von Cramon DY, Kruggel F (1999): Combining electrophysiological and hemodynamic measures of the auditory oddball. Psychophysiology 36: 142–147. [DOI] [PubMed] [Google Scholar]
- Polich J (1998): P300 clinical utility and control of variability. J Clin Neurophysiol 15: 14–33. [DOI] [PubMed] [Google Scholar]
- Polich J (1987): Response mode and P300 from auditory stimuli. Biol Psychol 25: 61–71. [DOI] [PubMed] [Google Scholar]
- Polich J (1992): On the clinical application of P300. Biol Psychol 31: 647–649. [DOI] [PubMed] [Google Scholar]
- Polich J, Kok A (1995): Cognitive and biological determinants of P300. Biol Psychol 41: 103–146. [DOI] [PubMed] [Google Scholar]
- Pollmann S, Dove A, Yves von Cramon D, Wiggins CJ (2000): Event‐related fMRI: comparison of conditions with varying BOLD overlap. Hum Brain Mapp 9: 26–37. [DOI] [PMC free article] [PubMed] [Google Scholar]
- Ritter W, Simson R, Vaughan HG Jr (1972): Association cortex potentials and reaction time in auditory discrimination. Electroencephalogr Clin Neurophysiol 33: 547–555. [DOI] [PubMed] [Google Scholar]
- Swick D, Knight R (1998): Cortical lesions and attention In: Parasuraman R, editor. The attentive brain. Cambridge: MIT Press; p 143–162. [Google Scholar]
- Turetsky BI, Raz J, Alsop D (1999): Functional magnetic resonance imaging of the sources of the auditory P300. Int J Psychophysiol 33: 40. [Google Scholar]
- Yoshiura T, Zhong J, Shibata DK, Kwok WE, Shrier DA, Numaguchi Y (1999): Functional MRI study of auditory and visual oddball tasks. Neuroreport 10: 1683–1688. [DOI] [PubMed] [Google Scholar]
- Yue GH, Liu JZ, Siemionow V, Ranganathan VK, Ng TC, Sahgal V (2000): Brain activation during human finger extension and flexion movements. Brain Res 856: 291–300. [DOI] [PubMed] [Google Scholar]