

Abstract
It is assumed widely that the clinical expression of Parkinson's Disease (PD), both motor and cognitive, is subtended by topographically distributed brain networks. However, little is known about the functional neuroanatomy of executive dysfunction in PD. Our objective was to validate further in a PD group the use of network analysis to assess the relationship between executive processes and pathological disorganization of frontostriatal networks. We studied 15 patients with idiopathic PD, and 7 age‐matched normal controls, using resting [18F]fluorodeoxyglucose (FDG) and high‐resolution positron emission tomography (PET). We carried out network analysis on regional metabolic data to identify specific covariation patterns associated with motor and executive dysfunction. We detected two independent patterns relating respectively to the two clinical abnormalities. The first pattern (principal component 1) was topographically similar to that described previously in other PD populations. Subject scores for this pattern discriminated patients from controls and correlated significantly with bradykinesia ratings (P = 0.013, r = 0.655) in PD patients. The second pattern (principal component 2) was characterized by relative ventromedial frontal, hippocampal, and striatal hypometabolism, associated with mediodorsal thalamic hypermetabolism. In the PD group, scores from this pattern correlated with scores on the conditional associative learning (CAL; P = 0.01, r = 0.690) and the Brown Peterson paradigm (BPP; P = 0.017, r = −0.651) tests, respectively assessing strategy and planning, and working memory. According to these findings, the networks subserving bradykinesia and executive dysfunction in PD seems to be topographically distinct and to involve different aspects of subcortico‐cortical processing. Hum. Brain Mapping 22:236–245, 2004. © 2004 Wiley‐Liss, Inc.
Keywords: executive functions, Parkinson's disease, FDG‐PET, network analysis, working memory
INTRODUCTION
The hallmark of Parkinson's disease (PD) is a loss of dopaminergic neuron cell bodies in the zona compacta of the substantia nigra (SN), which leads to striatal dopamine (DA) deafferentation and causes the classic extrapyramidal impairment [Bernheimer et al., 1973]. PD patients, however, frequently develop cognitive dysfunction [Dubois et al., 1991] even at early stages of PD [Lees and Smith, 1983]. This impairment involves predominantly the executive functions, largely sustained by prefrontal cortex. This executive impairment is related to deficits in control of attention, planning, capacity to elaborate a strategy, set shifting, temporal ordering, and working memory (WM) [for reviews see Owen and Doyon, 1999; Taylor and Saint‐Cyr, 1995].
Planning [Shallice, 1988] and WM are crucial and interdependent executive functions. WM refers to a brain system that provides temporary storage and manipulation of information necessary to carry out complex tasks. Baddeley [2000] suggested that storage of information is of limited capacity but can be done from different registers and that it is monitored closely by an attentional controlling system that manipulates information during various cognitive activities, especially reasoning. Executive control seems to be a functional entity common to WM and planning, especially in charge of executive control.
To assess executive control in our PD patients, we used two tasks: conditional associative learning (CAL), thought to reflect mainly planning [Gotham et al., 1988; Marié et al., 1999]; and the Brown Peterson paradigm (BPP), widely used to assess attentional controlling system of WM [Marié et al., 1995; Morris, 1986].
Based on studies in both monkeys and man, these tasks are known to reflect functioning of prefrontal areas [Lezak, 1983; Marié et al., 1995; Petrides, 1985]. Positron emission tomography (PET) makes it possible to study brain function in vivo [Collette et al., 1999] and especially the relationships between the striatofrontal disturbance and the cognitive performance in PD. In an activation PET study, Owen and coworkers [1998] underlined the role of basal ganglia in PD carrying out WM tasks. Apart from the activation paradigm, which assesses the response of the system during the actual performance of a task, resting‐state studies of the metabolic rate of glucose (CMRglc) with (18F)fluoro‐2‐deoxy‐d‐glucose and PET (FDG‐PET) are of considerable interest because CMRglc is a marker of integrated local synaptic activity and is sensitive to both direct neuronal/synaptic damage and secondary functional disruption at synapses distant from the primary site of pathology [Magistretti et al., 1999].
In a previous work, using FDG‐PET in PD, we reported significant positive correlations between frontal CMRglc and WM task scores, and negative correlations between these scores and mediodorsal thalamic nucleus metabolism [Marié et al., 1995]. The data, however, were correlated region by region independently from each other.
This body of results led us to test, using quantitative FDG/PET data and a network modeling approach, whether executive control disturbances in PD were subtended by functional impairments of a frontosubcortical circuit due to pathophysiology. This technique has been applied extensively to identify metabolic circuits associated with the motor manifestations of PD and other movement disorders [Eidelberg et al., 2000]. We first validated this approach with respect to motor disability in our cohort. We then explored the relationship between regional metabolism and executive dysfunction in the PD patient group.
SUBJECTS AND METHODS
Subjects
PD patients
We studied 15 probable PD patients (12 men and 3 women; mean age ± SD, 58.6 ± 9 years) according to the criteria of Gelb and colleagues [1999]. They reached the following criteria: age ≤70 years; ability to read and write French with >5 years of education; only levodopa (l‐dopa) and dopamine (DA) agonists allowed (none of our patients was taking anticholinergic drugs or selegiline); the medication regimen (l‐dopa and DA agonists) had to be stable for at least 1 month before the PET study (for which it was not interrupted), and had to have optimal clinical benefit; stage I–II of Hoehn and Yahr rated in the on state; lack of depression as shown by a score below six on the Montgomery and Asberg Dementia Rating Scale [MADRS; Montgomery and Asberg, 1979]; lack of dementia evaluated by the Diagnostic and Statistical Manual of Mental Disorders (DSM‐III‐R) (including a Mini‐Mental State above 27); Hachinski modified score ≤2; no known history of brain disease, thyroid gland disease, alcoholism, or use of psychotropic agents; and lack of significant magnetic resonance imaging (MRI) abnormalities (using a 3‐D MRI volume data set (T1‐weighted TE = 9 msec, TR = 24 msec, flip angle = 35 degrees). Patients with moderate or severe dyskinesias, dystonias, or on–off phenomena were excluded from this investigation. Quantitative clinical variables were recorded in Table I.
Table I.
Clinical data
| Patient no/gender/age (yr) | Disease duration (yr) | H & Y Stage | Treatment (mg/day) | Tremor* | Bradykinesia* | Rigidity* | Axial signs* | Global scores* | |
|---|---|---|---|---|---|---|---|---|---|
| l‐Dopa | AG | ||||||||
| 1/M/70 | 1 | 1 | 375 | − | 6 | 6 | 4 | 3 | 19 |
| 2/M/59 | 14 | 2 | 550 | + | 3 | 16 | 9 | 9 | 37 |
| 3/M/59 | 6 | 2 | 450 | + | 0 | 11 | 0 | 9 | 20 |
| 4/M/58 | 1,5 | 2 | 150 | − | 2 | 8 | 3 | 4 | 17 |
| 5/M/46 | 9 | 2 | 750 | + | 0 | 8 | 4 | 4 | 16 |
| 6/F/65 | 3 | 2 | 400 | − | 2 | 12 | 8 | 2 | 24 |
| 7/M/47 | 4 | 2 | 300 | + | 3 | 7 | 4 | 1 | 15 |
| 8/M/64 | 14 | 2 | 700 | − | 5 | 14 | 8 | 3 | 30 |
| 9/F/40 | 14 | 2 | 300 | + | 8 | 10 | 6 | 4 | 28 |
| 10/M/67 | 7 | 1 | 400 | − | 0 | 7 | 0 | 3 | 10 |
| 11/M/65 | 6 | 2 | 550 | − | 7 | 13 | 4 | 7 | 31 |
| 12/F/51 | 6 | 1 | 800 | − | 0 | 5 | 2 | 1 | 8 |
| 13/M/68 | 8 | 2 | 550 | − | 6 | 9 | 5 | 3 | 23 |
| 14/M/65 | 12 | 2 | 550 | + | 0 | 16 | 8 | 10 | 34 |
| 15/M/55 | 6 | 2 | 600 | + | 5 | 8 | 6 | 4 | 23 |
Total n = 15.
From the Colombia modified scale, measured while in the on state.
M, male; F, female; H & Y Stage, Hoehn and Yahr Stage; l‐dopa, levodopa; AG, Dopamine agonist.
Normal subjects
We studied 7 normal volunteers subjects (4 men and 3 women; mean age ± SD, 57.1 ± 6 years). They were selected on the basis of following criteria: age ≤70 years; ability to read and write French with >5 years of education; lack of depression and dementia as evaluated by the DSM‐III‐R and a general neuropsychological battery (including a Mini‐Mental State above 27); Hachinski modified score ≤2; no known history of brain disease, thyroid gland disease, alcoholism, or use of psychotropic agents; and lack of significant MRI abnormalities.
Motor and Neuropsychologic Quantitative Assessment
Motor and neuropsychologic assessments in patients were made while taking optimal doses of antiparkinsonian medications and within 15 days of the PET study. Motor impairment was assessed in the entire group of PD patients using the Columbia modified scale [Duvoisin, 1970] (Table I).
The patients and the control subjects carried out the BPP (Table II), used to evaluate WM in its verbal component; it consisted in recalling three words after various delays (3, 6, 9, and 18 sec) occupied by backwards counting in ones to prevent rehearsal [Marié et al., 1995]. The patients also carried out the CAL task (Table II), developed by Petrides [1990], and related to planning and strategy. The subjects had to learn arbitrary associations between 6 nonfigurative drawings and 6 colors. The task goes on until the learning criterion (i.e., three consecutive sessions of each six correct trials) is reached. The total number of errors (named CALe), total number of trials (CALsc, that is the number of trials necessary to reach the learning criterion), and percentage of errors (CALeprc) were rated [Petrides, 1985, 1990].
Table II.
Patient's performance for the Brown Peterson Paradigm and the Conditional Associative Learning
| Patient no./gender/age (yr) | BPPt | BPP3 | BPP6 | BPP9 | BPP18 | CALsc/180 | CALe | CALeprc/100 |
|---|---|---|---|---|---|---|---|---|
| 1/M/70 | 4 | 3 | 0 | 0 | 4 | 180 | 148 | 82 |
| 2/M/59 | 32 | 5 | 9 | 5 | 1 | 180 | 104 | 58 |
| 3/M/59 | 41 | 8 | 7 | 7 | 7 | 90 | 25 | 27 |
| 4/M/58 | 33 | 8 | 4 | 8 | 5 | 54 | 13 | 24 |
| 5/M/46 | 32 | 12 | 4 | 3 | 3 | 180 | 70 | 38 |
| 6/F/65 | 38 | 8 | 9 | 7 | 5 | 168 | 69 | 41 |
| 7/M/47 | 58 | 10 | 14 | 11 | 9 | 180 | 117 | 65 |
| 8/M/64 | 18 | 6 | 0 | 3 | 5 | 180 | 104 | 58 |
| 9/F/40 | 68 | 15 | 11 | 15 | 12 | 72 | 17 | 23 |
| 10/M/67 | 64 | 15 | 11 | 13 | 12 | 102 | 28 | 27 |
| 11/M/65 | 52 | 14 | 11 | 9 | 6 | 30 | 3 | 10 |
| 12/F/51 | 21 | 5 | 0 | 4 | 4 | 102 | 36 | 35 |
| 13/M/68 | 55 | 12 | 11 | 8 | 9 | 144 | 48 | 33 |
| 14/M/65 | 25 | 3 | 8 | 4 | 5 | 132 | 68 | 51 |
| 15/M/55 | 67 | 13 | 14 | 15 | 10 | 144 | 29 | 20 |
| Mean | 40.5 | 9.1 | 7.5 | 7.5 | 6.5 | 129.2 | 58.6 | 39.5 |
| SD | 19.2 | 4.2 | 4.9 | 4.5 | 3.2 | 51.2 | 43.4 | 19.7 |
Total n = 15.
BPP, Brown Peterson Paradigm; BPPt, BPP total score; BPP3, 6, 9, 18, performances after 3‐, 6‐, 9‐, or 18‐sec delay; CAL, conditional associative learning; CALsc, CAL global score (i.e., sum of trials); CALe, CAL error scores; CALeprc, CAL errors in term of percentage; SD, standard deviation.
PET Methodology
The CMRglc was measured in the resting state (eyes closed and in a dimmed light with reduced ambient noise) using FDG. The PET study was done during on state and acquisition was started only after the patient had relaxed. Behavior was observed qualitatively at intervals by a neurologist (R.M.M.). No significant abnormal movements were noted. We used a seven‐plane PET device (intrinsic resolution for 18F: 5.5 × 5.5 × 9 mm, x y z, with a field of view of 81 mm; model TTV 03 LETI) [Mazoyer et al., 1990]. Attenuation correction was carried out by means of a 68Ga‐68Ge transmission scan. Positioning procedure was carried out with a skull X‐ray to determine the glabella‐inion line and X‐ray opaque Laitinien frame, to obtain cuts essentially parallel to the bicommissural line (from −4 mm to 68 mm relative to this line). Any head displacement was monitored and controlled for during PET data acquisition thanks to fixed‐light beams projected onto ink marks drawn on the subject's forehead.
After transmission scans, 3–6 mCi of FDG were injected as a bolus and 20 arterial blood samples were withdrawn to measure 18F plasma concentrations and the average plasma glucose content. From 50–60 min after injection, we obtained 7 planes, which were transformed pixel by pixel into parametric maps of CMRglc, according to the model of Phelps and coworkers [1979].
The skull X‐ray was used to determine the glabella‐inion line, allowing to obtain cuts parallel to the bicommissural line. A 3‐D MRI volume data set was acquired. Regions of interest (ROIs) were defined directly on MRI T1‐weighted planes resliced from the 3‐D set to match PET planes without knowledge of the PET images. The localization of our ROIs was specified carefully on a Pixar workstation by automatic identification of the anterior commisure (AC) and posterior commisure (PC) landmarks on the midsagittal MRI plane, and by calculation of their coordinates relative to the glabella and inion landmarks visible on reverse‐contrast MRI. Realignment with respect to the skull X‐ray that served as reference for PET planes allowed optimal reslicing of the MRI set. One hundred and nineteen circular ROIs were placed over the neocortex and the cerebellum (radius = 7 mm), as well as basal ganglia and thalamic nucleus (radius = 4 mm), based on an automatic finding procedure according to Talairach's proportional system [Talairach et al., 1957; Talairach and Tournoux, 1988] and developed in our laboratory [Allain et al., 1992]. Concerning basal ganglia and thalamus nuclei, a specific registration was made in sagittal, axial, and coronal planes [Allain et al., 1992]. Once placed on MRI planes, ROIs were then transferred onto corresponding PET planes. We defined 32 anatomic‐functional brain regions (i.e., 14 on each side plus 4 medial). CMRglc was obtained by averaging across all pixels included in the ROIs sampling that region. Different frontal subregions were defined according to the model of Alexander and associates [1990]: dorsolateral frontal (10 ROIs/hemisphere including the top part of Brodmann's area [BA]10, BA9, BA45, BA46, and BA8); orbitofrontal (6 ROIs/side, lower part of BA10, BA11, and lateral part of BA47); ventromedial frontal (1 ROI/hemisphere, the internal part of BA11). We also obtained regional CMRglc values for precentral and postcentral gyri (4 and 2 ROIs/side, respectively), temporal, parietal, and occipital areas (11, 4, and 6 ROIs/side, respectively), parahippocampal regions, cerebellum, caudate nucleus, putamen, and thalamus (2 ROIs/hemisphere for these 5 regions), and pallidum (1 ROI on each side). The 4 medial regions were anterior and posterior cingulate (3 and 2 ROIs/side, respectively), pons (2 ROIs), and cerebellar vermis (2 ROIs). The CMRglc values are shown in Table III.
Table III.
Resting metabolic rate of glucose
| Functional regions | Mean PD patients rCMRglc (± SD) | Mean controls rCMRglc (± SD) |
|---|---|---|
| DorsolatF_L | 7.72 (1.77) | 7.74 (1.2) |
| DorsolatF_R | 7.4 (1.61) | 7.8 (1.07) |
| OrbitolatF_L | 7.21 (1.49) | 7.6 (1.22) |
| OrbitolatF_R | 7.01 (1.47) | 7.4 (1.08) |
| VtrMF_L | 7.49 (2.22) | 6.95 (1.89) |
| VtrMF_R | 7.04 (1.48) | 6.08 (2.22) |
| Precent_L | 7.77 (1.56) | 7.56 (1.2) |
| Precent_R | 7.2 (1.36) | 7.21 (1.13) |
| Postcent_L | 7.09 (1.68) | 7.05 (1.15) |
| Postcent_R | 6.93 (1.67) | 6.95 (1.11) |
| Temporal_L | 6.57 (1.48) | 7.04 (1.32) |
| Temporal_R | 6.83 (1.49) | 7.1 (1.21) |
| HippocG_L | 5.26 (1.24) | 4.52 (0.83) |
| HippocG_R | 5.47 (1.24) | 5.01 (1.25) |
| Parietal_L | 6.89 (1.73) | 7.21 (1.13) |
| Parietal_R | 7.12 (1.7) | 7.14 (1.08) |
| Occipital_L | 6.86 (1.39) | 7 (2.64) |
| Occipital_R | 6.67 (1.45) | 7.1 (1.17) |
| Caudate_L | 7.69 (1.92) | 7.3 (1.86) |
| Caudate_R | 7.85 (1.77) | 6.81 (1.58) |
| Putamen_L | 9.4 (2) | 8.05 (1.23) |
| Putamen_R | 9.01 (1.64) | 7.95 (1.63) |
| Pallidum_L | 7.42 (1.67) | 7.4 (1.92) |
| Pallidum_R | 7.66 (2.38) | 7.02 (1.28) |
| MD_L | 8.62 (2.02) | 8.35 (1.87) |
| MD_R | 8.94 (1.4) | 8.06 (1.67) |
| CerLob_L | 6.75 (1.49) | 6.85 (1.28) |
| CerLob_R | 6.73 (1.66) | 6.92 (1.02) |
| AntCingG | 7.42 (1.63) | 7.52 (1.22) |
| PostCingG | 8.17 (2.62) | 10 (1.46) |
| Pons | 5.38 (1.5) | 5.33 (1.22) |
| Vermis | 6.98 (1.4) | 6.86 (1.51) |
Resting metabolic rate of glucose, rCMRglc (mg/min/100g); PD, Parkinson's disease; SD, standard deviation; DorsolatF_dorsolateral prefrontal cortex; L, left; R, right; OrbitolatF_, orbitofrontal cortex; VtrMF_, ventromedial frontal cortex; Precent_, precentral gyrus; Postcent_, postcentral gyrus; Temporal_, temporal lobe; HippocG_, parahippocampal and hippocampal area; Parietal_, parietal lobe; Caudate_, caudate nucleus; MD_, mediodorsal thalamus; CerLob, cerebellar lobe; AntCingG, anterior cingulate gyrus; PostCingG, posterior cingulate gyrus.
Network Analysis
We used a network analytic strategy for identification of specific metabolic topographies related to executive dysfunction in PD. This approach uses the scaled subprofile model [SSM; for review see Eidelberg et al., 2000] and principal component analysis (PCA) to identify significant patterns of regional metabolic covariation in combined rCMRglc data sets from patient and control groups. This procedure does not impose hypotheses regarding either the contributions of specific brain regions to the covariance pattern or the anatomic‐functional relationships among the contributing regions.
Once individual covariance patterns (principal components [PCs]) were identified by PCA, and according to previous studies on metabolic network abnormalities in PD [Eidelberg et al., 1994, 2000], we validated the use of this analytic approach in our study by verifying that one of the PCs was relevant to the major motor features of PD, and discriminated patients from controls with an accuracy of P ≤ 0.01 (F‐test according to Wilk's λ). Network analysis gave “region weights” for each studied ROI. Region weights, defined as those of most importance and reported in what follows, had an absolute value of ≥1 [Eidelberg et al., 2000].
In this study, we limited the analysis with cognitive rating to the first and second PCs, i.e., those with the highest effect sizes [eigenvalues] in the data [Eidelberg et al., 2000]. We first determined whether a pattern existed that discriminated PD patients from controls, and whether it resembled in qualitative comparison with the topography that we identified previously in other patient populations [Eidelberg et al., 2000]. We then determined whether subject scores for these PCs (singly or in combination) correlated with the cognitive ratings. Correlations were considered significant at P < 0.05 according to the Spearman rank test.
RESULTS
Network analysis was carried out on the CMRglc data from the combined group of the 15 non‐demented PD patients and 7 healthy control subjects (see Table III). PC1 (principal component) accounted for 26% of the subject × region variance. Its topography (Fig. 1) was characterized by a relative increased activity in the striatum and the mediodorsal thalamus associated with covariated relative decrease in prefrontal and cingulate regions. Subject scores for this pattern were elevated in the PD group relative to control values (P = 0.01, Fig. 1). PC1 subject scores correlated significantly with bradykinesia and global motor scores (P = 0.013, r = 0.655 and P = 0.016, r = 0.640, see Fig. 2, respectively, Spearman rank test), but not with ratings for rigidity, axial signs, or tremor.
Figure 1.
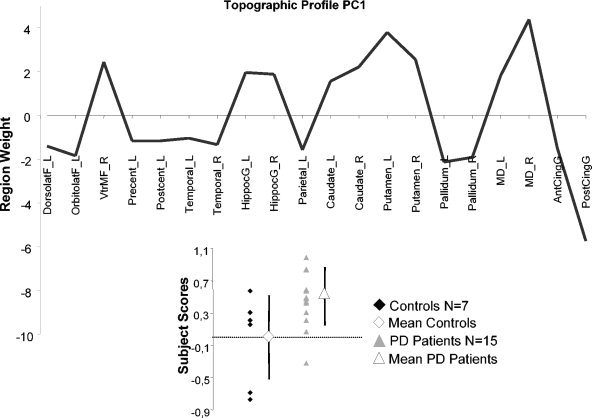
Display of region weights for metabolic covariance pattern PC1, a PDRP‐like pattern. Regions having weights with absolute values >1 were chosen empirically as contributing significantly to pattern topography. Regional metabolic covariance pattern was identified in PET data from combined group including 15 non‐demented PD patients and 7 healthy, age‐matched subjects. Pattern‐related increases in the striatum and mediodorsal thalamus covaried with relative metabolic decreases in prefrontal and cingulate regions. Bottom left: Scatter diagram of the PC1 subject scores for Controls (filled diamond) and PD patients (filled triangle). Mean control value (open diamond) and mean patient value (open triangle) are represented with subgroup SD, indicated with error bars. Control group subject scores for the SSM network were offset to a mean of zero so that individual subject scores for PD patient were interpreted relative to an adjusted metabolic baseline defined by the subject scores of control group. DorsolatF_L, left dorsolateral prefrontal cortex; OrbitolatF_L, left orbitofrontal cortex; VtrMF_R, right ventromedial frontal cortex; Precent_L, left precentral gyrus; Postcent_L, left postcentral gyrus; Temporal_L, left temporal lobe; Temporal_R, right temporal lobe; HippocG_L, left para‐hippocampal and hippocampal area; HippocG_R, right para‐hippocampal and hippocampal area; Parietal_L, left parietal lobe; Caudate_L, left caudate nucleus; Caudate_R, right caudate nucleus; Putamen_L, left putamen; Putamen_R, right putamen; Pallidum_L, left pallidum; Pallidum_R, right pallidum; MD_L, left mediodorsal thalamus; MD_R, right mediodorsal thalamus; AntCingG, anterior cingulate gyrus; PostCingG, posterior cingulate gyrus (see Methods for details on these anatomic‐functional regions).
Figure 2.
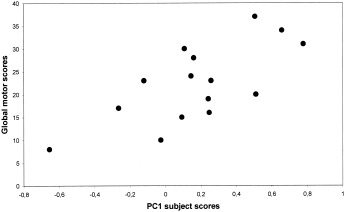
Scatterplots of patient PC1 subject scores vs. global motor scores as rated by the Columbia modified scale. Correlations were statistically significant by nonparametric Spearman rank test (P = 0.016, r = 0.640).
Two pieces of evidence became apparent after this preliminary study: (1) the first PC in our study described a network of regions topographically similar (region weight correlation: R 2 ∼40%, P < 0.001) to that identified in other PD populations [Eidelberg et al., 2000]; (2) the correlations between the subject scores and motor ratings displayed a pattern similar to that described previously [Eidelberg et al., 2000; Feigin et al., 2001].
We next sought to identify an executive‐related network in PD. We found that subject scores for PC2, but not PC1, correlated with the cognitive measures. This pattern, accounting for 17% of the subject × region covariance, was characterized by increased metabolic activity in left pallidum and mediodorsal thalamus associated with relative declines bilaterally in ventromedial frontal regions, striatum and in the left hippocampal gyrus (Fig. 3). In PD patients, subject scores for this pattern correlated positively with CAL subscores (CALeprc: P = 0.005, r = 0.744, Fig. 4A; CALe: P = 0.01, r = 0.690, and CALsc: P = 0.02, r = 0.594), such that pattern expression was elevated with increasing errors; PC2 scores correlated negatively with BPP subscores (BP3: P = 0.017, r = −0.651, Fig. 4B) such that pattern expression was increased with lower performance. The positive and negative correlations between greater errors with CAL or lesser performance with BPP, respectively, on one hand, and PC2 subject scores, on the other hand represent the same direction of the cognitive relation with pattern expression. In controls, PC2 subject scores did not correlate with BPP subscores.
Figure 3.
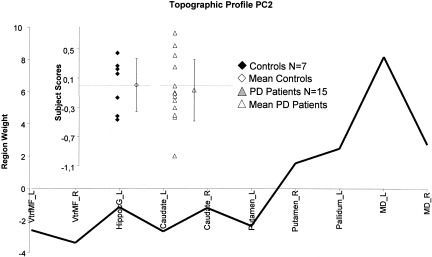
Display of region weights for metabolic covariance pattern PC2. Regions having weights with absolute values >1 were chosen empirically as contributing significantly to pattern topography Regional metabolic covariance pattern was identified in PET data from combined group including 15 non‐demented PD patients and 7 healthy, age‐matched subjects. Pattern‐related increases in the pallidum and mediodorsal thalamus covaried with relative metabolic decreases in ventromedial frontal regions and hippocampal gyrus. Inset: Scatter diagram of the PC2 subject scores for Controls (filled diamond‐shaped) and PD patients (filled triangle). Mean control value (open diamond) and mean patient value (open triangle) are represented with subgroup SDs, indicated with error bars. Control group subject scores for the SSM network were offset to a mean of zero so that individual subject scores for PD patient were interpreted relative to an adjusted metabolic baseline defined by the subject scores of control group. VtrMF_L, left ventromedial frontal cortex; VtrMF_R, right ventromedial frontal cortex; HippocG_L, left para‐hippocampal and hippocampal area; Caudate_L, left caudate nucleus; Caudate_R, right caudate nucleus; Putamen_L, left putamen; Putamen_R, right putamen; Pallidum_L, left pallidum; MD_L, left mediodorsal thalamus; MD_R, right mediodorsal thalamus.
Figure 4.
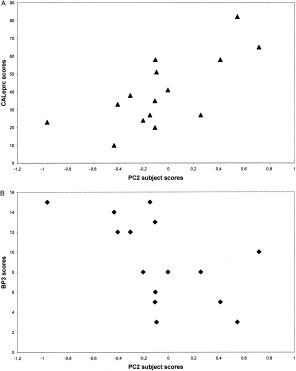
Scatterplots of individual PC2 subject scores vs. CALeprc error scores (A) and BP3 performance (B) for the group of PD patients (n = 15). Both correlations were statistically significant by nonparametric Spearman rank test (P = 0.005, r = 0.744 and P = 0.017, r = −0.651, respectively).
DISCUSSION
We identified a metabolic brain network related to executive dysfunction in PD. We initially validated the use of the network approach in our data by identifying a disease‐related pattern that correlated with patient's motor disability; the second pattern correlated with dysfunction of executive control in the patient cohort. In the following discussion, we will address issues of methodology and the relevance of the anatomic‐functional results to the understanding of cognitive functioning in parkinsonism.
We employed a means of network analysis that has been applied to PD and other movement disorders [see Eidelberg et al., 2000 for review]. This technique has also been used recently to assess effects of medical and surgical interventions for parkinsonism [Carbon and Eidelberg, 2002; Feigin et al., 2001]. In those studies and in ours, the network analysis was conducted blind to clinical and neuropsychologic subject status. This approach revealed a discriminating factor (PC1), with effect size and topographic features similar to those described previously in 5 independent patient populations scanned in the resting state [Eidelberg et al., 2000]. Subject scores, indicating pattern activity in individual subjects, distinguished patients from controls and correlated with objective measures of clinical severity. The major effect in the combined group analysis thus was represented by a typical disease‐related pattern [Eidelberg et al., 2000] in our treated patient group. Concerning the role of l‐dopa, Feigin and coworkers [2001] in a FDG‐PET study of a patient cohort with motor disability comparable to the present group reported a significant effect of dopaminergic medication on expression of the closely related Parkinson's disease‐related pattern (PDRP) metabolic pattern. Interestingly, these investigators found that the relationship with motor scores was linear, suggesting that on‐state correlation with these clinical descriptors remains valid. The neuropsychological indices of executive functioning did not correlate with PC1 expression in either patients or controls. Nonetheless, the second major effect in the data, the statistically orthogonal PC2, was related to this aspect of behavior and correlated with the performance of tasks assessing executive control [Miyake et al., 2000]. The CAL assesses attention, concentration, and problem solving by requiring internal generation of a successful strategy [Trepanier et al., 1998]. The BPP is a double‐task procedure assessing the attentional controlling system [Baddeley, 2000] and requires simultaneous manipulation of information into working memory: backward counting and the recalling of words. Although differing in modality (i.e., visuospatial for CAL and verbal for BPP), these tests share common processes suggested to be nonautomatic [Pillon et al., 1998], which demand focused and sustained attention to monitor information.
Although correlations of PC2 scores with BPP and CAL were of opposite direction, they reflected a consistent network‐performance relationship. The correlation with CAL errors was positive, such that the worse performance, the greater the pattern expression. The correlation with BPP performance was negative, also indicating greater network expression with lower performance. The correlations with PC2 existing for the two tests suggest that this functional pattern is related to a common executive process. The topography of PC2 involved covarying metabolic activity in prefrontal cortex, striatum and pallidum, medial thalamus, and hippocampal gyrus. In this network, metabolism in the ventromedial frontal cortex covaried in a direction opposite to that in the dorsomedial thalamus. This finding is compatible with Alexander's model of the limbic loop [Alexander et al., 1990] and with our previous work [Marié et al., 1995]. It is of interest that the putamen was involved in this circuit, as it is implicated generally in motor pathways [Alexander et al., 1990]. The dissociation between motor and associative parts of the striatum has been discussed elsewhere [Rolls, 1994]. Another type of partition, matrix versus striosomes, is present throughout the striatum. Striosomes of the putamen as well as those of caudate seem to be implicated in behavioral processes and are innervated largely by limbic structures [Graybiel et al., 2000]. Furthermore, recent studies in PD have revealed significant correlations between prefrontal cognitive deficits and dopamine transporter binding in both putamen and caudate [Muller et al., 2000]. The implication of the caudate in our pattern is consistent with the fact that caudate dopaminergic binding of presynaptic dopaminergic markers in PD patients has been shown to be correlated with impaired performance in tests sensitive to frontal lobe function [Marié et al., 1999 using 11C‐S‐nomifensine; Brück et al., 2001 using 18F‐l‐dopa].
Involvement of the parahippocampal region has been described in correlative PET studies of planning and working memory [Dagher et al., 2001]. Indeed, the hippocampus is highly connected with medial frontal cortex and is involved in selective attention [Salzmann et al., 1993], which is required for subsequent information processing. Furthermore, our findings may relate to the role of the mesial temporal lobe region in the fundamental mnemonic circuit serving different cortical systems, one of which is the frontal cortex [Owen et al., 1996].
The prefrontal region that emerged in PC2 was ventromedial. Lesions in this region tend to produce impairments of decision making and planning, possibly influenced by emotional processing [Damasio, 1995]. Attention‐demanding tasks, as used in our cognitive paradigm, have been related to the ventromedial frontal cortex [Gusnard et al., 2001]. Alternatively, the contribution of prefrontal cortex to PC2 may be due to pathologic abnormalities in the mesocortical dopaminergic function in PD [Mattay et al., 2002].
The dorsolateral prefrontal cortex (DLPFC) did not contribute significantly to the cognitive covariance pattern, although this region has been demonstrated repeatedly to be involved in executive functioning [D'Esposito et al., 1995; Manes et al., 2002; Owen et al., 1996, 1998; Postle et al., 1999; for review see Smith and Jonides, 1999]. One reason for this may relate to the ROI analysis that was carried out in this study. The DLPFC metabolic activity was taken as the mean of activity among 10 circular regions on each side across three PET planes. Given the cytoarchitectonic heterogeneity of the analyzed regions, the use of large volumes may have resulted in a loss of specificity. In any event, a recent correlative study using a similar multivariate approach [Mentis et al., 2002] also did not reveal large correlations between resting DLPFC metabolism and executive functioning in PD patients. This suggests that studies of brain activation during actual cognitive performance may be necessary to highlight correlations between DLPFC function and behavior [e.g., Owen et al., 1996].
We note that although PC2 subject scores correlated with BPP in patients but not in controls, mean values of network activity did not differ between groups. It is therefore possible that PC2 subserves a different role in health as compared to disease [Moeller and Eidelberg, 1997]. Larger numbers of young and older controls will need to be studied to determine the relationship of PC2 activity to normal cognitive function.
Finally, to determine whether the states of our patients, treated on state altered our results, an ancillary analysis was conducted. We used the rCMRglc data of the patients scanned by Feigin and colleagues [2001] to determine whether l‐dopa administration altered expression of the PC2 topography in an independent cohort of comparably mild (H&Y Stage 1–2) patients. PC2 subject scores were quantified in each of these 7 subjects in the on and off medication states, as described previously [Carbon and Eidelberg, 2002; Eidelberg et al., 2000]. In this preliminary analysis, we did not detect a significant effect of treatment on PC2 expression in this small group of patients (D.E., personal communication). The investigation of a larger cohort of subjects scanned on and off medication will be needed to exclude fully the possibility of a significant treatment effect on the expression of this pattern.
In conclusion, this study, using resting state FDG/PET measurements and network analysis, disclosed two independent patterns of correlations in PD patients. One pattern was disease‐related and correlated with motor dysfunction. The other was associated with executive control. Our findings suggest that executive control is not dependent solely upon prefrontal metabolic activity, but rather is related to the activity of subcortico‐cortical pathways [Rogers et al., 1998]. This finding is reinforced by recent results of deep brain stimulation studies showing changes in executive tasks [Jahanshahi et al., 2000].
Acknowledgements
We thank Dr. H. Ollat and Prof. G.L. Defer.
REFERENCES
- Alexander GE, Crutcher MD, DeLong MR (1990): Basal ganglia‐thalamocortical circuits: parallel substrates for motor, oculomotor, “prefrontal” and “limbic” functions. Prog Brain Res 85: 119–146. [PubMed] [Google Scholar]
- Allain P, Travere JM, Baron JC, Bloyet D (1992): Multimodal analysis of brain images by superimposition of information from PET, 3‐D‐RMI and atlas data bases. Acta Stereologica, Proceedings of the Eighth International Congress for Stereology. 11: 181–185. [Google Scholar]
- Baddeley A (2000): The episodic buffer: a new component of working memory? Trends Cogn Sci 4: 417–423. [DOI] [PubMed] [Google Scholar]
- Bernheimer H, Birkmayer W, Hornykiewicz O, Jellinger K, Seitelberger F (1973): Brain dopamine and the syndromes of Parkinson and Huntington. Clinical, morphological and neurochemical correlations. J Neurol Sci 20: 415–455. [DOI] [PubMed] [Google Scholar]
- Brück A, Portin R, Lindell A, Laihinen A, Bergman J, Haaparanta M, Solin O, Rinne JO (2001): Positron emission tomography shows that impaired frontal lobe functioning in Parkinson's disease is related to dopaminergic hypofunction in the caudate nucleus. Neurosci Lett 311: 81–84. [DOI] [PubMed] [Google Scholar]
- Carbon M, Eidelberg DE (2002): Modulation of regional brain function by deep brain stimulation: studies with positron emission tomography. Curr Opin Neurol 15: 451–455. [DOI] [PubMed] [Google Scholar]
- Collette F, Salmon E, Van der Linden M, Chicherio C, Belleville S, Degueldre C, Delfiore G, Franck G (1999): Regional brain activity during tasks devoted to the central executive of working memory. Brain Res Cogn Brain Res 7: 411–417. [DOI] [PubMed] [Google Scholar]
- Dagher A, Owen AM, Boecker H, Brooks DJ (2001): The role of the striatum and hippocampus in planning: a PET activation study in Parkinson's disease. Brain 124: 1020–1032. [DOI] [PubMed] [Google Scholar]
- Damasio AR (1995): On some functions of the human prefrontal cortex. Ann N Y Acad Sci 769: 241–251. [DOI] [PubMed] [Google Scholar]
- D'Esposito M, Detre JA, Alsop DC, Shin RK, Atlas S, Grossman M (1995): The neural basis of the central executive system of working memory. Nature 378: 279–281. [DOI] [PubMed] [Google Scholar]
- Dubois B, Boller F, Pillon B, Agid Y (1991): Cognitive deficit in Parkinson's disease In: Boller F, Grafman J, editors. Handbook of Neuropsychology, volume 9 p. 195–239. [Google Scholar]
- Duvoisin RC (1970): The evaluation of extrapyramidal disease In: de Ajuriagerra J, editor. Monoamines, noyaux gris centraux et syndrome de Parkinson. Paris: Masson; p 313–325. [Google Scholar]
- Eidelberg D, Edwards C, Mentis M, Dhawan V, Moeller JR (2000): Movement disorders: Parkinson's disease In: Mazziotta JC, Toga AW, Frackowiak RS, editors. Brain mapping: the disorders. San Diego: Academic Press; p 241–261. [Google Scholar]
- Eidelberg D, Moeller JR, Dhawan V, Spetsieris P, Takikawa S, Ishikawa T, Chaly T, Robeson W, Margouleff D, Przedborski S (1994): The metabolic topography of parkinsonism. J Cereb Blood Flow Metab 14: 783–801. [DOI] [PubMed] [Google Scholar]
- Feigin A, Fukuda M, Dhawan V, Przedborski S, Jackson‐Lewis V, Mentis MJ, Moeller JR, Eidelberg D (2001): Metabolic correlates of levodopa response in Parkinson's disease. Neurology 57: 2083–2088. [DOI] [PubMed] [Google Scholar]
- Gelb DJ, Oliver E, Gilman S (1999): Diagnostic criteria for Parkinson disease. Arch Neurol 56: 33–39. [DOI] [PubMed] [Google Scholar]
- Gotham AM, Brown RG, Marsden CD (1988): “Frontal” cognitive function in patients with Parkinson's disease “on” and “off” levodopa. Brain 111: 299–321. [DOI] [PubMed] [Google Scholar]
- Graybiel AM, Canales JJ, Capper‐Loup C (2000): Levodopa‐induced dyskinesias and dopamine‐dependent stereotypies: a new hypothesis. Trends Neurosci 23(Suppl.): 71–77. [DOI] [PubMed] [Google Scholar]
- Gusnard DA, Akbudak E, Shulman GL, Raichle ME (2001): Medial prefrontal cortex and self‐referential mental activity: relation to a default mode of brain function. Proc Natl Acad Sci USA 98: 4259–4264. [DOI] [PMC free article] [PubMed] [Google Scholar]
- Jahanshahi M, Ardouin CM, Brown RG, Rothwell JC, Obeso J, Albanese A, Rodriguez‐Oroz MC, Moro E, Benabid AL, Pollak P, Limousin‐Dowsey P (2000): The impact of deep brain stimulation on executive function in Parkinson's disease. Brain 123: 1142–1154. [DOI] [PubMed] [Google Scholar]
- Lees AJ, Smith E (1983): Cognitive deficits in the early stages of Parkinson's disease. Brain 106: 257–270. [DOI] [PubMed] [Google Scholar]
- Lezak MD (1983): Neuropsychological assessment. 2nd ed. New York: Oxford University Press. [Google Scholar]
- Magistretti PJ, Pellerin L, Rothman DL, Shulman RG (1999): Energy on demand. Science 283: 496–497. [DOI] [PubMed] [Google Scholar]
- Manes F, Sahakian B, Clark L, Rogers R, Antoun N, Aitken M, Robbins T (2002): Decision‐making processes following damage to the prefrontal cortex. Brain 125: 624–639. [DOI] [PubMed] [Google Scholar]
- Marié RM, Rioux P, Eustache F, Travère JM, Lechevalier B, Baron JC (1995): Clues about the functional neuroanatomy of verbal working memory: a study of resting brain glucose metabolism in Parkinson's disease. Eur J Neurol 2: 83–94. [DOI] [PubMed] [Google Scholar]
- Marié RM, Barre L, Dupuy B, Viader F, Defer G, Baron JC (1999): Relationships between striatal dopamine denervation and frontal executive tests in Parkinson's disease. Neurosci Lett 260: 77–80. [DOI] [PubMed] [Google Scholar]
- Mattay VS, Tessitore A, Callicott JH, Bertolino A, Goldberg TE, Chase TN, Hyde TM, Weinberger DR (2002): Dopaminergic modulation of cortical function in patients with Parkinson's disease. Ann Neurol 51: 156–164. [DOI] [PubMed] [Google Scholar]
- Mazoyer B, Trebossen R, Shoukroun C (1990): Physical characteristics of TTV03 a new high spatial resolution time‐of‐flight positron tomograph. IEEE Trans Nucl Sci 37: 770–782. [Google Scholar]
- Mentis MJ, McIntosh AR, Perrine K, Dhawan V, Berlin B, Feigin A, Edwards C, Mattis P, Eidelberg D (2002): Relationships between the metabolic patterns that correlated with mnemonic, visuospatial, and mood symptoms in Parkinson's disease. Am J Psychiatry 159: 746–754. [DOI] [PubMed] [Google Scholar]
- Miyake A, Friedman NP, Emerson MJ, Witzki AH, Howerter A (2000): The unity and diversity of executive functions and their contributions to complex “frontal lobe” tasks: a latent variable analysis. Cogn Psychol 41: 49–100. [DOI] [PubMed] [Google Scholar]
- Moeller JR, Eidelberg D (1997): Divergent expression of regional metabolic topographies in Parkinson's disease and normal aging. Brain 120: 2197–2206. [DOI] [PubMed] [Google Scholar]
- Montgomery SA, Asberg M (1979): A new depression scale designed to be sensitive to change. Br J Psychiatry 134: 382–389. [DOI] [PubMed] [Google Scholar]
- Morris RG (1986): Short‐term forgetting in senile dementia of the Alzheimer's type. Cogn Neuropsychol 3: 77–97. [Google Scholar]
- Muller U, Wachter T, Barthel H, Reuter M, von Cramon DY (2000): Striatal [123I]beta‐CIT SPECT and prefrontal cognitive functions in Parkinson's disease. J Neural Transm 107: 303–319. [DOI] [PubMed] [Google Scholar]
- Owen AM, Doyon J, Petrides M, Evans AC (1996): Planning and spatial working memory: a positron emission tomography study in humans. Eur J Neurosci 8: 353–364. [DOI] [PubMed] [Google Scholar]
- Owen AM, Doyon J, Dagher A, Sadikot A, Evans AC (1998): Abnormal basal ganglia outflow in Parkinson's disease identified with PET. Implications for higher cortical functions. Brain 121: 949–965. [DOI] [PubMed] [Google Scholar]
- Owen AM, Doyon J (1999): The cognitive neuropsychology of Parkinson's disease: a functional neuroimaging perspective. Adv Neurol 80: 49–56. [PubMed] [Google Scholar]
- Petrides M (1985): Deficit in non‐spatial conditional associative learning after periarcuate lesions in the monkey. Behav Brain Res 16: 95–101. [DOI] [PubMed] [Google Scholar]
- Petrides M (1990): Nonspatial conditional learning impaired in patients with unilateral frontal but not unilateral temporal lobe excisions. Neuropsychologia 28: 137–149. [DOI] [PubMed] [Google Scholar]
- Phelps ME, Huang SC, Hoffman EJ, Selin C, Sokoloff L, Kuhl DE (1979): Tomographic measurement of local cerebral glucose metabolic rate in humans with (F‐18)2‐fluoro‐2‐deoxy‐d‐glucose: validation of method. Ann Neurol 6: 371–388. [DOI] [PubMed] [Google Scholar]
- Pillon B, Deweer B, Vidailhet M, Bonnet AM, Hahn‐Barma V, Dubois B (1998): Is impaired memory for spatial location in Parkinson's disease domain specific or dependent on “strategic” processes? Neuropsychologia 36: 1–9. [DOI] [PubMed] [Google Scholar]
- Postle BR, Berger JS, D'Esposito M (1999): Functional neuroanatomical double dissociation of mnemonic and executive control processes contributing to working memory performance. Proc Natl Acad Sci USA 96: 12959–12964. [DOI] [PMC free article] [PubMed] [Google Scholar]
- Rogers RD, Sahakian BJ, Hodges JR, Polkey CE, Kennard C, Robbins TW (1998): Dissociating executive mechanisms of task control following frontal lobe damage and Parkinson's disease. Brain 121: 815–842. [DOI] [PubMed] [Google Scholar]
- Rolls ET (1994): Neurophysiology and cognitive functions of the striatum. Rev Neurol 150: 8–9. [PubMed] [Google Scholar]
- Salzmann E, Vidyasagar TR, Creutzfeldt OD (1993): Functional comparison of neuronal properties in the primate posterior hippocampus and parahippocampus (area TF/TH) during different behavioral paradigms involving memory and selective attention. Behav Brain Res 53: 133–149. [DOI] [PubMed] [Google Scholar]
- Shallice T (1988): From neuropsychology to mental structures. Cambridge: Cambridge University Press. [Google Scholar]
- Smith EE, Jonides J (1999): Storage and executive processes in the frontal lobes. Science 283: 1657–1661. [DOI] [PubMed] [Google Scholar]
- Talairach J, David M, Tournoux P (1957): Atlas d'anatomie stéréotaxique. Repérages radiologiques indirect des noyaux gris centraux des régions mesencephalo‐sous‐optique et hypothalamique chez l'homme. Paris: Masson. [Google Scholar]
- Talairach J, Tournoux P (1988): Coplanar stereotaxic atlas of the human brain. New York: Thieme. [Google Scholar]
- Taylor AE, Saint‐Cyr JA (1995): The neuropsychology of Parkinson's disease. Brain Cogn 28: 281–296. [DOI] [PubMed] [Google Scholar]
- Trepanier LL, Saint‐Cyr JA, Lozano AM, Lang AE (1998): Neuropsychological consequences of posteroventral pallidotomy for the treatment of Parkinson's disease. Neurology 51: 207–215. [DOI] [PubMed] [Google Scholar]