

Abstract
Functional magnetic resonance imaging (fMRI) was used to determine whether performance on lexical tasks was correlated with cerebral activation patterns. We found that such relationships did exist and that their anatomical distribution reflected the neurocognitive processing routes required by the task. Better performance on intramodal tasks (determining if visual words were spelled the same or if auditory words rhymed) was correlated with more activation in unimodal regions corresponding to the modality of sensory input, namely the fusiform gyrus (BA 37) for written words and the superior temporal gyrus (BA 22) for spoken words. Better performance in tasks requiring cross‐modal conversions (determining if auditory words were spelled the same or if visual words rhymed), on the other hand, was correlated with more activation in posterior heteromodal regions, including the supramarginal gyrus (BA 40) and the angular gyrus (BA 39). Better performance in these cross‐modal tasks was also correlated with greater activation in unimodal regions corresponding to the target modality of the conversion process (i.e., fusiform gyrus for auditory spelling and superior temporal gyrus for visual rhyming). In contrast, performance on the auditory spelling task was inversely correlated with activation in the superior temporal gyrus possibly reflecting a greater emphasis on the properties of the perceptual input rather than on the relevant transmodal conversions. Hum. Brain Mapping 19:155–169, 2003. © 2003 Wiley‐Liss, Inc.
INTRODUCTION
The lexical processing routes that link a word to its meaning contain unimodal as well as heteromodal components [Mesulan, 1990, 1998, 2000, 2002]. Unimodal brain regions provide a site for the modality‐specific elaboration of sensory information, and heteromodal areas provide a site for the integration of inputs from brain areas responsible for representing this modality‐specific information. The relevant sequence of events for lexical processing becomes initiated by the encoding of sensory inputs into word forms within specialized unimodal association areas of the fusiform gyrus for written words and the superior temporal gyrus for spoken words. These modality‐specific word forms can then access heteromodal components of the language network, including those in the inferior frontal gyrus (e.g., Broca's area) and the temporo‐parietal region (e.g., Wernicke's area), so that they can evoke the distributed associations that encode their meaning [Booth et al., 2001, 2002b]. This model, based principally on clinical observations of patients with brain damage, is receiving substantial confirmation from functional imaging experiments conducted in neurologically intact subjects. For example, functional imaging experiments have shown that the phonological representation of spoken words involve unimodal auditory areas of the superior temporal gyrus [Binder et al., 1994; Giraud and Price, 2001; Howard et al., 1992] and that the orthographic representations of written words involve unimodal visual areas of the fusiform gyrus [Fujimaki et al., 1999; Herbster et al., 1997; Nobre et al., 1994; Petersen et al., 1990]. Furthermore, tasks based on cross‐modal conversions between phonologic and orthographic representations have been shown to activate heteromodal cortices in the angular and supramarginal gyri [Booth et al., 2002a; Flowers et al., 1991; Kareken et al., 2000; Lurito et al., 2000; Pugh et al., 1996; Tokunaga et al., 1999; Xu et al., 2001]. Although these activation patterns are established, their relationship to performance levels is not fully understood.
The relationships between task performance and the magnitude of cerebral activation as detected by functional imaging are complex. Some functional imaging studies have shown that individual differences in accuracy and reaction time are correlated with the magnitude of activation [Honey et al., 2000; Ng et al., 2001] and that easier cognitive tasks produce less activation than difficult tasks [Caplan et al., 1998; Carpenter et al., 1999; Just et al., 1996]. Other studies, employing visual, motor, conceptual, and language tasks, have demonstrated that the magnitude of activation changes with practice and competence [Aizenstein et al., 2000; Raichle et al., 1994; Ramnani et al., 2000; Rauch et al., 1997; Sakai et al., 1998; Seger et al., 2000] and that improved performance during training may alter the effective connectivity among brain regions engaged by the task [Buechel et al., 1999; Fletcher et al., 1999].
In this study, we explored whether the relation between performance levels and activation patterns was influenced by the neurocognitive processing routes engaged by the lexical task. To this end, we examined how behavioral performance (as assessed by accuracy and reaction time) was related to the magnitude of regional cortical activation during intramodal and cross‐modal lexical tasks. “Intramodal” was defined as the tasks only requiring processing within a representational system (e.g., auditory or visual word forms) for correct performance. “Cross‐modal” was defined as tasks requiring the conversion between representational systems for correct performance. A correct answer on our cross‐modal tasks was not possible without this conversion because we included orthographically dissimilar items (e.g., grade, laid). The studies reviewed above suggest that intramodal tasks should activate unimodal word form areas associated with the modality of input, whereas cross‐modal tasks should activate posterior heteromodal regions in addition to unimodal word form areas for representing the target of the conversion process. We expected that better performance would be specifically linked to the intensity of activation in the unimodal and heteromodal information processing routes engaged by the specific task.
SUBJECTS AND METHODS
Participants
Thirteen adults (10 women, 1 man; mean age = 24.6 years, range = 20–35 years) participated in this study. Eleven subjects completed both the visual and auditory tasks; the other two (both males) completed tasks in only one modality. Due to missing behavioral performance data from one individual, some of the correlations between activation and accuracy or reaction time were calculated based on 11 participants. All participants were right‐handed according to a 10‐item Likert Scale questionnaire (mean = 89, range = 65–100) and were given an informal interview to ensure that they did not have a history of intelligence, reading, or oral‐language deficits. All participants were undergraduate or graduate students at Northwestern University and were native English speakers with normal hearing and normal or corrected‐to‐normal vision. All participants were free of neurological diseases or psychiatric disorders and were not taking medication affecting the central nervous system. The Institutional Review Board at Northwestern University and Evanston Northwestern Healthcare Research Institute approved the recruitment of subjects and the informed consent procedures.
Functional activation tasks
In the word‐judgment tasks, three words were presented sequentially and the participant had to determine whether the final word matched either of the two previous words according to a predefined rule. In the spelling task, participants determined whether the final word had the same rime spelling as either of the first two words. The rime included all letters after the first consonant or consonant cluster [Bowey, 1990]. In the rhyming task, participants determined whether the final word rhymed with either of the first two words. Table I presents the stimuli for the spelling and rhyming tasks in the visual and auditory modality.
Table I.
Examples of stimuli for the word judgment tasks
| Orthography | ||
|---|---|---|
| Similar | Dissimilar | |
| Spelling | ||
| First match | hold–plant–cold | hope–colt–soap |
| Second match | built–vote–note | slid–lane–strain |
| Rhyming | ||
| First match | seat–fresh–heat | jazz–last–has |
| Second match | wish–fall–wall | myth–home–foam |
For both the spelling and rhyming tasks, half of the target trials contained a target word that rhymed and was orthographically similar one of the preceding two words (i.e., had the same rime). The other half contained a target word that rhymed but was orthographically dissimilar to one of the preceding two words. In addition, half of the correct trials involved a match to the first stimulus (first match) and half involved a match to the second stimulus (second match). The first and second match variable was included so as to make the task relatively demanding for adults. If there was a match according to the criterion, the participant pressed a button with the index finger; if there was no match, the participant pressed a different button with the middle finger.
Stimulus characteristics
All tasks were structured in a similar way so patterns of brain activation could be compared across tasks. First, the tasks contained a similar number of nouns (55–65%), verbs (25–35%), and adjectives (10–20%) based on their most frequent usage in the Oxford English Dictionary. Second, none of the words were homophones or contained more than two syllables. Third, the tasks consisted of words with similar adult word frequency for written and spoken language [Baayen et al., 1995]. We confirmed that there were no significant differences between the tasks by calculating a 2‐task (spelling, rhyming) × 2 modality (auditory, visual) ANOVA. This analysis revealed no significant main effects or interactions for the written counts (91 for visual spelling, 90 for visual rhyming, 91 for auditory spelling, and 72 for auditory rhyming) or spoken counts (80 for visual spelling, 96 for visual rhyming, 94 for auditory spelling, and 65 for auditory rhyming).
Visual word judgment tasks
Each word reading task lasted 9 min consisting of 10 blocks of 54 sec. This included a 4‐sec introduction screen to each block: “Spelling” for orthographic task, “Rhyming” for phonologic task. The five experimental blocks alternated with the five control blocks. In each trial for the experimental blocks, three consecutive words were presented in lowercase letters with each word presented for 800 msec followed by a 200‐msec blank interval. A yellow fixation cross (+) appeared on the screen after the third stimulus was removed, indicating the need to make a response during the subsequent 2,000‐msec interval. Participants were told that they could respond before the yellow cross (+) appeared on the screen. Participants were encouraged to respond as quickly as possible without making errors. Each trial lasted a total of 5,000 msec and there were 10 trials in each block.
Auditory word judgment tasks
The timing for the auditory tasks was the same as for the visual tasks, but the auditory tasks employed a different list of stimuli. All stimuli for this task were recorded in a soundproof booth using a digital recorder and a high quality stereo microphone. A native Chicagoan female speaker read each word in isolation so that there would be no contextual effects. Each word was transferred to the computer for processing at a sample rate of 22.05 Hz and a sample size of 8 bits. Individual files were created for each word and a 1‐msec silence was added to the beginning and end of each word. All words shorter than 600 msec or longer than 800 msec were equated to these durations using a tempo transformation (less than 1% of the words). All words were then normalized so that they were of equal amplitude. The stimuli were easily heard through the headphones in the 1.5 Tesla scanner.
During the auditory tasks, a white fixation cross (+) was on the screen during the presentation of the auditory stimuli. As in the visual word tasks, a yellow fixation cross (+) appeared on the screen after the third stimulus was presented, indicating the need to make a response. Participants were asked to fixate on the cross during the entire trial.
Control conditions
The experimental setup and timing for the control blocks was exactly the same as for the word blocks. For control blocks in the visual tasks, the three stimuli were abstract, non‐linguistic symbols consisting of straight lines (see Table II). For control blocks in the auditory tasks, the three stimuli were high (700 Hz), medium (500 Hz), and low frequency (300 Hz) non‐linguistic pure tones (see Table II). The tones were 600 msec in duration and contained a 100‐msec linear fade in and a 100‐msec linear fade out. As with the experimental blocks, there was a 4‐sec introduction screen to each block: “Lines” for visual control and “Tones” for auditory control.
Table II.
Examples of stimuli for control tasks in the visual and auditory modality
| Modality | ||
|---|---|---|
| Visual | Auditory | |
| First match | / \ – \ \ –/ \ | 300, 500, 300 Hz |
| Second match | // – \ \ – \ \ | 500, 700, 700 Hz |
Experimental procedure
After informed consent was obtained, participants were administered the informal interview and the first practice session in a simulator in order to acclimate the participant to the scanner environment [Rosenberg et al., 1997]. The participant practiced a full‐length version of each experimental task in the simulator. Different stimuli (matched in their stimulus characteristics) were used in the practice and fMRI sessions. Within 3 days, the participant was administered the first MRI session. Within 2 months, the participant was administered the second practice and MRI session. The auditory and visual tasks were run on separate days with an approximately equal number of participants receiving the visual and auditory modality first.
MRI data acquisition
After screening, the participant was asked to lie down on the scanner bed. The head position was secured with a specially designed vacuum pillow (Bionix, Toledo, OH) that allowed for the insertion of two earphones (for the auditory sessions). An optical response box (Lightwave Medical, Burnaby, Canada) was placed in the participant's right hand and a compression alarm ball was placed in the left hand. The head coil was positioned over the participant's head and a goggle system for the visual presentation of stimuli (Avotec, Jensen Beach, FL) was secured to the head coil. Each imaging session took less than one hour.
All images were acquired using a 1.5‐Tesla GE scanner. Gradient echo localizer images were acquired to determine the placement of the functional slices. For the functional imaging studies, a susceptibility weighted single‐shot EPI (echo planar imaging) method with BOLD (blood oxygenation level‐dependent) was used. The following scan parameters were used: TE = 40 msec, flip angle = 90 degrees, matrix size = 64 × 64, field of view = 22 cm, slice thickness = 4 mm, number of slices = 32. These scanning parameters resulted in a 3.437 × 3.437 × 4 mm voxel size. The acquisition of this volume was repeated every 3 sec (TR = 3,000 msec) for a total of 9 min per run. This resulted in 90 volumes for the each word judgment task and 90 volumes for each non‐linguistic control task.
At the end of the functional imaging session, a high resolution, T1‐weighted 3‐D image was acquired (SPGR, TR = 21 msec, TE = 8 msec, flip angle = 20 degrees, matrix size = 256 × 256, field of view = 22 cm, slice thickness = 1 mm). These scanning parameters resulted in a 0.86 × 0.86 × 1 mm voxel size. The orientation of this 3‐D volume was identical to the functional slices.
Image data analysis
Data analysis was performed using SPM‐99 (Statistical Parametric Mapping) for motion correction and statistical inference [Friston et al., 1994, 1995a,b]. Application Visualization System (AVS) software with customized modules was used for visualization.
The functional images were realigned to the last functional volume in the scanning session using affine transformations. No individual runs (spelling or rhyming in either the visual or auditory modality) had more than 2.5 mm maximum displacement (less than the voxel size) from the beginning to the end of the run for any participant in the x‐plane (mean = 0.20, range = 0.03–0.70), y‐plane (mean = 0.32, range = 0.11–1.65), or z‐plane (mean = 0.56, range = 0.10–2.48). Furthermore, no individual runs had more than 3 degrees of maximum displacement in rotation from the beginning to the end of the run for pitch (mean = 0.87, range = 0.30–2.74), yaw (mean = 0.70, range = 0.14–1.76), or roll (mean =0.50, range = 0.10–1.23). All statistical analyses were conducted on these movement‐corrected images.
Images were then segmented within subjects using SPM‐99 and the gray–white matter information was used to co‐register the structural and functional images. The co‐registered images were normalized within subjects using SPM‐99 to the MNI stereotaxic template (12 linear affine parameters for brain size and position, 8 non‐linear iterations and 2 × 2 × 2 nonlinear basis functions for subtle morphological differences). The MNI template used for normalization by SPM‐99 is similar to the Talairach and Tournoux [1988] stereotaxic atlas.
Statistical analyses were calculated on the smoothed data (7‐mm isotropic Gaussian kernal) using a delayed boxcar design with a 6‐sec delay from onset of block in order to account for the lag in hemo‐dynamic response. A high‐pass filter was applied equal to two cycles of the experimental and control conditions (216 sec) in order to remove low frequency effects such as signal drift, cardiac and respiratory pulsations. We used global normalization to scale the mean of each scan to a common value in order to correct for whole brain differences over time.
Random effects statistics allowed generalization to the population by accounting for inter‐subject variance. In the first level analysis, we calculated parameter estimate images for individual subjects based on contrasts comparing the experimental and control conditions in order to analyze the two‐word judgment tasks (spelling, rhyming) in the two modalities (visual, auditory). In the second level analysis, these parameter estimate images were entered into one‐sample Z‐tests for inferences about single tasks. Areas of activation are only reported in our four apriori regions of interest: (A) unimodal visual regions including fusiform gyrus (BA 37), (B) unimodal auditory regions including the superior temporal gyrus (BA 42, 22), (C) posterior heteromodal regions including supramarginal gyrus (BA 40) and angular gyrus (BA 39), and (D) inferior frontal gyrus (BA 47, 45, 44, 46, 9).
RESULTS
Accuracy and reaction time
Table III presents behavioral data on the word judgment and control tasks for the fMRI session. Because we were interested in the relation between activation and behavioral performance, we calculated correlation coefficients between accuracy and reaction time separately for each of the tasks. The only significant correlation was that higher accuracy was correlated with faster reaction times for the auditory rhyming task [r(12) = −0.57, P < 0.05]. Higher accuracy also tended to be correlated with faster reaction times for the visual rhyming task [r(11) = −0.33, P = 0.31]. In contrast, higher accuracy tended to be correlated with slower reaction time during the spelling tasks in both modalities [r(11) = 0.37, P = 0.26 for auditory and r(11) = 0.24, P = 0.46 for visual].
Table III.
Means and standard errors for accuracy and reaction time in the word judgment and control tasks in the visual and auditory modality
| Accuracy (%) | Reaction time (msec) | |||
|---|---|---|---|---|
| Mean | SE | Mean | SE | |
| Visual | ||||
| Spelling | 96.8 | 5.1 | 899 | 93 |
| Control | 96.7 | 5.2 | 753 | 75 |
| Rhyming | 96.5 | 5.3 | 898 | 87 |
| Control | 97.0 | 4.9 | 744 | 70 |
| Auditory | ||||
| Spelling | 91.0 | 8.3 | 1266 | 134 |
| Control | 92.1 | 7.8 | 978 | 83 |
| Rhyming | 97.5 | 4.5 | 956 | 75 |
| Control | 95.8 | 5.8 | 942 | 73 |
Accuracy was not significantly different in the experimental versus the control conditions for any of the tasks. However, t‐tests revealed that reaction time was significantly slower (P < 0.05) for the experimental versus control conditions for all but the auditory rhyming task. We calculated an additional analysis to determine if the difference between the experimental and control condition was correlated with reaction time for any of the tasks. These correlations were not significant, and, therefore, different relations between behavioral performance and reaction time for the different tasks cannot be accounted for by experimental vs. control differences between the better and poorer performers.
The Kolmogorov‐Smirnov statistic with a Lilliefors significance level was used for the testing of normality to determine whether outliers may have an influence on the correlation between performance and brain activation. This test was not significant (P > 0.10) for accuracy or reaction time for either the spelling or rhyming tasks in either the visual or auditory modality. Furthermore, accuracy and reaction time for all data points were within 2.5 SD of the mean for each task in each modality.
Brain activation during word judgment tasks
A random effects model was used to examine differences in brain activation between the word judgment and control tasks. We calculated a total of four contrasts [experimental–control], one for each word judgment task (spelling and rhyming) in each of the two modalities (visual and auditory). All reported areas of activation were significant using P < 0.001 uncorrected at the voxel level. Table IV presents the results from the statistical comparison of each word judgment task versus its control task.
Table IV.
Significant activation for the spelling and rhyming tasks in the visual and auditory modality as compared to the control tasks*
| Location | Significance | Coordinate | ||||||
|---|---|---|---|---|---|---|---|---|
| Area | H | BA | Z test | Voxels @ 0.001 | x | y | z | |
| Visual | ||||||||
| Spelling | Inferior frontal gyrus | L | 45 | 5.73 | 416 | −45 | 18 | 21 |
| Inferior frontal gyrus | R | 46 | 4.45 | 101 | 48 | 30 | 12 | |
| Fusiform gyrus | L | 19 | 5.27 | 72 | −36 | −78 | −15 | |
| Fusiform gyrus | L | 37 | 4.61 | 74 | −42 | −60 | −18 | |
| Rhyming | Angular gyrus | L | 39 | 3.79 | 21 | −27 | −51 | 36 |
| Inferior frontal gyrus | L | 45 | 5.35 | 657 | −45 | 30 | 12 | |
| Middle occipital gyrus | L | 19 | 4.42 | 99 | −18 | −90 | −3 | |
| Inferior frontal gyrus | R | 47 | 5.38 | 29 | 39 | 27 | −9 | |
| Auditory | ||||||||
| Spelling | Angular gyrus | L | 39 | 3.83 | 32 | −30 | −60 | 45 |
| Inferior frontal gyrus | L | 45 | 4.44 | 208 | −48 | 18 | 18 | |
| Superior temporal gyrus | L | 22 | 4.43 | 37 | −63 | −12 | −3 | |
| Superior temporal gyrus | R | 22 | 3.67 | 49 | 51 | −12 | −6 | |
| Fusiform gyrus | L | 37 | 4.42 | 21 | −51 | −60 | −15 | |
| Rhyming | Inferior frontal gyrus | L | 45 | 4.35 | 110 | −51 | 21 | 27 |
| Transverse temporal | R | 41 | 4.48 | 13 | 42 | −27 | 12 | |
| Superior temporal gyrus | R | 22 | 4.67 | 106 | 60 | −9 | −3 | |
| Superior temporal gyrus | L | 22 | 4.61 | 131 | −54 | −18 | −3 | |
H: left (L) or right (R) hemisphere. BA: Brodmann's area of peak activation. Coordinates: x left hemisphere, +x right hemisphere, −y behind anterior commisure, +y in front of anterior commisure, −z below anterior‐posterior commisure plane, +z above anterior‐posterior commisure plane. The coordinates represent the peak of activation as determined by a z‐test of significance. Number of voxels for P < 0.001 level of significance is indicated. Regions are sorted by z coordinate.
The spelling and rhyming tasks produced activation in unimodal and posterior heteromodal regions. Among the unimodal visual regions, all but the auditory rhyming task produced activation in left fusiform gyrus (BA 37). This activation extended into left middle occipital gyrus (BA 19) for visual spelling and visual rhyming, but not for auditory spelling (which produced relatively little activation in unimodal visual areas). Among the unimodal auditory areas, only the auditory tasks produced activation in superior temporal gyrus (BA 22) and this activation was bilateral. The auditory rhyming task produced more extensive activation among unimodal auditory areas in the left hemisphere, extending from transverse temporal gyrus (BA 41) into superior temporal gyrus (BA 42, 22). This task also produced activation in the right hemisphere from posterior superior temporal gyrus (BA 22) to anterior superior temporal gyrus (BA 38). Among posterior heteromodal regions, both the visual rhyming and auditory spelling tasks activated left angular gyrus (BA 39).
All tasks produced activation in the left inferior frontal gyrus (BA 45, 46, 9), although the visual tasks produced activation that extended more ventrally in left inferior frontal gyrus (BA 47). The visual tasks, but not the auditory tasks, also produced activation in right inferior frontal gyrus. The focus in right inferior frontal gyrus was more superior (BA 45) for visual spelling than for visual rhyming (BA 47). In general, visual tasks were the only tasks that produced activation in the right inferior frontal gyrus, although the activation in the right hemisphere even then was less extensive than that produced in the left inferior frontal gyrus.
Relation between behavioral performance and brain activation
The relation of behavior with activation was measured by correlating accuracy or reaction time with task specific brain activation separately for the spelling or rhyming tasks in the visual or auditory modality. Participants were not divided into distinct high versus low accuracy or fast versus slow reaction time. Rather, we examined the relation between behavioral performance as a continuous measure and the intensity of activation. Positive correlations indicated that greater intensity activation was associated with better performance (higher accuracy or faster reaction time) and negative correlations indicated greater intensity activation was associated with poorer performance (lower accuracy and slower reaction time).
The correlation results for the spelling and rhyming tasks in the visual modality are presented in Table V and Figure 1 and in the auditory modality are presented in Table VI and Figure 2. Figure 3 presents the overlap between the correlations for accuracy and reaction time. Unless otherwise noted, reported areas of activation are significant using P < 0.001 uncorrected at the voxel level. Trends toward significance are indicated if they reached the P < 0.01. The tables show the number of voxels that exhibited greater intensity activation at these different significance thresholds. This section confines our discussion to correlations with behavior involving the visual unimodal region (fusiform gyrus), the auditory unimodal region (superior temporal gyrus), and the posterior heteromodal region (angular and supramarginal gyri).
Table V.
Correlation of behavioral performance with activation for the visual spelling and rhyming tasks*
| Location | Significance | Coordinate | |||||||
|---|---|---|---|---|---|---|---|---|---|
| Area | H | BA | Z‐test | Voxels @ 0.01 | Voxels @ 0.001 | x | y | z | |
| Spelling | |||||||||
| High % | Inferior frontal gyrus | R | 45 | 3.25 | 70 | — | 48 | 21 | 21 |
| Inferior frontal gyrus | L | 46 | 3.26 | 40 | — | −45 | 48 | 3 | |
| Fusiform gyrus | L | 37 | 3.34 | 13 | — | −39 | −57 | −9 | |
| Inferior frontal gyrus | R | 37 | 3.47 | 31 | 6 | 30 | 30 | −15 | |
| Low % | — | — | — | — | — | — | — | — | |
| Slow RT | Superior temporal gyrus | R | 21 | 3.86 | 13 | 6 | 63 | −18 | −3 |
| Fast RT | Supramarginal gyrus | L | 40 | 3.65 | 46 | 3 | −36 | −42 | 36 |
| Inferior frontal gyrus | L | 9 | 3.63 | 43 | 8 | −39 | 6 | 27 | |
| Rhyming | |||||||||
| High % | Inferior frontal gyrus | L | 9 | 4.38 | 151 | 15 | −39 | 3 | 36 |
| Supramarginal gyrus | L | 40 | 4.15 | 123 | 21 | −51 | −45 | 24 | |
| Inferior frontal gyrus | R | 9 | 3.94 | 25 | 4 | 39 | −3 | 24 | |
| Superior temporal gyrus | R | 22 | 4.68 | 89 | 30 | 51 | −39 | 9 | |
| Superior temporal gyrus | L | 22 | 5.54 | 18 | 12 | −48 | −6 | 6 | |
| Superior temporal gyrus | R | 22 | 3.60 | 13 | 6 | 51 | −21 | −3 | |
| Low % | Fusiform gyrus | L | 37 | 5.44 | 103 | 46 | −33 | −60 | −21 |
| Slow RT | Inferior frontal gyrus | R | 46 | 3.69 | 20 | 9 | 45 | 45 | 3 |
| Fusiform gyrus | L | 37 | 3.43 | 14 | — | −45 | −51 | −18 | |
| Fast RT | Supramarginal gyrus | L | 40 | 3.28 | 21 | — | −45 | −48 | 30 |
| Superior temporal gyrus | L | 22 | 3.54 | 29 | 6 | −57 | −36 | 18 | |
A positive correlation indicated that more activation was associated with higher accuracy or faster reaction time, whereas a negative correlation indicated that more activation was associated with lower accuracy or slower reaction time. H: left (L) or right (R) hemisphere. BA: Brodmann's area of peak activation. Coordinates: −X left hemisphere, +X right hemisphere, −Y behind anterior commisure, +Y in front of anterior commisure, −Z below anterior‐posterior commisure plane, +Z above anterior‐posterior commisure plane. The coordinates represent the peak of activation as determined by a z‐test of significance. Number of voxels for P < .01 and P < 0.001 level of significance are indicated. Regions are sorted by Z coordinate. —, no significant areas of activation.
Figure 1.

Activation maps showing correlation of activation with accuracy for the spelling (1st row) and rhyming (2nd row) tasks in the visual modality. Red indicates a positive correlation, greater activation associated with higher accuracy (A: fusiform gyrus; B: supramarginal gyrus; C: superior temporal gyrus), and green indicates a negative correlation, greater activation associated with lower accuracy (D: fusiform gyrus). Letters label regions of interest in the left hemisphere significant at P < 0.001 (yellow) and P < 0.01 (cyan). The figure displays all significant activation at the P < 0.01 level for presentation purposes. See Table V for number of voxels significant at P < 0.001 level.
Table VI.
Correlation of behavioral performance with activation for the auditory spelling and rhyming tasks*
| Location | Significance | Coordinate S | |||||||
|---|---|---|---|---|---|---|---|---|---|
| Area | H | BA | Z‐test | Voxels @ 0.01 | Voxels @ 0.001 | x | y | z | |
| Spelling | |||||||||
| High % | Supramarginal gyrus | L | 40 | 3.68 | 69 | 11 | −30 | −48 | 42 |
| Angular gyrus | L | 39 | 4.02 | 31 | 12 | −51 | −63 | 12 | |
| Fusiform gyrus | L | 37 | 3.28 | 21 | — | −30 | −51 | −6 | |
| Low % | Superior temporal gyrus | R | 42 | 3.31 | 38 | — | 63 | −15 | 12 |
| Superior temporal gyrus | L | 42 | 5.10 | 84 | 29 | −60 | −21 | 9 | |
| Superior temporal gyrus | R | 22 | 3.50 | 14 | — | 66 | −33 | 3 | |
| Slow RT | Supramarginal gyrus | L | 40 | 3.25 | 13 | 3 | −51 | −39 | 45 |
| Angular gyrus | R | 39 | 3.39 | 15 | 3 | 36 | −63 | 39 | |
| Supramarginal gyrus | L | 40 | 5.01 | 157 | 28 | −36 | −30 | 36 | |
| Inferior frontal gyrus | L | 46 | 4.41 | 334 | 46 | −33 | 30 | 12 | |
| Inferior frontal gyrus | R | 47 | 3.58 | 25 | 6 | 33 | 21 | −6 | |
| Fusiform gyrus | L | 37 | 4.90 | 93 | 46 | −51 | −48 | −9 | |
| Fast RT | — | — | — | — | — | — | — | — | |
| Rhyming | |||||||||
| High % | Superior temporal gyrus | L | 22 | 3.93 | 76 | 27 | −51 | −24 | −3 |
| Low % | — | — | — | — | — | — | — | — | |
| Slow RT | Superior temporal gyrus | R | 42 | 3.48 | 21 | 4 | 45 | −21 | 15 |
| Superior temporal gyrus | L | 22 | 3.66 | 30 | 10 | −39 | −48 | 12 | |
| Fast RT | Inferior frontal gyrus | L | 45 | 4.20 | 49 | 18 | −51 | 24 | 9 |
| Superior temporal gyrus | L | 22 | 3.28 | 45 | — | −48 | −36 | 3 | |
| Superior temporal gyrus | R | 22 | 4.98 | 27 | 18 | 51 | 3 | −15 | |
A positive correlation indicated that more activation was associated with higher accuracy or faster reaction time, whereas a negative correlation indicated that more activation was associated with lower accuracy or slower reaction time. H: left (L) or right (R) hemisphere. BA: Brodmann's area of peak activation. Coordinates: −x left hemisphere, +x right hemisphere, −y behind anterior commisure, +y in front of anterior commisure, −z below anterior– posterior commisure plane, +z above anterior‐posterior commisure plane. The coordinates represent the peak of activation as determined by a Z‐test of significance. Number of voxels for P < 0.01 and P < 0.001 level of significance are indicated. Regions are sorted by z coordinate. —, no significant areas of activation.
Figure 2.

Activation maps showing correlation of activation with accuracy for spelling (1st row) and rhyming (2nd row) in the auditory modality. Red indicates a positive correlation, greater activation associated with higher accuracy (A: supramarginal gyrus; B: angular gyrus; C: fusiform gyrus; D: superior temporal gyrus), and green indicates a negative correlation, greater activation associated with lower accuracy (E: superior temporal gyrus). Letters label regions of interest in the left hemisphere significant at P < 0.001 (yellow) and P < 0.01 (cyan). The figure displays all significant activation at the P < 0.01 level for presentation purposes. See Table VI for number of voxels significant at P < 0.001 level.
Figure 3.

Overlap of activation (blue) between accuracy and reaction time for auditory spelling (1st row), auditory rhyming (2nd row, left) and visual rhyming (2nd row, right). The positive correlation for accuracy (higher accuracy correlation represented in red) overlaps with the positive correlation for reaction time (slower reaction time correlation represented in green) for auditory spelling (A: angular gyrus; B: fusiform gyrus). The positive correlation for higher accuracy (red) also overlaps with the negative correlation for reaction time (faster reaction time correlation represented in green) for auditory and visual rhyming (C: superior temporal gyrus). Letters label regions of interest in the left hemisphere significant at P < 0.001 (yellow) and P < 0.01 (cyan). The figure displays all significant activation at the P < 0.01 level for presentation purposes. (See Tables V and VI for number of voxels significant at P < 0.001 level.)
Scatterplots were also computed between signal intensity and behavioral performance so that we could confirm that individual subjects were not driving the SPM maps. For each task, data from each individual was entered into a statistical model to distinguish between experimental and control conditions. The model was specified as in the original analysis, but the default threshold for preliminary identification of potentially activated voxels was removed. This was necessary to ensure that no data was excluded that might have failed to meet a threshold difference between experimental and baseline conditions. A contrast of (1 0) was then computed for each individual to identify the mean signal during the subject's experimental condition while excluding the signal during the baseline condition. The signal intensity is relative to the mean global signal across all subjects performing this task with the total intensity range scaled to 100. Individual data in the figures are presented relative to the median plus or minus 50. The signal intensity for voxels within our regions of interest with peak activation levels as determined by the SPM maps was then plotted against behavioral performance (see Figs. 4, 5, 6, 7).
Figure 4.
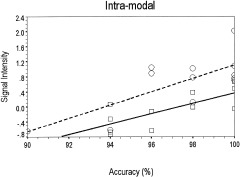
Positive correlations between accuracy and signal intensity for the intramodal tasks. Percent of variance (r2) explained is indicated for the auditory rhyming task for the left superior temporal gyrus (LSTG; ‐51,‐24,‐3) and for the visual spelling task in the left fusiform gyrus (LFG: ‐39,‐57,‐9). Dashed line and open circles, rhyming, LSTG (Rsq = 0.5406); solid line and open squares, spelling LFG (Rsq = 0.5557).
Figure 5.

Positive correlations between accuracy and signal intensity for the cross‐modal auditory spelling task. Percent of variance (r2) explained is indicated for the left fusiform gyrus (LFG: ‐30,‐51,‐6), the left angular gyrus (LAG; ‐51,‐63,12) and the left supramarginal gyrus (LSG; ‐30,‐48,42). Dashed line and diamonds, LFG (Rsq = 0.4409); solid lines and circles, LAG (Rsq = 0.8326); Dotted line and squares, LSG (Rsq = 0.3428).
Figure 6.

Positive correlations between accuracy and signal intensity for the cross‐modal visual rhyming task. Percent of variance (r2) explained is indicated for the left superior temporal gyrus (LSTG: ‐48,‐6,6), the right superior temporal gyrus (RSTG; 51,‐39,9) and the left supramarginal gyrus (LSG; ‐57,‐36,18). Dashed line and diamonds, LSTG (Rsq = 0.4660); Dotted line and circles, RSTG (Rsq = 0.7215); solid line and squares, LSG (Rsq = 0.6903).
Figure 7.

Negative correlations between accuracy and signal intensity for the cross‐modal tasks. Percent of variance (r2) explained is indicated for the visual rhyming task for the left fusiform gyrus (LFG: ‐33,‐60,‐21), and for the auditory spelling task for the left superior temporal gyrus (LSTG; ‐60,‐21,9) and the right superior temporal gyrus (RSTG; 63,‐15,12). Dotted line and diamonds, rhyming, LFG (Rsq = 0.0894); solid line and circles, spelling, LSTG (Rsq = 0.5779); dotted line and square, Spelling, RSTG (Rsq = 0.4913).
For the intramodal visual spelling task, higher accuracy was associated with more activation in fusiform gyrus (P < 0.01). For the intramodal auditory rhyming task, higher accuracy was associated with more activation in superior temporal gyrus. As reviewed earlier, for the behavioral analyses, higher accuracy was associated with faster reaction time for the auditory rhyming task. This correlation for behavior was paralleled by an overlap in activation in superior temporal gyrus associated with higher accuracy and faster reaction time (P < 0.01 for reaction time). For both intramodal tasks, there were no negative correlations for accuracy, showing that lower accuracy was not associated with more activation in our regions of interest.
For the cross‐modal auditory spelling task, higher accuracy was associated with more activation in fusiform gyrus (P < 0.01) and in both the angular and supramarginal gyri. In contrast to the rhyming tasks, there was a significant positive behavioral correlation between accuracy and reaction time for auditory spelling: higher accuracy was associated with slower reaction time. This correlation for behavior was paralleled by an overlap in activation in the supramarginal and fusiform gyri associated with higher accuracy and slower reaction time.
For the cross‐modal visual rhyming task, higher accuracy was correlated with more activation in supramarginal gyrus and bilateral superior temporal gyrus. However, an examination of the scatterplots shows that the correlation for the left superior temporal gyrus was primarily due to a low accuracy data point. As reviewed above in the behavioral analyses, there was a trend for higher accuracy to be associated with faster reaction time. This correlation for behavior was paralleled by an overlap in activation in left superior temporal gyrus associated with higher accuracy and faster reaction time.
Lower accuracy was associated with more activation for the cross‐modal tasks in the brain regions associated with processing the modality of input. Specifically, lower accuracy was associated with more activation in fusiform gyrus during visual rhyming and with more activation in superior temporal gyrus during auditory spelling. However, an examination of the scatterplots indicates that the negative correlation between performance and activation in the fusiform gyrus during visual rhyming was primarlily due to a low accuracy data point.
DISCUSSION
In keeping with numerous prior clinical and experimental observations, we found that spoken words activated the auditory association cortex of the superior temporal gyrus; that written words activated the visual association cortex of the fusiform gyrus; and that cross‐modal conversions between written and spoken words activated the heteromodal cortices of the supramarginal and angular gyri [Binder et al., 1994; Damasio and Damasio, 1983; Fujimaki et al., 1999; Giraud and Price, 2001; Herbster et al., 1997; Howard et al., 1992; Mesulam, 1998; Nobre et al, 1994; Petersen et al., 1990]. The primary goal of this study was to examine the relation between these activation sites and performance on intramodal and cross‐modal lexical tasks.
For intramodal tasks, we found that higher accuracy was associated with greater activation in unimodal regions corresponding to the modality of input, namely in the fusiform gyrus for the visual spelling task and in the superior temporal gyrus for the auditory rhyming task. These results suggest that efficient intramodal processing is associated with more activation in brain regions responsible for processing the modality of input. The relationship between performance on auditory tasks and activity in the auditory cortex has been demonstrated in several contexts. In animals, the nature and amount of auditory input can influence the organization of auditory cortex [Kilgard and Merzenich, 1998]. In humans, experience in playing a musical instrument is associated with more activation in auditory cortex when listening to piano tones, especially in musicians who learned music at an early age [Pantev et al., 1998]. Similar relationships exist between visual tasks and the visual association cortices of the inferior temporal regions. In monkeys, training in pattern or object discrimination changes neuronal responses in inferior temporal visual areas [Desimone, 1996; Kobatake et al., 1998; Tanaka, 2000]. In humans, increased activation in the occipito‐temporal areas is associated with better performance in naming pictures of objects [Grill‐Spector et al., 2000] and with skilled mirror reading [Dong et al., 2000; Poldrack et al., 1998; Poldrack and Gabrieli, 2001]. Our results are, therefore, consistent with a considerable body of evidence showing that experience and performance in intramodal auditory and visual tasks influence the activation patterns in unimodal cortices.
For cross‐modal tasks, we found that higher accuracy was associated with greater activation in the posterior heteromodal regions of the language network, presumably because these areas played pivotal roles in converting between orthography and phonology. Our results are neutral on the mechanisms involved in the conversion between orthography and phonology, and, therefore, our findings are consistent both with dual route models of reading [Coltheart et al., 1993, 2001], which suggest that conversion occurs through grapheme–phoneme correspondence rules and with connectionist networks [Plaut et al., 1996; Seidenberg and McClelland, 1989], which suggest that the mapping between these systems involves extracting statistical regularities through hidden units. We also showed that better performance in these cross‐modal tasks was associated with more activation in unimodal regions representing the target of the cross‐modal conversion, namely in the superior temporal gyrus for the visual rhyming task and in the fusiform gyrus for the auditory spelling task. Together, these findings suggest that better performance was associated with greater activation of the neurocognitive processing route required for accurately completing the task. Specifically, better performance was dependent on the participant's ability to activate an imaginary cross‐modal representation of the lexical input, presumably through the mediation of the posterior heteromodal association cortex that linked the input to its target representation.
For the visual rhyming task, higher accuracy and faster reaction times were associated with greater activation in posterior heteromodal and auditory association areas. This correlation is consistent with research showing that skilled readers automatically access phonological word forms when reading [Booth et al., 1999; Lukatela and Turvey, 1994; VanOrden, 1987]. In contrast, the auditory spelling task showed that higher accuracy and slower reaction times were associated with greater activation of the posterior heteromodal and visual association cortices, suggesting that accuracy in tasks based on a conversion from phonology to orthography may require a slowing down of processing, in keeping with the well‐known observation that spelling is more laborious than reading [Bosman and VanOrden, 1997]. The difference in the relation between behavioral performance and patterns of activation for the two cross‐modal tasks may result from the quasi‐regular nature of English [Plaut et al., 1996] as the mapping from sound to spelling is more inconsistent than the mapping from spelling to sound [Ziegler et al., 1997]. At the level of the rime in English, for example, there are many different ways to spell a word given a spoken input (e.g., ade, aid; ome, oam; etc.), whereas there are fewer ways to pronounce a word given written input. In fact, about 75% of words in English have multiple spellings, but only about 25% of words in English have multiple pronunciations at the level of the rime.
We found that poorer performance on the auditory spelling task was associated with more activation in bilateral superior temporal gyri. This could reflect an excessive emphasis on the perceptual properties of the lexical input, in a way that may interfere with the compilation and analysis of cross‐modal representations. Basing a judgment on a detailed analysis of the phonological form will produce an incorrect answer in the auditory spelling task because words that rhyme can be spelled differently (e.g., grade, laid). Therefore, inaccurate performance on the cross‐modal tasks may result from over‐reliance on the unimodal regions for processing the modality of input. Although the correlation seemed to be particularly influenced by one individual, we found that poorer performance on the visual rhyming task was associated with more activation in left fusiform gyrus. As with the auditory spelling task, basing a judgment on a detailed analysis of the orthographic form in the visual rhyming task will produce an incorrect answer because words that are spelled differently can rhyme. Many studies show that adults are less accurate and slower at making rhyming judgment for orthographically dissimilar words [Crossman and Polich, 1988; Levinthal and Hornung, 1992; Polich et al., 1983].
Our results point to a complex relation between behavioral performance and magnitude of activation in the left inferior frontal gyrus. Higher accuracies were associated with greater activation for both the visual spelling and visual rhyming tasks. Faster reaction times were associated with greater activation for both intramodal tasks (visual spelling and auditory rhyming). As with the posterior heteromodal and unimodal regions discussed earlier, slower reaction times were associated with greater activation for the auditory spelling task in the left inferior frontal gyrus. In a recent review of the literature, Poldrack et al. [1999] suggested that the dorsal and posterior region of the inferior frontal gyrus is associated with phonological processing, whereas the ventral and anterior portion of the inferior frontal gyrus is associated with semantic processing [Poldrack et al., 1999]. Consistent with this, we found that behavioral performance in our spelling and rhyming tasks was most often associated with activation in dorsal regions including Brodmann's areas 46 and 9. In general, the left inferior gyrus seems to show greater activation for more difficult tasks. Studies have shown more activation for compressed compared to uncompressed speech [Poldrack et al., 2001], for pseudowords compared to words [Fiebach et al., 2002; Fiez et al., 1999; Hagoort et al., 1999; Herbster et al., 1997; Mechelli, 2000; Xu et al., 2001], for low compared to high‐frequency words [Fiebach et al., 2002; Fiez et al., 1999], and for irregular compared to regular words [Fiez et al., 1999; Herbster et al., 1997].
In conclusion, this study demonstrated a complex relationship between performance parameters in lexical tasks and activation patterns within unimodal and cross‐modal components of the language network. Better performance in intramodal tasks was associated with greater activation in the corresponding unimodal association cortices whereas better performance in cross‐modal tasks was associated with greater activation in heteromodal cortices and the unimodal areas of the target of the conversion process. These patterns of results suggest that accurate performance is associated with the effective recruitment of the neurocognitive processing routes required by the particular lexical task.
Acknowledgements
We thank Sarah Brennan, Yasu Harasaki, and Frank Van Santen for their assistance in stimulus development, and Kristin Bettenhausen, Jean Rex, and Cheryl Wolf for their assistance in conducting the behavioral study. We thank Nirmal Christian, Paul Springer, and Robert Salzman for their operation of the MRI. We thank the students, teachers, and administrators at Pope John XXIII School, Saint Athanasius School, and Saint Peter's Catholic School for their participation in the behavioral study. We thank Orrington School and Chiaravalle Montessori School for allowing us to distribute consent forms to their students. Finally, we thank the participants in the fMRI study for their time and commitment to research.
REFERENCES
- Aizenstein HJ, MacDonald AW, Stenger VA, Nebes RD, Larson JK, Ursu S, Carter CS (2000): Complementary category learning systems identified using event‐related functional MRI. J Cognit Neurosci 12: 977–987. [DOI] [PubMed] [Google Scholar]
- Baayen RH, Piepenbrock R, Gulikers L (1995): The CELEX Lexical Database (v. 2) [CD‐ROM]. Philadelphia, PA: Linguistic Data Consortium , University of Pennsylvania. [Google Scholar]
- Binder JR, Rao SM, Hammeke TA, Yetkin FZ, Jesmanowicz A, Bandertini PA, Wong EC, Estkowski LD, Goldstein MD, Haughton VM, Hyde JS (1994): Functional magnetic resonance imaging of human auditory cortex. Ann Neurol 35: 662–672. [DOI] [PubMed] [Google Scholar]
- Booth JR, Perfetti CA, MacWhinney B (1999): Quick, automatic, and general activation of orthographic and phonological representations in young readers. Dev Psychol 35: 3–19. [DOI] [PubMed] [Google Scholar]
- Booth JR, Burman DD, Van Santen FW, Harasaki Y, Gitelman DR, Parrish TR, Mesulam MM (2001): The development of specialized brain systems in reading and oral‐language. Child Neuropsychol 7: 119–141. [DOI] [PubMed] [Google Scholar]
- Booth JR, Burman DD, Meyer JR, Gitelman DR, Parrish TR, Mesulam MM (2002a): Functional anatomy of intra‐ and cross‐modal lexical tasks. NeuroImage 16: 7–22. [DOI] [PubMed] [Google Scholar]
- Booth JR, Burman DD, Meyer JR, Gitelman DR, Parrish TR, Mesulam MM (2002b): Modality independence of word comprehension. Hum Brain Mapp 16: 251–261. [DOI] [PMC free article] [PubMed] [Google Scholar]
- Bosman AMT, Van Orden GC (1997): Why spelling is more difficult than reading In: Perfetti CA, Reiben L, Fayol M, editors. Learning to spell. Hillsdale, NJ: Lawrence Erlbaum Associates; p 173–194. [Google Scholar]
- Bowey JA (1990): Orthographic onsets and rimes as functional units of reading. Mem Cognit 18: 419–427. [DOI] [PubMed] [Google Scholar]
- Buechel C, Coull JT, Friston KJ (1999): The predictive value of changes in effective connectivity for human learning. Science 283: 1538–1541. [DOI] [PubMed] [Google Scholar]
- Caplan D, Alpert N, Waters G (1998): Effects of syntactic structure and propositional number on patterns of regional cerebral blood flow. J Cognit Neurosci 10: 541–552. [DOI] [PubMed] [Google Scholar]
- Carpenter PA, Just MA, Keller TA, Eddy W, Thulborn K (1999): Graded functional activation in the visuo‐spatial system with the amount of task demand. J Cognit Neurosci 11: 9–24. [DOI] [PubMed] [Google Scholar]
- Coltheart M, Curtis B, Atkins P, Haller M (1993): Models of reading aloud: Dual route and parallel distributed processing approaches. Psychol Rev 100: 589–608. [Google Scholar]
- Coltheart M, Rastle K, Perry C, Langdon R, Ziegler J (2001): DRC: A dual route cascaded model of visual word recognition and reading aloud. Psychol Rev 108: 204–256. [DOI] [PubMed] [Google Scholar]
- Crossman DL, Polich J (1988): Hemispheric differences for orthographic and phonological processing. Brain Lang 35: 301–302. [DOI] [PubMed] [Google Scholar]
- Damasio AR, Damasio H (1983): The anatomical basis of pure alexia. Neurology 33: 1573–1583. [DOI] [PubMed] [Google Scholar]
- Desimone R (1996): Neural mechanisms for visual memory and their role in attention. Proc Natl Acad Sci USA 93: 13494–13499. [DOI] [PMC free article] [PubMed] [Google Scholar]
- Dong Y, Fukuyama H, Honda M, Okada T, Hanakawa T, Nakamura K, Nagahama Y, Nagamine T, Konishi J, Shibasaki H (2000): Essential role of the right superior parietal cortex in Japanese kana mirror reading: an fMRI study. Brain 123: 790–799. [DOI] [PubMed] [Google Scholar]
- Fiebach C, Friederici AD, Mueller K, von Cramon DY (2002): fMRI evidence for dual routes to the mental lexicon in visual word recognition. J Cognit Neurosci 14: 11–23. [DOI] [PubMed] [Google Scholar]
- Fiez JA, Balota DA, Raichle ME, Petersen SE (1999): Effects of lexicality, frequency, and spelling‐to‐sound consistency on the functional anatomy of reading. Neuron 24: 205–218. [DOI] [PubMed] [Google Scholar]
- Fletcher P, Buechel C, Josephs O, Friston K, Dolan R (1999): Learning‐related neuronal responses in prefrontal cortex studied with functional neuroimaging. Cereb Cortex 9: 168–178. [DOI] [PubMed] [Google Scholar]
- Flowers DL, Wood FB, Naylor E (1991): Regional cerebral blood flow correlates of language processes in reading disability. Arch Neurol 48: 637–643. [DOI] [PubMed] [Google Scholar]
- Friston KJ, Jezzard P, Turner R (1994): Analysis of functional MRI times‐series. Hum Brain Mapp 1: 153–171. [Google Scholar]
- Friston KJ, Ashburner J, Frith CD, Poline JB, Heather JD, Frackowiak RSJ (1995a): Spatial registration and normalization of images. Hum Brain Mapp 2: 1–25. [Google Scholar]
- Friston KJ, Holmes AP, Poline JB, Grasby PJ, Williams SCR, Frackowiak RSJ, Turner R (1995b): Statistical parametric maps in functional imaging: A general linear approach. Hum Brain Mapp 2: 189–210. [Google Scholar]
- Fujimaki N, Miyauchi S, Puetz B, Sasaki Y, Takino R, Sakai K, Tamada T (1999): Functional magnetic resonance imaging of neural activity related to orthographic, phonological, and lexico‐semantic judgments of visually presented characters and words. Hum Brain Mapp 8: 44–59. [DOI] [PMC free article] [PubMed] [Google Scholar]
- Giraud AL, Price C (2001): The contraints functional neuroimaging places on classical models of auditory word processing. J Cognit Neurosci 13: 754–765. [DOI] [PubMed] [Google Scholar]
- Grill‐Spector K, Kushnir T, Hendler T, Malach R (2000): The dynamics of object‐selective activation correlate with recognition performance in humans. Nature Neurosci 3: 837–843. [DOI] [PubMed] [Google Scholar]
- Hagoort P, Indefrey P, Brown C, Herzog H, Steinmetz H, Seitz RJ (1999): The neural circuitry involved in the reading of German words and pseudowords: A PET study. J Cognit Neurosci 11: 383–398. [DOI] [PubMed] [Google Scholar]
- Herbster AN, Mintun MA, Nebes RD, Becker JT (1997). Regional cerebral blood flow during word and nonword reading. Hum Brain Mapp 5: 84–92. [DOI] [PubMed] [Google Scholar]
- Honey GD, Bullmore ET, Sharma T (2000): Prolonged reaction time to a verbal working memory task predicts increased power of posterior parietal cortical activation. Neuroimage 12: 495–503. [DOI] [PubMed] [Google Scholar]
- Howard D, Patterson K, Wise R, Brown WD, Friston K, Weiller C, Frackowiak R (1992): The cortical localization of the lexicons: Positron emission tomography evidence. Brain 115: 1769–1782. [DOI] [PubMed] [Google Scholar]
- Just MA, Carpenter PA, Keller TA, Eddy WF, Thulborn KR (1996): Brain activation modulated by sentence comprehension. Science 274: 114–116. [DOI] [PubMed] [Google Scholar]
- Kareken DA, Lowe M, Chen SHA, Lurito J, Mathews V (2000): Word rhyming as a probe of hemispheric language dominance with functional magnetic resonance imaging. Neuropsychiat Neuropsychol Behav Neurol 13: 264–270. [PubMed] [Google Scholar]
- Kilgard MP, Merzenich MM (1998): Plasticity of temporal information processing in auditory cortex. Nature Neurosci 1: 727–731. [DOI] [PMC free article] [PubMed] [Google Scholar]
- Kobatake E, Wang G, Tanaka K (1998): Effects of shape‐discrimination training on the selectivity of inferotemporal cells in adult monkeys. J Neurophysiol 80: 324–330. [DOI] [PubMed] [Google Scholar]
- Levinthal CF, Hornung M (1992): Orthographic and phonological coding during visual word matching as related to reading and spelling abilities in college students. Read Writ 4: 1–20. [Google Scholar]
- Lukatela G, Turvey MT (1994): Visual lexical access is initially phonological: 1. Evidence from associative priming by words, homophones, and pseudohomophones. J Exp Psychol 123: 107–128. [DOI] [PubMed] [Google Scholar]
- Lurito JT, Kareken DA, Lowe MJ, Chen SHA, Mathews VP (2000): Comparison of rhyming and word generation with FMRI. Hum Brain Mapp 10: 99–106. [DOI] [PMC free article] [PubMed] [Google Scholar]
- Mechelli A (2000): The effects of presentation rate during word and pseudoword reading: a comparison of PET and fMRI. J Cognit Neurosci 12 (Suppl 2): 145–156. [DOI] [PubMed] [Google Scholar]
- Mesulam MM (1990): Large‐scale neurocognitive networks and distributed processing for attention, memory, and language. Ann Neurol 28: 597–613. [DOI] [PubMed] [Google Scholar]
- Mesulam MM (1998) From sensation to cognition. Brain 121: 1013–1052. [DOI] [PubMed] [Google Scholar]
- Mesulam MM (2000): Behavioral neuroanatomy: Large‐scale networks, association cortex, frontal syndromes, the limbic system, and hemispheric specialization In: Mesulam MM, editor. Principles of behavioral and cognitive neurology, 2nd ed. New York: Oxford University Press; p 1–120. [Google Scholar]
- Mesulam MM (2002): The human frontal lobes: Transcending the default mode through contigent encoding In: Stuss DT, Knight RT, editors. Principles of frontal lobe function. New York: Oxford University Press; p 8–30. [Google Scholar]
- Ng VW, Bullmore ET, de Zubicaray GI, Cooper A, Suckling J, Williams SC (2001): Identifying rate‐limiting nodes in large‐scale cortical networks for visuospatial processing: an illustration using fMRI. J Cognit Neurosci 13: 537–545. [DOI] [PubMed] [Google Scholar]
- Nobre AC, Allison T, McCarthy G (1994): Word recognition in the human inferior termporal lobe. Nature 372: 260–263. [DOI] [PubMed] [Google Scholar]
- Pantev C, Oostenveld R, Engelien A, Ross B, Roberts LE, Hoke M (1998): Increased auditory cortical representation in musicians. Nature 392: 811–814. [DOI] [PubMed] [Google Scholar]
- Petersen SE, Fox PT, Snyder AZ, Raichle ME (1990): Activation of extrastriate and frontal cortical areas by visual words and word‐like stimuli. Science 249: 1041–1044. [DOI] [PubMed] [Google Scholar]
- Plaut DC, McClelland JL, Seidenberg MS, Patterson K (1996): Understanding normal and impaired word reading: Computational principles in quasi regular domains. Psychol Rev 103: 56–115. [DOI] [PubMed] [Google Scholar]
- Poldrack RA, Gabrieli JDE (2001): Characterizing the neural mechanisms of skill learning and repetition priming. Evidence from mirror‐reading. Brain 124: 67–82. [DOI] [PubMed] [Google Scholar]
- Poldrack RA, Desmond JE, Glover GH, Gabrieli JD (1998): The neural basis of visual skill learning: an fMRI study of mirror reading. Cereb Cortex 8: 1–10. [DOI] [PubMed] [Google Scholar]
- Poldrack RA, Temple E, Protopapas A, Nagarajan S, Tallal P, Merzenich M, Gabrieli JD (2001): Relations between the neural bases of dynamic auditory processing and phonological processing: evidence from fMRI. J Cognit Neurosci 13: 687–697. [DOI] [PubMed] [Google Scholar]
- Poldrack RA, Wagner AD, Prull MW, Desmond JE, Glover GH, Gabrieli JD (1999): Functional specialization for semantic and phonological processing in the left inferior prefrontal cortex. Neuroimage 10: 15–35. [DOI] [PubMed] [Google Scholar]
- Polich J, McCarthy G, Wang WS, Donchin E (1983): When words collide: orthographic and phonological interference during word processing. Biol Psychol 16: 155–180. [DOI] [PubMed] [Google Scholar]
- Pugh KR, Shaywitz BA, Shaywitz SE, Constable RT, Skudlarski P, Fulbright RK, Bronen RA, Shankweiler DP, Katz L, Fletcher JM, Gore JC (1996): Cerebral organization of component processes in reading. Brain 119: 1221–1238. [DOI] [PubMed] [Google Scholar]
- Raichle ME, Fiez JA, Videen TO, MacLeod AK, Pardo JV, Fox PT, Petersen SE (1994): Practice‐related changes in human brain functional anatomy during non‐motor learning. Cereb Cortex 4: 8–26. [DOI] [PubMed] [Google Scholar]
- Ramnani N, Toni I, Josephs O, Ashburner J, Passingham RE (2000): Learning‐ and expectation‐related changes in the human brain during motor learning. J Neurophysiol 84: 3026–3035. [DOI] [PubMed] [Google Scholar]
- Rauch SL, Whalen PJ, Savage CR, Curran T, Kendrick A, Brown HD, Bush G, Breiter HC, Rosen BR (1997): Striatal recruitment during an implicit sequence learning task as measured by functional magnetic resonance imaging. Hum Brain Mapp 5: 124–132. [PubMed] [Google Scholar]
- Rosenberg DR, Sweeney JA, Gillen JS, Chang SY, Varanelli MJ, O'Hearn K, Erb PA, Davis D, Thulborn KR (1997): Magnetic resonance imaging of children without sedation: preparation with simulation. J Am Acad Child Adolesc Psychiat 36: 853–859. [DOI] [PubMed] [Google Scholar]
- Sakai K, Hikosaka O, Miyauchi S, Takino R, Sasaki Y, Puetz B (1998): Transition of brain activation from frontal to parietal areas in visuomotor sequence learning. J Neurosci 18: 1827–1840. [DOI] [PMC free article] [PubMed] [Google Scholar]
- Seger CA, Poldrack RA, Prabhakaran V, Zhao M, Glover GH, Gabrieli JDE (2000): Hemispheric asymmetries and individual differences in visual concept learning as measured by functional MRI. Neuropsychologia 38: 1316–1324. [DOI] [PubMed] [Google Scholar]
- Seidenberg MS, McClelland JL (1989): A distributed developmental model of word recognition and naming. Psychol Rev 96: 523–568. [DOI] [PubMed] [Google Scholar]
- Talairach J, Tournoux P (1988): Co‐planar stereotaxic atlas of the human brain. New York: Thieme. [Google Scholar]
- Tanaka K (2000): Mechanisms of visual object recognition studied in monkeys. Spatial Vision 13: 147–163. [DOI] [PubMed] [Google Scholar]
- Tokunaga H, Nishikawa T, Ikejiri Y, Nakagawa Y, Yasuno F, Hashikawa K, Nishimura T, Sugita Y, Takeda M (1999): Different neural substrates for Kanji and Kana writing: a PET study. Neuroreport 10: 3315–3319. [DOI] [PubMed] [Google Scholar]
- VanOrden GC (1987): A ROWS is a ROSE: spelling, sound, and reading. Mem Cognit 15: 181–198. [DOI] [PubMed] [Google Scholar]
- Xu B, Grafman J, Gaillard WD, Ishii K, Vega‐Bermudez F, Pietrini P, Reeves‐Tyer P, DiCamillo P, Theodore W (2001): Conjoint and extended neural networks for the computation of speech codes: The neural basis of selective impairment in reading words and pseudowords. Cereb Cortex 11: 267–277. [DOI] [PubMed] [Google Scholar]
- Ziegler JC, Stone GO, Jacobs AM (1997): What is the pronunciation for ‐ough and the spelling for /u/? A database for computing feedforward and feedback consistency in English. Behav Res Methods Instrum Comput, 29: 600–618. [Google Scholar]