

Abstract
Somatosensory discrimination of cuboid objects was studied in a group of healthy volunteers and patients with Parkinson's disease using regional cerebral blood flow (rCBF) measurements obtained with positron emission tomography (PET) and 15O labeled water [H2 15O]. A 6‐[18F]‐fluoro‐L‐dopa (FDOPA) PET scan demonstrated that the patients may be grouped into those with normal and those with abnormally low FDOPA uptake in the caudate nucleus. The categorical group comparisons revealed that task‐induced rCBF increases were deficient in bilateral motor and sensory cortical areas in the Parkinson patients. Moreover, deficient rCBF increases were evident in the mesial and right dorsolateral prefrontal cortex for patients in a more advanced disease state, who showed low FDOPA uptake in the caudate nucleus. A principal component analysis (PCA), performed on the rCBF data, identified three patterns (principal components, PCs) that differentiated patients from normals. The first PC represented a right‐hemisphere dominant, bilateral group of brain areas known to be involved in tactile exploration. A second PC reflected a cortical‐subcortical pattern of functional interactions, comprising cortical areas important for working memory processes. The third group‐differentiating PC revealed a pattern of functional interactions involving bilateral temporo‐parieto‐occipital association cortices, which was consistent with a hypothesized supramodal network necessary for object discrimination. In an additional subgroup analysis, greater expression of the third PC pattern predicted greater caudate FDOPA uptake in patients. Our neuroimaging data revealed a disturbance of distinct patterns of brain functional interactions related to the sensorimotor deficit in Parkinson's disease and to deficits of cognitive information processing deficits in the more advanced stage of Parkinson's disease. Hum. Brain Mapping 11:131–145, 2000. © 2000 Wiley‐Liss, Inc.
Keywords: somatosensory discrimination, rCBF positron emission tomography (PET), 6‐[18F]‐fluoro‐L‐dopa (FDOPA) PET, categorical comparisons, principal component analysis, tactile exploration, working memory, supramodal information transfer
INTRODUCTION
Somatosensory discrimination of shape represents a manual skill acquired in early infancy and later integrated into daily activities [Ruff, 1984; Ledermann and Klatzky, 1987]. It is also a natural task that is most suitable for laboratory testing including PET [Roland and Mortensen 1987, Seitz et al., 1991]. The motor activity of this task can be assessed accurately because the kinematics of shape discrimination have been characterized by Seitz et al. [1991] and Kunesch et al. [1989]. Similarly, sampling of somatosensory information by tactile exploration has been described and elaborated in a model of sensory information processing [Roland and Mortensen, 1987]. Finally, the cognitive ability to compare the extracted information as well as to discriminate among the objects has been shown recently to be quantitatively measurable [Weder et al., 1998]. Hence, in addition to explicit motor‐related processes, higher‐order information processing functions can be assessed separately during sensorimotor discrimination.
The brain regions involved in sensorimotorrelated information processing have been identified using functional neuroimaging techniques to measure regional cerebral blood flow (rCBF) in normal subjects during performance of the aforementioned task [Boecker et al., 1996; Seitz et al., 1991]. The normal pattern of activation involves both cortical (e.g., primary motor, premotor, SMA, somatosensory, superior parietal cortex) and subcortical (e.g., cerebellum, putamen) regions. Deviations from this normal pattern were found in patients who had recovered motor function following striatocapsular and cortical infarctions. Observed in the patients were reduced activations in cortical areas, enhanced premotor activations, and abnormal contralesional activations [Weder et al., 1994; Weder and Seitz, 1994; Seitz et al., 1998]. This abnormal functional pattern was considered to reflect a recovery‐related reorganization of pathways that subserve sensorimotor processing.
Parkinson's disease is fundamentally a motor‐related disorder [Marsden, 1982]. Recently we reported an impairment of somatosensory discrimination abilities in a group of Parkinson's patients [Weder et al., 1998]. The progression of dopaminergic degenerative processes in Parkinson's disease appears to be characterized by a temporally dependent disorder of subcortical structures. That is, dopamine metabolism within the putamen is affected in the early stages of the disease, while abnormalities involving the caudate nucleus occur later, and with less regularity [Nahmias et al., 1985; Leenders et al., 1990]. Both structures function as relay nodes for cortical‐subcortical circuits, including sensorimotor and dorsolateral‐prefrontal loops [Alexander et al., 1986]. Thus, disruption of and mutual interference between distinct subcortical and cortical areas have been suggested to occur during the course of Parkinson's disease [Stam et al., 1993]. This suggests that specific cortical‐subcortical networks presumed to subserve somatosensory discrimination may be dysfunctional in Parkinson's disease.
As is now widely acknowledged, functionally related changes in the complex networks of the human brain cannot be assessed by categorical comparisons of functional imaging data [Buechel and Friston, 1997; Jobson, 1992; Friston et al., 1995]. Thus, a variety of complementary statistical methods have been utilized to assess distributed changes in patterns of brain activation [Horwitz et al., 1991; McIntosh and Gonzalez‐Lima, 1991; Friston et al., 1993a, 1993b]. Included among such methods are those requiring a priori modeling assumptions—such as path analysis [Buechel and Friston, 1997; Friston et al., 1993a; McIntosh et al., 1994]—and those that are fundamentally exploratory in nature—such as principal component analysis (PCA) [Alexander and Moeller, 1994; Friston et al., 1993b; Azari et al., 1999; Seitz et al., 1999]. Both approaches have contributed substantially to studies of disease‐related changes in patterns of functional connectivity. A recent path analysis of PET‐rCBF data in Parkinson's disease patients defined a disease‐specific functional network of connectivity between the thalamus and mesial frontal motor areas and indicated additionally that the changes thereof were related to disease severity [Grafton et al., 1994].
The aim of the current project was to examine the pattern of regional cerebral activations associated with the performance of a somatosensory discrimination task in Parkinson's disease. We hypothesized that segregated networks of cortical areas and distinct subcortical relay nodes related to motor, tactile, and somatosensory discrimination, respectively, would be substantially different in Parkinson's patients than those in healthy normal individuals. Further, we predicted that those patients in the later stages of the disease—those demonstrating the most severe abnormalities in subcortical dopamine metabolism—should show the most profound deficits in sensorimotor discrimination abilities, as well as a corresponding and distinctly abnormal pattern of cerebral activations. Because we did not want to restrict analysis of the PET‐rCBF data with a priori assumptions, we supplemented a categorical analysis of the imaging data with a PCA. In order to determine the stage of the disease in Parkinson patients, we evaluated 6‐[18F]‐fluoro‐L‐dopa (FDOPA) tracer metabolism in the basal ganglia of the patients.
SUBJECTS AND METHODS
Subjects
Subjects consisted of 12 patients with Parkinson's disease (4 F, 8 M; age range: 41–66) and 12 healthy adults (6 F, 6 M; age range: 32–64). Magnetic resonance (MR) images of the brain were normal for all subjects, and dementia was excluded by the Mini Mental Status Scale (individual scores > 26) [Folstein et al., 1975]. Participants were right‐handed, as assessed by the Edinburgh Handedness Inventory [Oldfield, 1971]. They were informed of the purpose of the study and written informed consent was obtained in accordance with guidelines of the Declaration of Human Rights, Helsinki, 1975. The study was approved by the Ethics Committee of the Kantonsspital St. Gallen.
The healthy adult volunteers were free of neurological, psychiatric, and medical disorders. All patients had been treated with L‐dopa (average daily dosage: 733 mg) and responded to levodopa therapy. The therapy was supplemented in five cases with bromocriptine (average daily dosage: 8 mg). We applied selected diagnostic criteria for Parkinsonism according to Quinn and Husain [1986]: asymmetrical onset, no atypical features and no possible etiology for another Parkinson syndrome, in order to enhance specificity [Hughes et al., 1992]. Patients were assessed using the 4‐component Unified Parkinson's Disease Rating Scale (UPDRS) [Martinez‐Martin et al., 1994]. The total UPDRS score of the patients as a group was 41.1 ±14.7 (Mean + SD, maximum possible: 147). Specific clinical manifestations of the disease resulted in increased mean scores in the four components of the UPDRS. Detailed clinical data on the patients are shown in Table I.
Table I.
Clinical data of patients†
| Group | Duration of disease1 (mean ± SD yrs) | UPDRS‐Score2 | FDOPA‐uptake (Kc)3 | |||||
|---|---|---|---|---|---|---|---|---|
| Total | I | II | III | IV | Putamen | Nc.caud. | ||
| (mean ± SD) | (mean ± SD) | |||||||
| All patients (N = 12) | 7.7 ± 4.1 | 36.7 ± 19.3 | 2.6 ± 1.7 | 15.7 ± 7.6 | 16.5 ± 6.0 | 6.3 ± 5.4 | 0. 00437 ± 0. 00188 | 0. 00729 ± 0. 00178 |
| Subgroup A (N = 5) | 4.6 ± 2.2 | 19.0 ± 10.5 | 1.6 ± 1.7 | 9.8 ± 3.8 | 15.6 ± 4.7 | 2.6 ± 5.0 | 0. 00544 ± 0. 00243 | 0. 00905 ± 0. 00072 |
| Subgroup B (N = 7) | 9.9* ± 4.4 | 49.3* ± 12.7 | 3.3 ± 1.4 | 19.9* ± 6.9 | 17.1 ± 7.1 | 19.0* ± 4.9 | 0. 00366 ± 0. 00105 | 0. 00639* ± 0. 00104 |
| Normals (N = 12) | 0. 00967 ± 0. 00078 | 0. 01135 ± 0. 00115 | ||||||
Comparison of subgroups A an B, *indicates significant differences in the unpaired, two‐tailed t‐test.
Duration of disease: P < .05.
Unified Parkinson's disease rating scale, total: P < .01; 4 components: (I) Mentation, behavior and mood; (II) Activities of daily living: P < .05; (III) Motor examination; (IV) Complications of therapy: P < .05.
FDOPA‐uptake in the caudate nucleus: P < .001.
Methods
Stimulation paradigm
Subjects were scanned using PET twice: while lying quietly on the scanner bed with eyes closed (REST) and during performance of a somatosensory discrimination task (SSD). Details of the tactile discrimination task have been published previously [Roland and Mortensen, 1987; Seitz et al., 1991]. In brief, subjects were sequentially presented with cuboids in an alternative forced‐choice paradigm. They were instructed to evaluate the objects by exploratory finger movements of the right hand only, during which time their eyes were covered with cotton wool pads. The objects varied only in oblongness [Roland, 1975]. Differences of the major axes ranged from 0.44 to 5.01 mm, and the square bases varied from 0.17 to 1 mm. Subjects were asked to determine, by tactile manipulation, which of two sequentially examined objects was the most oblong. They were instructed to indicate whether the second object was more oblong by extending the thumb of the right hand. If the second object was not judged to be the more oblong of the pair, the subject was required to stop exploration in order to receive the first object of the next pair. The exploration strategy was freely chosen. Finger movements and the subjects' responses were videotaped for later evaluation. On the day of the PET scan, early morning medication was withheld from the patients. On average, medication was withdrawn for 15.7 hr (range: 14 to 18).
rCBF PET scanning
The subjects rested supine on the bed of the PET scanner. The head of each subject was fixed by an individually moulded head holder. For tracer application, a plastic catheter was placed into the left brachial vein. Eyes were covered by cotton wool pads, and speech was prohibited. Scans were performed using the SIEMENS‐CTI ECAT 933‐04/16 PET‐camera (Siemens Knoxville, Tennessee), which allows the simultaneous recording of seven transverse slices of the brain with a spatial resolution of 8 mm within and between planes. Planes were aligned parallel to the orbito‐meatal line. Cranial and caudal slices were obtained separately by longitudinal translation of the bed and fused after consecutive acquisition into a single data set of 14 contiguous slices, which covered the brain from the dorsal part of the motor cortex down to the cerebellar nuclei. After transmission scans at each of the two positions, the rCBF scans were performed as detailed in the following: the synthesis of radiowater was carried out according to the guidelines described by Welch et al. [1969]. Following an intravenous bolus injection of 5 ml of saline containing 20–30 mCi of oxygen‐15‐labeled water (H2 15O), rCBF was calculated from the emission scan and blood data acquired during the first 90 sec after arrival of radioactivity in the brain, as indicated by a sudden increase in the bank pair coincidence counting rate of the PET system [Lammertsma et al., 1990]. Subjects began the task exactly 60 sec before injection of the tracer. The initial time for the study was always the actual time tracer administration commenced. Arterial blood samples were drawn continuously via an indwelling intra‐arterial line in the radial artery and lead through a plasma coincidence detector system placed next to the gantry. These samples were weighted and counted in a well counter to obtain 15O activity as cps/g blood, corrected for physical decay from the time of injection to the time of measurement. Planes were reconstructed using filtered back projection with a Hann filter (0.5 Nyquist) resulting in a spatial resolution of 8 mm full width at half maximum (FWHM) between and within planes. A total of six scans were acquired for each subject: one data set consisting of 14 consecutive slices for the resting condition (REST) and two data sets for the activation condition (SSD). The two activation scans were later averaged for further data analysis. The order of conditions was pseudorandomized.
FDOPA‐uptake PET scanning
The FDOPA‐uptake PET scan was performed within 1 month after the rCBF PET scan. Since high amino‐acid levels may influence FDOPA uptake [Leenders et al., 1985], subjects were fasting before examination, and levodopa therapy and dopaminergic agents were withheld from the patients overnight prior to the scan. One hr before tracer examination, subjects were given a single oral dose of 150 mg Carbidopa to inhibit peripheral decarboxylation. FDOPA was delivered as an intravenous bolus of 4–5 mCi (150–190 MBq). Brain FDOPA uptake was measured with PET over a period of 2 hr. Conditions during data acquisition were identical to those of the rCBF PET scan. The head was positioned such that the basal ganglia were in the centre of the field of view of the camera.
Data analysis
SSD task performance
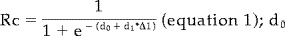
Motor aspects of the SSD task performance were recorded on video during the rCBF‐PET scanning session. The video recordings yielded the rate of finger movements, rate of object discrimination, and exploration time of the object in the hand. Since the SSD task possesses a binomial design (right answer = 1, wrong answer = 0), we used a Bernoulli model and calculated the necessary parameters from the sample. Task performance for each subject and major axis was expressed as the ratio between the number of correct responses to the total number of trials at that major axis difference. The observations in normals and patients were each approximated to a normal distribution for each difference, from which a 95% confidence interval could be determined. Logistic regression was used to describe the relationship between the proportion of correct discriminations, Rc, and the differences in major axis of the cuboids (Δl)1 [Weder et al., 1998]. The regression curves indicated an Rc of 0.5 in the case of equal major axes (i.e., chance response) and approached asymptotically the value of 1.0 as the difference in major axes within a pair increased. Above the critical threshold of approximately 2 mm of major axis difference, the proportion of correct discriminations Rc in normal subjects reaches 0.75 [Weder et al., 1998]. The regression coefficient obtained, d1, described the relation between Rc and the differences between the objects examined in the task. One index was calculated for each subject. Since the discrimination index, d1, provided an estimate of conscious perception in an individual, it was taken as a sensitive measure of the non‐motor, information processing aspects of SSD task performance [Weder et al., 1998]. The video data, proportion of correct answers for tasks in which the major axis difference exceeded the critical threshold of 2 mm, and discrimination index d1 are summarized in Table II according to patient groups and normal subjects. They constituted the basis for pairwise comparisions, for which P < 0.05 served as the level of significance.
Table II.
External behavioural measures
| Group | Thumb movement/sec (mean ± SD) | Discrimination frequency (pairs/min) | Exploration time per pair (sec) (mean ± SD) | Right answer proportion (95% C.I.) | Coefficient d1 (mean ± SD) |
|---|---|---|---|---|---|
| All patients (N = 12) | 1.4 ± 0.28* | 5.4 ± 1.7 | 8.4 ± 3.8 | 0.79 (0.75–0.83)** | 0.39 ± 0.22* |
| Subgroup A (N = 5) | 1.3 ± 0.23* | 5.3 ± 1.5 | 8.8 ± 2.8 | 0.85 (0.78–0.90)**/& | 0.51 ± 0.17 |
| Subgroup B (N = 7) | 1.5 ± 0.28* | 5.6 ± 1.8 | 8.2 ± 4.6 | 0.75 (0.70–0.81)**, $ | 0.30 ± 0.22*** |
| Normals (N = 12) | 2.1 ± 0.4 | 6.2 ± 1.7 | 7.6 ± 3.1 | 0.95 (0.93–0.96)&& | 0.67 ± 0.19 |
Comparison of normal volunteers and patients at *P < .01 and
at ***P < .001 (unpaired, two‐tailed t‐test)
Comparison of normal volunteers and patients at **P < .001 (z‐approximation) with respect to object differences above the critical threshold;
and significant impairment of subgroup B compared to subgroup A at $P < .05
SSD performance significantly different from threshold score of 0.75 at && < .0001 and
at & < .05 by one sample t‐test.
rCBF PET—spatial normalization
The rCBF images were spatially standardised as detailed elsewhere [Seitz et al., 1990; Weder et al., 1994] using the Computerized Brain Atlas (CBA) program [Thurfjell et al., 1995]. Standardization yields 21 axial image slices consisting of matrices of 128 × 128 voxels, each of 2.55 × 2.55 × 6.43 mm. It is accurate within 3 mm for the brain surface. Coordinates of the CBA can be translated into the stereotaxic space of Talairach [1988], as the spatial dimensions of the atlas standard brain and the orientation of its intercommissural line have been determined.
rCBF PET—categorical comparisons
The spatially standardised scans, obtained at rest and during somatosensory discrimination, were normalized by proportional scaling to a global CBF of 50 ml/100g/min. This procedure reduces intersubject variability of the image data and has been shown to be useful for PET image analysis [Mcintosh et al., 1996] of H2O studies. rCBF differences between rest and activation states were analyzed by testing pixel by pixel the hypothesis of a mean difference in paired design. The activation states of the patient group and subgroups (see below) were compared pixel by pixel with those of normal volunteers using the hypothesis test for the difference between independent means. Activations were thresholded at uncorrected t‐values corresponding to P < 0.01 and corrected using cluster analysis to account for the resolution of the PET camera [Wunderlich et al., 1997]. Significant activations were localized with the data bank of the computerized brain atlas system (CBA) mentioned above [Greitz et al., 1990; Thurfjell et al., 1995] and superimposed onto a standardized MR‐imaging atlas.
rCBF PET—principal component analysis (PCA)
A PCA was applied to the rCBF data of the patients and controls after a double normalization across groups and conditions [Alexander and Moeller, 1994; Azari et al., 1999; Seitz et al., 1999]. That is, residual variance was decomposed into orthogonal PCAs after subtraction of individual image and global voxel means. This procedure equalizes both for subject and scan effects. Specifically, the PCAs were calculated on a voxel basis and overall individuals and conditions, since we were interested in differences with respect to the SSD task. Subject scores were used to test the hypothesis that the functional patterns (i.e., PCs) were differentially expressed between groups and conditions (t‐tests, significance P < 0.05). Thus, t‐tests reflect the separation of the study population into clusters. The study design was explorative, i.e., without a priori restrictions. Note that because we were especially interested in Parkinson disease‐related brain functional abnormalities, only those PCs that revealed group differences between normal volunteers and patients were considered for further analysis. Brain areas constituting the group‐differentiating PCs were identified by the PC‐loading factor, as the PC‐load represented the correlation of each brain voxel with a PC. PC loadings were displayed on a pseudocolor scale allowing for the localization of coactivating regions in stereotaxic coordinates. In these images each of the PC loadings was thresholded at |0.5|, which allowed the PC pattern to merge with the anatomy of high‐resolution MR images. Coordinates indicated in Tables III and IV correspond to the centre of gravity of the delineated regions with high correlation to a given PC.
Table III.
Significant abnormalities in rCBF‐increases for Parkinson patients
| All patients (N = 12) | Side(s) | Coordinates1 | Comparison to controls |
|---|---|---|---|
| Motor hand area | left | −44/−18/45 | − |
| Sensory hand area | left | −47/−27/44 | − |
| G. frontalis med. | both sides | 30/0/53 and −28/0/53 | − |
| G. frontalis sup. | both sides | 5/2/53 and −4/3/53 | − |
| Lob. parietalis sup. | both sides | 32/−41/44 and −30/−55/43 | − |
| Nc. dentatus | left | −11/−55/−21 | + |
| Lob. semilunaris | right | 29/−80/−22 | + |
| G. occipitotemp. lat. | right | 13/−81/−6 | + |
| Subgroup B (N = 7) | |||
| Dorso‐lat. prefrontal2 | right | 31/30/29 | − |
| Mesial frontal | both sides | 0/35/29 | − |
Stereotaxic coordinates according to Talairach and Tournoux (1988).
Brodmann area 46 and 9.
Table IV.
Groups differentiating principal components (PCs)
| PC | Core areas anatomical name | Coordinates1 | PC loads | Group differences2 | Suggested functional correlate, brain system, pattern | |
|---|---|---|---|---|---|---|
| Right | Left | |||||
| PC1 | Motor hand area | 36/−16/51 | + | Norm‐rest vs. patients‐rest (P < .05) | Sensorimotor control | |
| Sensory hand area | 31/−32/50 | + | ||||
| Premotor area | 36/0/46 | + | ||||
| Suppl. motor area | 7/4/53 | + | ||||
| Lobulus parietalis superior | 30/−56/49 | −22/−58/48 | + | |||
| Precuneus | 8/−52/43 | −4/−45/43 | + | |||
| Parietal operculum | −45/−24/19 | + | ||||
| Posterior cingulate gyrus | −1/−35/37 | + | ||||
| Uncus gyri hippocampi | 12/−2/−25 | −17/−7/−25 | − | |||
| Semilunar lobulus | 29/−70/−28 | −24/−71/−28 | − | |||
| PC7 | Dorsolateral prefrontal | 46/23/22 | + | Norm‐act vs. patients‐act (P < .02) | Working memory | |
| Mesial frontal | 1/45/23 | + | ||||
| Medial temporal gyrus | 50/−56/6 | + | ||||
| Insular cortex | 46/−9/12 | + | ||||
| Med. occipito‐temporal g. | −5/−80/5 | + | ||||
| Thalamus, medial‐dorsal | 2/−14/8 | + | ||||
| Superior occipital gyrus | 18/−74/6 | − | ||||
| PC11 | Posterior cingulate gyrus | −5/−64/11 | + | Patients‐rest vs. norm‐rest (P < .02) | Comparative feature discrimination | |
| Angular gyrus | −60/−55/−6 | + | Patients‐act vs. norm‐act (P < .01) | |||
| Med. occipito‐temporal g. | 8/−92/−1 | + | Subgroup A‐rest vs. norm‐rest (P < .02) | |||
| Superior temporal gyrus | 60/−42/7 | − | Subgroup A‐act vs. norm‐act (P < .01) | |||
| Medial frontal gyrus | 32/18/34 | − | ||||
| Superior temporal gyrus | −52/−24/1 | − | ||||
| Nucleus ruber | 2/−26/−3 | − | ||||
Acc. to Talairach and Tournoux (1988).
Normal volunteers in rest and activation state, norm‐rest and norm‐act; patients in rest and activation state, patients‐rest and patients‐act; patients with normal FDOPA uptake in caudate nucleus, subgroup A; groups with higher expression of PC were indicated first.
FDOPA uptake
A graphical analysis method using a ROI in the occipital lobe as a reference region yielded the FDOPA‐uptake rate constants, Kc, for the caudate nucleus and putamen as slopes of tissue slope‐intercept plots between 30 and 90 min [Antonini et al., 1995; Patlak and Blasberg, 1985]. Twelve normal volunteers (age range: 50–60) provided reference ranges of uptake values for the caudate nucleus: 0. 0086–0. 0128 and for the putamen: 0. 0082– 0.011, which defined the crucial lower limits.
Results
FDOPA uptake
Table I summarizes the clinical profile of the Parkinson patients as well as the FDOPA‐uptake values. As a group, the patients showed significantly decreased mean FDOPA‐uptake rate constants in both the caudate (P < 0. 0001; unpaired, two‐tailed t‐test) and putamen (P < 0. 0001) compared to normals. FDOPA uptake in the caudate nucleus distinguished two subgroups of patients: subgroup A, demonstrating uptake in the lower range of normal volunteers, and subgroup B, showing abnormally low uptake. Uptake in the putamen was abnormally low in both subgroups; no individual rate constant occurred in the normal range. The reduction relative to subgroup A evident in subgroup B is not significant. Additional features of subgroup B were duration of disease and UPDRS scores. Disease duration was significantly longer in subgroup B: an average of 9.9 years vs. 4.6 years, and subgroup B was more severely impaired than subgroup A according to total UPDRS‐score and its components: activities of daily living and complications of therapy.
The subgroups consist of five subjects with normal and seven subjects with low uptake in the caudate nucleus. Accordingly, we assigned Fisher indicators of ‐7/12 and 5/12, respectively, to the members of a subgroup. Analysis of the indicators yielded the results detailed in the footnote2. Thus, the FDOPA uptake in the caudate nucleus, KcCN, had an essential influence on the hypothesized categorization, whereas the effect of the putamen uptake was weak. The FDOPA uptake in the caudate nucleus support a simple linear regression function for the calculation of the Fisher indicator (Find): Find = 1.83 ‐ 250.98 * KcCN. The exclusion of a possible outlier did not alter the results significantly.
Finally, we performed quality control of subgroup measurements, i.e., statistical process control, in order to assess the significance of FDOPA uptake in the caudate nucleus compared to the other subgroup differences listed in Table I: duration of disease and components II and IV of the UPDRS‐scale. Calculating Xbar subgroup mean charts [Abacus Concepts, 1996], we showed that only the subgroup means for FDOPA uptake in the caudate nucleus, both of subgroup A and B, exceeded the 3σ‐confidence limit. A conservative estimate of the probability that at least one of two subgroup means will exceed the control limits of the four factors tested is P 0. 0027*2 ≈ 0.005. From this point of view, FDOPA uptake in the caudate had the most important grouping effect in the obtained external measures.
SSD task performance
Table 2 shows that, consistent with earlier experiments, the Parkinson patients demonstrated slower thumb movements than the normal subjects. However, the frequency of thumb movements implied that motor behavior was identical in the patients subgroups. Of all the pairs of parallelepipeds tested, the total number of correct discriminations was 63% in the patients and 73% in the normal volunteers. Most important, dedicated statistical testing [Weder et al., 1998, 1999] evidenced no age effects on the somatosensory discrimination performance in these groups of subjects. The exploration rate per pair of objects fell in the same range for all groups and subgroups. Thus, differences in the exposition times of the cuboids caused no decision bias. The conditions were also identical regarding the exposition time of object 1 and object 2. Analysis of the SSD results by partitioning showed that performance in consecutive sessions differed only by chance (see also Weder et al., 1998).
Groups and subgroups differed significantly from each other in the proportion of right answers according to the z‐test for proportions. Furthermore, for differences exceeding the critical threshold of 2 mm in the major axis [Weder et al., 1998], the normal volunteers and subgroup A achieved proportions of right answers, Rc, exceeding 0.75 with probabilities P ≤ 0.001 and ≤ 0.05, respectively, using one sample analysis. In contrast, subgroup B recognized these differences only at a threshold level. Thus, information was perceived explicitly only by the normal volunteers and, to a lesser degree, by subgroup A, but not by subgroup B. This deficit is also reflected by a severely low index d1 in subgroup B (Table II).
rCBF PET—categorical comparisons
Table III and Figures 1 and 2 show that increases of rCBF activation in several areas were significantly decreased in patients relative to normal subjects. Specifically, the patients demonstrated deficient activation in the sensorimotor cortex contralateral to the exploring right hand, in the premotor area (G. frontalis med.), the supplementary motor area (SMA: G. frontalis sup.), and bilaterally in the parietal lobule. Bilateral activation in the putamen was slightly, but insignificantly, diminished. In contrast, the patients showed stronger activations in the right occipito‐temporal gyrus, left dentate nucleus, and right lobulus semilunaris. In addition, the patients of subgroup B with abnormally low FDOPA uptake in the caudate showed deficient activation of the right dorsolateral prefrontal and bilateral mesial frontal cortices with respect to subgroup A.
Figure 1.
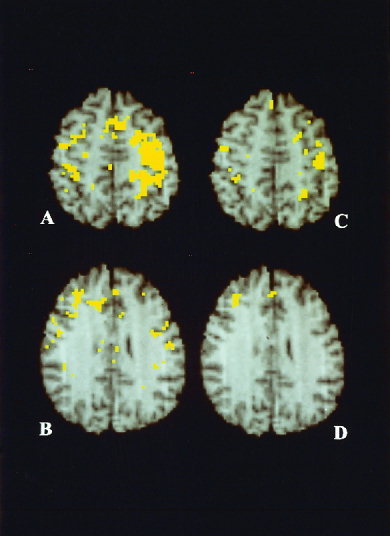
Integrated PET/MR‐images showing the anatomical location of significant mean rCBF increases in normal volunteers (hypothesis test for the mean difference in paired design; A, B), and the deficient activations in the patients with Parkinson's disease in relation to normals (hypothesis test for the difference between independent means; C, D). Activations in normal volunteers involved motor and sensory hand area, contralateral to the exploring hand, premotor cortex, supplementary motor area, superior parietal lobulus, on both sides (A) and right dorsolateral prefrontal cortex (B). Deficient activations in the Parkinson patients were at sensorimotor cortices on both sides (C), and in the Parkinson subgroup B in the right dorsolateral prefrontal and the mesial frontal cortex (D). Anatomical details are given by T1‐weighted, high resolution MR‐images of the atlas standard brain. View is from below so that the right hemisphere is seen on the left. Thresholding and correction by cluster analysis, see method section, i.e., rCBF PET—categorical comparison.
Figure 2.
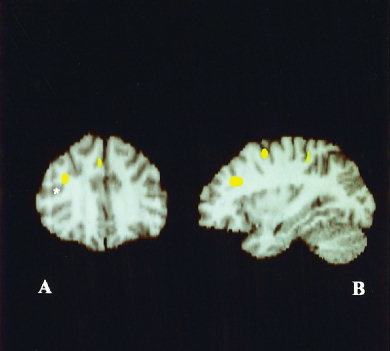
Deficient activations in Parkinson subgroup B affecting right dorsolateral prefrontal cortex (A,B) and mesial frontal cortex (A) as delimited in coronal and sagittal reconstructions. Note location of inferior frontal sulcus (indicated by an asterisk).
rCBF PET—principal component analysis (PCA)
A total of 12 PCs explained 70% of the variance in the data. Patients differed significantly from normals in PC1 (12% of the variance), PC7 (4.7%), and PC11 (3.1%) as assessed by uncorrected t‐tests detailed in Table IV. Figure 3 summarizes the PCA group‐differentiating patterns. The functional pattern exhibited by PC1 differentiated normal volunteers from patients in the REST condition (Figure 3A,B). Table IV shows the dominant constituent brain regions of PC1. Brain areas showing positive load values include cortical regions known to participate in tactile exploration such as the motor hand area and premotor cortex. In general, there was greater right‐ than left‐hemisphere involvement in the PC1 pattern; the greater participation of the right‐hemisphere is evident in Figure 3A. The left hippocampal gyrus, and bilateral inferior and superior semilunar lobulus at the cerebellar level, showed negative loadings.
Figure 3.

Interrelated areas of PC1, PC7, and PC11, thresholded at PC‐loading 0.5 and integrated in high resolution MR‐images of the CBA. The constituent brain areas of PC1 were sensorimotor cortices, predominantly of the right hemisphere, lobulus parietalis superior and precuneus of both hemispheres (A), and the retro‐insular/parietal operculum complex of the left hemisphere (B). Right dorsolateral prefrontal cortex, mesial frontal cortex (C), and medio‐dorsal thalamus (D) were identified as the constituent areas of PC7. Constituent brain areas of PC11 were posterior cingulate cortex (E) and left posterior angular sector (F).
The PC7 pattern differentiated normal volunteers from patients in the SSD task condition (Figure 3C, D). As shown in Table 4, the dominant constituent regions and corresponding load values for PC7 described predominantly positive cortical‐subcortical functional interrelations (e.g., right dorsolateral prefrontal with right medio‐dorsal thalamus). A negative loading was obtained only for a right superior occipital area. Note that the caudate nucleus was not identified as a constituent area of the PC7 pattern.
The pattern PC11 distinguished normal volunteers from patients in both the REST and SSD task conditions (Figure 3E,F). Additional subgroup analysis revealed that this group separation was mainly due to high expression of PC11 by subgroup A. Dominant constituent brain areas of PC11 presented positive loads in left angular gyrus, right medial occipito‐temporal gyrus and negative loads in the left superior temporal gyrus, right medial frontal gyrus (Table IV).
DISCUSSION
Somatosensory discrimination impairment
Consistent with our prior studies, we demonstrate here that somatosensory discrimination was significantly impaired in patients with Parkinson's disease compared to normal volunteers. We also report that during performance of the somatosensory discrimination (SSD) task, the Parkinson patients showed deficient rCBF activations in the sensorimotor cortex, contralateral to the exploring hand, bilaterally in the premotor area (G. frontalis med.), in the supplementary motor area (SMA: G. frontalis sup.) and in the parietal lobule, and abnormally increased activation in the cerebellum. Further, those patients with low levels of FDOPA uptake in the caudate nucleus showed additional activation deficits in the prefrontal cortex. A principal component analysis (PCA) of the rCBF data revealed three principal components (PCs) that differentiated the patients from normal subjects. We associate with each PC a pattern of functional interaction in the brain. The systems characterized by these three group‐differentiating patterns may correspond to three processes hypothesized to subserve somatosensory discrimination which are disrupted in Parkinson's disease, namely, explicit tactile information sampling [Curran and Keele, 1993], working memory [Baddeley, 1986; Goldmann‐Rakic, 1989], and final shape discrimination [Roland, 1993].
Motor behaviour of the patients was characterized by reduced motor speed, as shown by the reduced movement rate of the thumb. Thus, information sampling and consecutive data processing were impaired in the Parkinson patients, which is characteristic for this disorder [Marsden, 1982]. We suggest that this impaired motor component correspond to the observed deficient activation in the sensorimotor cortex of the patients (Table III). However, in Parkinson's disease, adequacy of motor behaviour may not be judged exclusively according to movement frequency. In fact, individuals with milder disease explored the cuboids with slightly slower movements (Table II), but it cannot be excluded that the spatial accuracy of their movements was better adapted to the task requirements of somatosensory discrimination [Teasdale et al., 1990]. Conversely, the reported overactivation of the lateral premotor and inferior parietal association cortex in Parkinson's disease indicated an orchestrated involvement of the lateral premotor‐parietal cortex circuitry for demanding sequential and bilateral movements [Samuel et al., 1997]. The abnormally increased activation in the posterior cerebellum of the patients may be related to compensatory mechanisms of adapting to impaired performance of exploration. The cerebellum has been shown to play an important role in motor learning and is overactive in Parkinson's disease [Friston et al., 1992; Rascol et al., 1997].
Abnormal FDOPA uptake in caudate nucleus
The two subgroups of Parkinson patients in this study were classified on the basis of differential FDOPA uptake in the caudate nucleus: subgroup A exhibiting normal uptake and subgroup B abnormally low uptake. In contrast, these two subgroups did not show differing FDOPA uptake in the putamen. Both Nahmias et al. [1985] and Leenders et al. [1990] have reported on the later involvement of the caudate during the advanced evolution of the dopaminergic degenerative process in Parkinson's disease. We cannot exclude minor changes in the caudate nucleus in subgroup A patients; however, they were in rather early stages of the disease and their uptake fell within the range of normal volunteers. Subgroup B patients with low caudate FDOPA uptake were in more advanced stages of Parkinson's disease, as evidenced by their considerably longer disease duration and the higher UPDRS scores (Table I). The two subgroups of patients had identical motor behaviour during performance of the somatosensory discrimination task as revealed by analysis of movements of the thumb, the most active and important finger in tactile exploration [Seitz et al., 1991]. Yet the subgroup B patients performed more poorly on the nonmotor, discriminative aspects of the task (Table II). Others have demonstrated that patients with lesions restricted to primary motor, supplementary motor, and premotor areas show disturbances in exploratory finger movements but not in shape discrimination [Freund, 1987; Roland, 1987]. Indeed, in addition to explicit motor‐related sequential sampling of the objects, somatosensory discrimination is presumed to require focused attention as a precondition for working memory processes [Roland and Mortensen, 1987; Seitz et al., 1991]. That is, subjects must attend to the object explored as well as retain and retrieve information about the object subsequent to sequential sampling in order to make a final discrimination. Given our current findings, we suggest that these cognitive deficits may be characteristic of later stages of Parkinson's disease. We thereby substantiate an earlier study in which we showed that low FDOPA uptake in the caudate nucleus was associated with impaired somatosensory discrimination in advanced Parkinson's disease [Weder et al., 1999].
Since the separation of our Parkinson's disease cohort into two subgroups was so crucial to this study and represented a finding per se, we reevaluated this categorization into normal and low‐uptake groups. In addition to the categorical comparison, we performed discriminant analysis based on Fisher weights to permit exploration using regression functions. It became evident that the hypothesized clustering depended exclusively on FDOPA uptake in the caudate nucleus, whereas the influence of uptake in the putamen was negligible. From a neuropathological point of view, motor deficits do not become manifest clinically until 70–90% of dopaminergic neurons in the putamen have been denervated [Agid et al., 1987], implying the long‐lasting asymptomatic course of Parkinson's disease. Accordingly, a relatively preserved FDOPA uptake in the caudate nucleus might permit prolonged compensation of nonmotor, i.e., neurocognitive, deficits in Parkinson's disease. In this cross‐sectional study, the subgroups evidenced a qualitative decline during the progressive degenerative process rather than a continuum of mild to severe disease. Thus, we feel there was a firm neurobiological basis to analyse the patients as distinct subgroups.
The fact that the two patient subgroups, i.e., those with normal and those with low caudate FDOPA uptake, demonstrated differential performance on the SSD task suggests that the caudate plays an important role in somatosensory object discrimination. The head of the caudate nucleus is a relay node of a dorsolateral prefrontal cortical‐subcortical circuit [Alexander et al., 1986]. Thus, the dorsolateral prefrontal cortex is functionally vulnerable to caudate abnormalities. A multitude of functions has been associated with activation of the granular prefrontal cortex including information recognition and retrieval, cognitive learning [Roland, 1993], and high‐level planning [Owen et al., 1996]. An additional such function is reportedly working memory, responsible for holding spatial information on‐line [Baddeley, 1986; Goldmann‐Rakic, 1989]. Functional impairments involving the dorsolateral prefrontal cortex are likely, therefore, to disrupt information processing related to working memory [Fletcher et al., 1997]. Since, as we discussed above, the sensorimotor impairment was identical in the two patient subgroups, the observed somatosensory discrimination deficits in the subgroup with low FDOPA uptake was probably due to abnormal outflow from the caudate nucleus to prefrontal cortex [Doyon et al., 1998].
Deficient right prefrontal activation
The hypothesis is supported by our current results that show a deficient prefrontal cortical activation selective for the right hemisphere in the Parkinson patient subgroup B (Table III). Recent studies suggest that the prefrontal cortex of the right hemisphere is specialized for information retrieval from episodic memory, while the left hemisphere subserves feature encoding [Fletcher et al., 1997]. Using PET, Pardo et al. [1991] distinguished a system for sustained attention in the right prefrontal (Brodmann area 9 and 46) and parietal cortex. Additionally, some evidence suggests that the right prefrontal cortex is involved in the monitoring and verification of retrieved information [Wilding et al., 1996; Allan et al., 1997; Bentin et al., 1992; Schacter et al., 1996]. Although our data do not allow definitive resolution of this issue, we submit that the cognitive functions thought to be subserved specifically by the right prefrontal cortex are involved in somatosensory discrimination. This proposal would explain our observation that poorer SSD task performance was associated with greater activation deficits in the right rather than the left prefrontal cortex for the Parkinson patients with low FDOPA uptake in the caudate. In contrast, healthy volunteers and patients who recovered from hemiparetic stroke show prominent activation of the prefrontal cortex during somatosensory discrimination [Seitz et al., 1991, 1998; Weder et al., 1994]. In summary, the categorical comparisons of our imaging data provide evidence that functional interactions involving the caudate and the prefrontal cortex define a brain system needed for somatosensory discrimination and disrupted in Parkinson's disease.
Abnormal functional networks
Categorical comparisons of functional imaging data, however, do not explicitly assess patterns of functional connectivity in the brain [Buechel and Friston, 1997; Jobson, 1992; Friston et al., 1995]. In contrast, applications of complementary analyses of variance to functional imaging data have demonstrated disease‐induced, system‐specific abnormalities in brain functional patterns [Alexander and Moeller, 1994; Azari et al., 1996; Grafton et al., 1994]. One such technique is principal component analysis (PCA) [Alexander and Moeller, 1994; Friston et al., 1993b; Azari et al., 1999; Seitz et al., 1999], which is able to identify disease‐related changes in patterns of functional connectivity without restrictive a priori assumptions [Friston et al., 1995]. In terms of functional connectivity, a principal component represents a distributed brain system within which there are high intercorrelations among brain areas. Because PCs are orthogonal, the associated patterns may represent mutually independent functional systems [Friston et al., 1995]. The PCA applied to our image data identified three patterns that discriminated between the Parkinson patients and normal subjects.
The first PC—PC1—distinguishing patients from controls represented functional interactions among brain areas known to be involved in finger movement activity, including tactile exploration. More specifically, motor‐related areas including bilateral sensorimotor, premotor, and SMA cortices as well as areas needed for somatosensory information processing were major, positively correlated constituents of PC1. These areas reportedly participate in normal sensorimotor processing during the performance of tactile exploration [Boecker et al., 1996; Seitz et al., 1991]. The PC1 pattern also evidenced positive loadings, i.e. positive correlation, of the medial part of the parietal region, i.e. the precuneus (Brodmann area 7) and the posterior cingulate cortex (Brodmann area 31). These two areas appear to participate in explicit information retrieval [Grasby et al., 1993; Fletcher et al., 1995]. The functional significance of the left secondary sensory area (S II) to the PC1 pattern is consistent with electrophysiological and recent neuroimaging data, which suggest its role in identifying intrinsic object characteristics through modality specific attention [Binkofski et al., 1999; Hsiao et al., 1993; Ledberg et al., 1995; Sinclair et al., 1993]. The left hippocampal formation and bilateral cerebellar cortex also contributed to the PC1 pattern, but with negative loadings. Participation of the hippocampus is possibly related to the suggestion that items used in the task are not stored in long‐term memory during somatosensory discrimination [Roland and Mortensen, 1987]. Emergence of the cerebellum might follow from its function as error detector [Schmahmann et al., 1996]; the reduced cerebellar processing observed during skilled movements in normal volunteers [Friston et al., 1992; Raichle et al., 1994; Seitz and Roland, 1992] was no longer valid in our patients (Table III). Interestingly, although the PC1 pattern manifested a bilateral functional system, the right hemisphere is clearly preponderant, as Figure 3 shows. Other PET studies have revealed a similar dominance of activation fields in a motor sequence encoding task, provided that the individuals were explicitly aware of the sequences [Hazeltine et al., 1997; Rauch et al., 1995; Seitz et al., 1992]. Results from lesion studies suggest an integrating function of the right hemisphere in data processing [De Renzi et al., 1971]. Since most patients performed poorly on the SSD task, the abnormally expressed PC1 pattern may reflect selective disruption of areas involved in explicit information sampling which are necessary for successful SSD task performance.
PC7 distinguished the patients and normal subjects during SSD task performance. It evidenced a cortical‐subcortical pattern of functional interactions comprising brain areas important for working memory processes and those especially vulnerable to abnormal dopamine uptake. Positively correlated constituents of PC7 included the right dorsolateral prefrontal cortex and the right medio‐dorsal part of the thalamus. The thalamus is well known as a relay node for a thalamic‐dorsolateral prefrontal circuit [Alexander et al., 1986]. Thus, it may be that caudate neurotransmitter deficiency restricted the functional capacity of the prefrontal cortex. In this regard, it is important to note that the caudate nucleus itself was not among the constituents of the PC7 pattern, highlighting the fact that PCA captures functional, as opposed to so‐called effective, patterns of relationships in imaging data [Friston et al., 1995]. A similar cortical‐subcortical functional relationhip has been suggested by Iseroff et al. [1982], who demonstrated that lesions in the medio‐dorsal nucleus of the thalamus impair spatial memory in monkeys. A third positively correlated constituent of PC7 was the anterior cingulate, reportedly a functional correlate of motivational aspects of distributed processing related to attention, language, and memory [Mesulam, 1990]. With respect to Parkinson's disease, this area has shown decreased activation during free selection tasks [Playford et al., 1992]. The only constituent of PC 7 with negative loading was the superior occipital gyrus, which participates in color discrimination and evidences activation changes reciprocal to those of areas involved in form discrimination [Gulyas et al., 1991].
The pattern revealed by PC11 included bilateral temporo‐parieto‐occipital association cortical areas, and was differentially expressed in the patients and normal volunteers during both REST and the SSD task condition. The positively correlated areas included the posterior part of the cingulate gyrus, the fusiform cortex, and the posterior sector of the angular gyrus. The posterior part of the cingulate gyrus, adjacent to the splenium of the corpus callosum, showed increased activation when subjects recalled and recognized visual patterns [Roland et al., 1990]. The fusiform cortex has evidenced increased activation during selective visual attention to shape, especially discrimination of changes [Corbetta et al., 1990, 1991]. Finally, the posterior sector of the angular gyrus participated in complex visual tasks and pattern discriminations [Roland et al., 1990]. Thus, the PC11 pattern appears to describe a functional network underlying supramodal information processing related to comparative feature discrimination. Consequently, deviations from the normal expression of PC11 in patients of subgroup A may reflect altered information processing possibly due to subtle deficiencies of caudate FDOPA uptake. Since these patients also showed deficient performance on the SSD task compared to normals, we suggest that they suffered a disruption of information processing, which interfered with their ability to make correct judgements regarding object discrimination. Curiously, PC11 did not distinguish patients of subgroup B, more severely affected than subgroup A in terms of caudate FDOPA uptake as well as SSD performance, from controls. We suppose that the abnormal PC11 pattern expressed in subgroup A represented plastic changes permitting the patients better SSD task performance than those of subgroup B, albeit still not at the normal level. Such a reorganization of brain function may depend on dopaminergic uptake being relatively preserved in the caudate nucleus of subgroup A patients.
CONCLUSIONS
The categorical comparisons of our functional imaging data identified an activation deficiency in the right prefrontal and the mesial frontal cortices that distinguished the patients with low FDOPA uptake in the caudate from those with normal FDOPA uptake. The principal components analysis applied to this data provided new, substantial perspectives complementary to those yielded by the categorical analysis. Reflecting interactions among multiple brain areas, patterns emerged without a priori assumptions about functional relationships. These included three patterns of functional brain interactions that distinguished our Parkinson patients from normal volunteers. The group‐differentiating functional patterns identified in this study allowed us to discriminate sensorimotor‐related impairments from cognitive aspects of information processing deficits in patients with early and advanced Parkinson's disease. Thus, our results emphasize the utility and importance of applying analytic techniques to supplement categorical comparisons of functional imaging data.
Acknowledgements
Dr. N. P. Azari was supported by the Alexander von Humboldt Foundation. We thank John Missimer for carefully reading the manuscript and making many suggestions for improvement.
Footnotes
 = 0 as shown by testing statistical hypothesis
| 2Effect | Coefficient | Std Error | Std Coeff | t | p (two‐tailed) |
| Constant | 1.830 | 0.356 | 0.000 | 5.14 | 0.001 |
| Putamen | 3.207 | 54.224 | 0.012 | 0.059 | 0.954 |
| Caudate | −252.906 | 57.593 | −0.876 | −4.391 | 0.002 |
REFERENCES
- Abacus Concepts (1996): StatView Reference. Berkeley: Abacus Concepts, Inc, p 193–204. [Google Scholar]
- Agid Y, Javoy‐Agid F, Ruberg M (1987): Biochemistry of neurotransmitters in Parkinson's disease: an overview In: Marsden CD, Fahn S, editors. Movement disorders 2 London: Butterworth, p 166–230. [Google Scholar]
- Alexander GE, DeLong MR, Strick PL (1986): Parallel organization of functionally segregated circuits linking basal ganglia and cortex [Review]. Annu Rev Neurosci 9: 357–381. [DOI] [PubMed] [Google Scholar]
- Alexander GE, Moeller JR (1994): Application of the subprofile model to functional imaging in neuropsychiatric disorders: a principal component approach to modeling brain function in disease. Hum Brain Mapp 2: 79–94. [Google Scholar]
- Allan K, Rugg MD (1997): An event‐related potential study of explicit memory on tests on cued recall and recognition. Neuropsychologia 35: 387–397. [DOI] [PubMed] [Google Scholar]
- Antonini A, Vontobel P, Psylla M, Günther I, Maguire PR, Missimer J, Leenders KL (1995): Complementary positron emission tomographic studies of the striatal dopaminergic system in Parkinson's disease. Arch Neurol 52: 1183–1190. [DOI] [PubMed] [Google Scholar]
- Azari NP, Binkofski F, Pettigrew KD, Freund H‐J, Seitz RJ (1996): Enhanced regional cerebral metabolic interactions in thalamic circuitry predict motor recovery in hemiparetic stroke. Hum Brain Mapp 4: 240–253. [DOI] [PubMed] [Google Scholar]
- Azari N, Knorr U, Arnold S, Antke C, Ebner A, Niemann H, Pettigrew KD, Witte OW, Seitz RJ (1999): Reorganized cerebral metabolic interactions in temporal lobe epilepsy. Neuropsychologia 37: 625–636. [DOI] [PubMed] [Google Scholar]
- Baddeley A (1986): Working memory. Science 255: 556–559. [DOI] [PubMed] [Google Scholar]
- Bentin S, Moscovitch M, Heth I (1992): Memory with and without awareness: performance and electrophysiological evidence of savings. J Exp Psychol: Learn Mem Cog 18: 1270–1283. [DOI] [PubMed] [Google Scholar]
- Binkofski F, Buccino G, Posse S, Seitz RJ, Rizzolatti G, Freund H‐J (1999): A fronto‐parietal circuit for object manipulation in man. Evidence from fMRI‐study. Eur J Neurosci 11: 3276–3286. [DOI] [PubMed] [Google Scholar]
- Boecker H, Khorram‐Sefat D, Kleinschmidt A, Merboldt K‐D, Hänicke W, Requardt M, Frahm J (1996): High‐resolution functional magnetic resonance imaging of cortical activation during tactile exploration. Hum Brain Mapp 3: 236–244. [Google Scholar]
- Buechel C, Friston KJ (1997): Modulation of connectivity in visual pathways by attention: cortical interactions evaluated with structural equation modelling and fMRI. Cereb Cortex 7: 768–778. [DOI] [PubMed] [Google Scholar]
- Corbetta M, Miezin FM, Dobmeyer S, Shulman GL, Petersen SE (1990): Attentional modulation of neural processing of shape, color, and velocity in humans. Science 248: 1556–1559. [DOI] [PubMed] [Google Scholar]
- Corbetta M, Miezin FM, Dobmeyer S, Shulman GL, Petersen SE (1991): Selective and divided attention during visual discriminations of shape, color, and speed: functional anatomy by positron emission tomography. J Neurosci 11: 2383–2402. [DOI] [PMC free article] [PubMed] [Google Scholar]
- Curran T, Keele SW (1993): Attentional and nonattentional forms of sequence learning. J Exp Psychol: Learn Mem Cog 19: 189–202. [Google Scholar]
- De Renzi E, Faglioni P, Scotti G (1971): Judgement of spatial orientation in patients with focal brain damage. J Neurol Neurosurg Psychiat 34: 489–495. [DOI] [PMC free article] [PubMed] [Google Scholar]
- Doyon J, Owen AM, Dagher A, Chertkow H, Evans AC (1998): Abnormal basal ganglia outflow in Parkinson's disease associated with motor sequence learning. NeuroImage 7: S996. [Google Scholar]
- Fletcher PC, Frith CD, Grasby PM, Shallice T, Frackowiack RSJ, Dolan RJ (1995): Brain systems for encoding and retrieval of auditory‐verbal memory. An in‐vivo study in humans. Brain 118: 401–416. [DOI] [PubMed] [Google Scholar]
- Fletcher PC, Frith CD, Rugg MD (1997): The functional neuroanatomy of episodic memory. [Review] Trends Neurosci 20: 213–218. [DOI] [PubMed] [Google Scholar]
- Folstein MF, Folstein SE, Mc Hugh PR (1975): 'Mini‐mental state': a practical method for grading the cognition state of the patients for the clinician. J Psychiatr Res 12: 189–198. [DOI] [PubMed] [Google Scholar]
- Freund H‐J (1987): Abnormalities of motor behavior after cortical lesions in humans. Handbook of physiology—the nervous system V Bethesda, MD: American Physiological Society, p 763–810. [Google Scholar]
- Friston KJ, Frith CD, Passingham RE, Liddle PF, Frackowiack RSJ (1992): Motor practice and neurophysiological adaptation in the cerebellum: a positron tomography study. Proc R Soc Lond B 248: 223–228. [DOI] [PubMed] [Google Scholar]
- Friston KJ, Frith CD, Frackowiak RSJ (1993a): Time‐dependent changes in effective connectivity measured with PET. Hum Brain Mapp 1: 69–80. [Google Scholar]
- Friston KJ, Frith CD, Liddle PF, Frackowiak RSJ (1993b): Functional connectivity: the principal component analysis of large (PET) data sets. J Cereb Blood Flow Metab 13: 5–14. [DOI] [PubMed] [Google Scholar]
- Friston KJ, Holmes AP, Worseley KJ, Poline J‐B, Frith CD, Frackowiack RSJ (1995): Statistical parametric maps in functional imaging:a general linear approach. Hum Brain Mapp 2: 189–210. [Google Scholar]
- Goldman‐Rakic PS (1989): Cortical localization of working memory In: McGaugh JL, Weinberger NM, Lynch G, editors. Brain organization and memory: cells, systems and circuits. New York: Oxford University Press, p 1–29. [Google Scholar]
- Grafton ST, Sutton J, Couldwell W, Lew M, Waters C (1994): Network analysis of motor system connectivity in Parkinson's disease: modulation of thalamocortical interactions after pallidotomy. Hum Brain Mapp 2: 45–55. [Google Scholar]
- Grasby PM Frith CD, Friston KJ, Bench C, Frackowiack RSJ, Dolan RJ (1993): Functional mapping of brain areas implicated in auditory‐verbal memory function. Brain 116: 1–20. [DOI] [PubMed] [Google Scholar]
- Greitz T, Bohm C, Holte S, Eriksson L (1990): A computerized brain atlas: construction, anatomical content, and some applications. J Comput Assist Tomogr 15: 26–38. [PubMed] [Google Scholar]
- Gulyas B and Roland PE (1991): Cortical fields participating in form and colour discrimination in the human brain. NeuroReport 2: 585–588. [DOI] [PubMed] [Google Scholar]
- Hazeltine E, Grafton ST, Ivry R (1997): Attention and stimulus characteristics determine the locus of motor‐sequence encoding. A PET study. Brain 120: 123–140. [DOI] [PubMed] [Google Scholar]
- Horwitz B, Grady C, Haxby J, Schapiro M, Carson R, Herscovitch P, Ungerleider L, Mishkin M, Rapoport S (1991): Object and spatial visual processing: intercorrelations of regional cerebral blood flow among posterior brain regions. J Cereb Blood Flow Metab 11: S380. [Google Scholar]
- Hsiao SS, O'Shaugnessy DM, Johnson KO (1993): Effects of selective attention on spatial form processing in monkey primary and secondary somatosensory cortex. J Neurophysiol 70: 444–447. [DOI] [PubMed] [Google Scholar]
- Hughes AJ, Ben‐Shlomo Y, Daniel SE, Lees AJ (1992): What features improve the accuracy of clinical diagnosis in Parkinson's disease: a clinicopathologic study. Neurology 42: 1142–1146. [DOI] [PubMed] [Google Scholar]
- Iseroff A, Rosvold HE, Galkin TW, Goldman‐Rakic PS (1982): Spatial memory impairments following damage to the mediodorsal nucleus of the thalamus in rhesus monkeys. Brain Res 232: 97–113. [DOI] [PubMed] [Google Scholar]
- Jobson JD (1992): Applied multivariate data analysis. II: categorical and multivariate methods. New York: Springer. [Google Scholar]
- Kohlerman NJ, Gibson AR, Houk JC (1982): Velocity signals related to hand movements recorded from red nucleus neurons in monkeys. Science 217: 857–859. [DOI] [PubMed] [Google Scholar]
- Kunesch E, Binkofski F, Freund HJ and (1989): Invariant temporal characteristics of manipulative hand movements. Exp Brain Res 78: 539–546. [DOI] [PubMed] [Google Scholar]
- Larsen KD and Yumiya H The red nucleus of the monkey. (1980): Exp Brain Res 40: 393–404. [DOI] [PubMed] [Google Scholar]
- Lammertsma AA, Cunningham VJ, Deiber MP, Heather JD, Bloomfield PM, Nutt J, Frackowiack RS, Jones T (1990): Combination of dynamic and integral methods for generating reproducible functional CBF images. J Cereb Blood Flow Metab 10: 675–686. [DOI] [PubMed] [Google Scholar]
- Ledberg A, O'Sullivan BT, Kinomura S, Roland PE (1995): Somatosensory activations of the parietal operculum of man. A PET study. Eur J Neurosci 7: 1934–1941. [DOI] [PubMed] [Google Scholar]
- Ledermann SJ, Klatzky RL (1987): Hand movements: a window into haptic object recognition. Cog Psychol 19: 342–368. [DOI] [PubMed] [Google Scholar]
- Leenders KL, Wolfson L, Gibbs JM, Wise RJS, Causon R, Jones T, Legg N (1985): The effect of L‐Dopa on regional cerebral blood flow and oxygen metabolism in patients with Parkinson's disease. Brain 108: 171–181. [DOI] [PubMed] [Google Scholar]
- Leenders KL, Salmon EP, Tyrrel P, Perani D, Brooks DJ, Sager H, Jones T, Marsden CD, Frackowiak RSJ (1990): The nigrostriatal dopaminergic system assessed in vivo by positron emission tomography in healthy volunteers and patients with Parkinson's disease. Arch Neurol 47: 1290–1297. [DOI] [PubMed] [Google Scholar]
- Marsden CD (1982): The mysterious motor function of the basal ganglia. Neurology 32: 514–539. [DOI] [PubMed] [Google Scholar]
- Martinez‐Martin P, Gil‐Nagel A, Morlan Gracia L, Balseiro Gomez J, Martinez‐Sarries J, Bermejo F, and the Cooperative Multicentric Group (1994): Unified Parkinson's disease rating scale characteristics and structure. Mov Disord 9: 76–83. [DOI] [PubMed] [Google Scholar]
- McIntosh AR, Gonzalez‐Lima F (1991): Structural modelling of functional neural pathways mapped with 2‐deoxyglucose: effects of acoustic startle habituation on the auditory system. Brain Res 547: 295–302. [DOI] [PubMed] [Google Scholar]
- McIntosh AR, Grady CL, Ungerleider LG, Haxby JV, Rapoport SI, Horwitz B (1994): Network analysis of cortical visual pathways mapped with PET. J Neurosci 14: 655–666. [DOI] [PMC free article] [PubMed] [Google Scholar]
- Mcintosh AR, Grady CL, Haxby JV, Maisog JMa, Horwitz B, Clark CM (1996): Within‐subject transformations of PET regional cerebral blood flow data: ANCOVA, ratio, and Z‐score adjustments on empirical data. Hum Brain Mapp 4: 93–102. [DOI] [PubMed] [Google Scholar]
- Mesulam MM (1990): Large‐scale neurocognitive networks and distributed processing for attention, language and memory. Ann Neurol 28: 597–613. [DOI] [PubMed] [Google Scholar]
- Nahmias C, Garnett ES, Firnau G, Lang A (1985): Striatal dopamine distribution in Parkinsonian patients during life. J Neurol Sci 69: 223–230. [DOI] [PubMed] [Google Scholar]
- Oldfield RC (1971): The assessment and analysis of handedness: the Edinburgh inventory. Neuropsychologia 9: 97–113. [DOI] [PubMed] [Google Scholar]
- Owen AM, Doyon J, Petrides M, Evans AC (1996): Planning and spatial working memory:a positron emission tomography study in humans. Europ J Neurosci 8: 353–364. [DOI] [PubMed] [Google Scholar]
- Pardo JV, Fox PT, Raichle ME (1991): Localization of a human system for sustained attention by positron emission tomography. Nature 349: 61–64. [DOI] [PubMed] [Google Scholar]
- Patlak CS and Blasberg RG (1985): Graphical evaluation of blood‐to‐brain transfer constants from multiple‐time uptake data:generalizations. J Cereb Blood Flow Metab 5: 584–590. [DOI] [PubMed] [Google Scholar]
- Playford ED, Jenkins ICH, Passingham RE, Nutt J, Frackowiack RSJ, Brooks DJ (1992): Impaired mesial frontal and putamen activation in Parkinson's disease:a positron emission tomography study. Ann Neurol 32: 151–161. [DOI] [PubMed] [Google Scholar]
- Quinn NP, Husain FA (1986): Parkinson's disease. Brit Med J 293: 379–382. [DOI] [PMC free article] [PubMed] [Google Scholar]
- Raichle ME, Siez JA, Videen TO, Mac Leod AMK, Pardo JV, Fox PT, Petersen SE (1994): Practice related changes in human brain functional anatomy of nonmotor learning. Cereb Cortex 4: 8–26. [DOI] [PubMed] [Google Scholar]
- Rascol O, Sabatini U, Fabre N, Brefel C, Loubinoux I, Celsis P, Senard JM, Montastruc JL, Chollet F (1997): The ipsilateral cerebellar hemisphere is overactive during hand movements in akinetic Parkinsonian patients. Brain 120: 103–10. [DOI] [PubMed] [Google Scholar]
- Rauch SL, Savage CR, Brown HD, Curran T, Alpert NM, Kendrick A, Fishman AJ, Kosslyn SM (1995): A PET investigation of implicit and explicit sequence learning. Hum Brain Mapp 3: 271–286. [Google Scholar]
- Roland PE (1975): Some principles and new methods of tactile stimulation. Behav Res Methods Instrum 7: 333–338. [Google Scholar]
- Roland PE, Mortensen E (1988): Somatosensory detection of microgeometry, macrogeometry and kinesthesia in man. [Review] Brain Res 12: 1–42. [DOI] [PubMed] [Google Scholar]
- Roland PE, Gulyas B, Seitz RJ, Bohm C, Stone‐Elander S (1990): Functional anatomy of storage, recall, and recognition of a visual pattern in man. Eur J Neurosci 1: 3–18. [DOI] [PubMed] [Google Scholar]
- Roland PE (1993): Brain activation. New York: Wiley‐Liss. [Google Scholar]
- Ruff HA (1984): Infants' manipulative exploration of objects: effects of age and object characteristics. Dev Pschol 20: 9–20. [Google Scholar]
- Samuel M, Ceballos‐Baumann AO, Blin J, Uema T, Boecker H, Passingham RE, Brooks DJ (1997): Evidence for lateral premotor and parietal overactivity in Parkinson's disease during sequential and bimanual movements. A PET study. Brain 120: 963–976. [DOI] [PubMed] [Google Scholar]
- Schacter DL, Curran T, Galluccio L, Milberg WP, Bates JF (1996): False recognition and the right frontal lobe: a case study. Neuropsychologia 34: 793–808. [DOI] [PubMed] [Google Scholar]
- Schmahmann JD (1996): From movement to thought anatomic substrates of the cerebellar contribution of cognitive processing. Hum Brain Mapp 4: 174–198. [DOI] [PubMed] [Google Scholar]
- Seitz RJ, Roland PE, Bohm C, Greitz T, Stone‐Elander S (1991): Somatosensory discrimination of shape: tactile exploration and cerebral activation. Eur J Neurosci 3: 481–492. [DOI] [PubMed] [Google Scholar]
- Seitz RJ, Roland PE (1992): Learning of sequential finger movements in man: a combined kinematic and positron emission tomography (PET) study. Eur J Neurosci 4: 154–165. [DOI] [PubMed] [Google Scholar]
- Seitz RJ, Knorr U, Höflich P, Binkofski F, Tellmann L, Herzog H, Freund H‐J (1998): Role of the premotor cortex in recovery from middle cerebral artery infarction. Arch Neurol 55: 1081–1088. [DOI] [PubMed] [Google Scholar]
- Seitz RJ, Knorr U, Azari NP, Herzog H, Freund H‐J (1999): Visual network activation in recovery from sensorimotor stroke. Restor Neurol Neurosci 14: 25–33. [PubMed] [Google Scholar]
- Sinclair RJ, Burton H (1993): Neuronal activity in the second somatosensory cortex of monkeys (mucaca mulatta) during active touch of gratings. J Neurophysiol 70: 331–350. [DOI] [PubMed] [Google Scholar]
- Stam CJ, Visser SL, Op de Coul AAW, De Sonnevil LMJ, Schellens RLLA, Brunia CHM, de Smet JS, Gielen G (1993): Disturbed frontal regulation of attention in Parkinson's disease. Brain 116: 1139–1158. [DOI] [PubMed] [Google Scholar]
- Talairach J and Tournoux P (1988): Co‐planar stereotaxic atlas of the human brain. Stuttgart: Georg Thieme Verlag. [Google Scholar]
- Teasdale N, Phillips J, Stehmach GE (1990): Temporal movement control in patients with Parkinson's disease. J Neurol Neurosurg Psychiat 53: 862–868. [DOI] [PMC free article] [PubMed] [Google Scholar]
- Thurfjell L, Bohm C, Bengtsson E (1995): CBA—an atlas based software tool used to facilitate the interpretation of neuroimaging data. Comput Meth Prog Biomed 47: 51–71. [DOI] [PubMed] [Google Scholar]
- Weder B, Knorr U, Herzog H, Nebeling B, Kleinschmidt A, Huang Y, Steinmetz H, Freund H‐J, Seitz RJ (1994): Tactile exploration of shape after subcortical ischaemic infarction studied with PET. Brain 117: 593–605. [DOI] [PubMed] [Google Scholar]
- Weder B, Seitz RJ (1994): Deficient cerebral activation pattern in stroke recovery. NeuroReport 5: 457–460. [DOI] [PubMed] [Google Scholar]
- Weder B, Nienhusmeier M, Keel A, Leenders KL, Ludin HP (1998): Somatosensory discrimination of shape: prediction of sucess in normal volunteers and Parkinsonian patients. Exp Brain Res 120: 104–108. [DOI] [PubMed] [Google Scholar]
- Weder BJ, Leenders KL, Vontobel P, Nienhusmeier M, Keel A, Zaunbauer W, Vonesch T, Ludin H‐P (1999): Impaired somatosensory discriminaton of shape in Parkinson's disease: association with caudate nucleus dopaminergic function. Hum Brain Mapp 8: 1–12. [DOI] [PMC free article] [PubMed] [Google Scholar]
- Welch MJ, Ter‐Pogossian MM (1969): Preparation of millicurie quantities of oxygen‐15 labelled water. J Labelled Comp 5: 168–172. [Google Scholar]
- Wilding EL, Rugg MD (1996): An event related potential study of recognition memory with and without retrieval of source. Brain 119: 889–905. [DOI] [PubMed] [Google Scholar]
- Wunderlich G, Knorr U, Stephan KM, Tellmann L, Azari N, Herzog H, Seitz RJ (1997): Dynamic scanning of 15O Butanol with positron emission tomography can identify regional cerebral activations. Human Brain Mapp 5: 364–378. [DOI] [PubMed] [Google Scholar]