

Abstract
We investigated the capability of emotional and nonemotional visual stimulation to capture automatic attention, an aspect of the interaction between cognitive and emotional processes that has received scant attention from researchers. Event‐related potentials were recorded from 37 subjects using a 60‐electrode array, and were submitted to temporal and spatial principal component analyses to detect and quantify the main components, and to source localization software (LORETA) to determine their spatial origin. Stimuli capturing automatic attention were of three types: emotionally positive, emotionally negative, and nonemotional pictures. Results suggest that initially (P1: 105 msec after stimulus), automatic attention is captured by negative pictures, and not by positive or nonemotional ones. Later (P2: 180 msec), automatic attention remains captured by negative pictures, but also by positive ones. Finally (N2: 240 msec), attention is captured only by positive and nonemotional stimuli. Anatomically, this sequence is characterized by decreasing activation of the visual association cortex (VAC) and by the growing involvement, from dorsal to ventral areas, of the anterior cingulate cortex (ACC). Analyses suggest that the ACC and not the VAC is responsible for experimental effects described above. Intensity, latency, and location of neural activity related to automatic attention thus depend clearly on the stimulus emotional content and on its associated biological importance. Hum. Brain Mapp. 22:290–299, 2004. © 2004 Wiley‐Liss, Inc.
Keywords: ERPs, oddball paradigm, negativity bias, PCA, LORETA, P1, P2, N2
INTRODUCTION
Evolutionary success depends heavily on the efficiency of an organism in detecting and reacting to biologically important events. In fact, the nervous system automatically (involuntarily) orients its processing resources to these events as soon as they are perceived. According to researchers in this area [e.g., Graham and Hackley, 1991; Öhman et al., 2000; Siddle et al., 1983; Sokolov, 1963], this orienting response is elicited mainly by two classes of biologically important stimulation: novel stimuli (unknown or unexpected in a particular environment) and signal stimuli (usually emotional: known, and even expectable, but critical for the individual, such as food, mating partners or danger). The orienting response involves automatic attentional mechanisms that are unconscious and stimulus driven, in what is often defined as a bottom‐up process [Öhman et al., 2001]. Automatic or passive attention must be distinguished from the other type of attention, voluntary (consciously controlled) attention, triggered and developed in a top‐down fashion (i.e., driven by the central nervous system [CNS]). The study of cerebral mechanisms associated with automatic attention has focused on novel stimuli. There is a considerable lack of information in relation to emotional/signal stimuli, therefore, due probably to the implicit assumption that automatic attention is similar for the two types of stimuli.
The purpose of the present study was to investigate this matter through recording of event‐related brain potentials (ERPs), a manifestation of neural electrical activity. This temporally agile psychophysiologic signal is particularly useful for studying automatic attention, because it is characterized by its rapidity: initial neural changes associated with this type of attention may appear around 100 msec after onset of the event that captures it [Hopfinger and Mangun, 2001]. Moreover, ERP methodology employs reliable experimental procedures widely used in the study of automatic attention, the “passive oddball paradigm” being the most outstanding. This procedure exploits the capability of deviant or unexpected stimulation to elicit the orienting response, and consists basically of repeatedly presenting one stimulus, which becomes familiar (“standard”), with a different stimulus (“deviant”) inserted sporadically in the sequence. In contrast to the active oddball task, subjects are not instructed to attend actively to deviant stimuli.
Deviant stimuli elicit two consecutive effects that reflect two steps of the orienting response [Öhman, 1979]. The first effect is the most interesting for the present research, because it consists of the capture of automatic attention. This automatic phase is independent of controlled, limited central processing resources, and appears even when the subject is engaged in a high‐demand distracting task while the sequence of standard and deviant stimuli is being presented. This first effect is reflected in the auditory modality (standard and deviant sounds are presented to subjects), in the mismatch negativity (MMN) or N2a, an ERP component presenting its peak around 200 msec after stimulus onset [Näätänen and Picton, 1986]. In the visual modality (standard and deviant visual stimuli), it is reflected in P2 and N2, peaking approximately at 200 and 250 msec, respectively [Daffner et al., 2000; Kenemans et al., 1989, 1992; Tales et al., 1999]. All of these components show their highest amplitude when the deviant stimulus is presented. The second effect, beginning at around 300 msec and reflected in both visual and auditory tasks in P3a (which also presents its highest amplitude in response to deviant stimuli), is not relevant to our purposes, because it reflects the limited controlled‐processing phenomena triggered by previous automatic processes: P3a presents lower amplitudes, or even disappears, when central processing resources are engaged in a distracting task [Escera et al., 1998; Kenemans et al., 1992]. Additionally, in the specific case of visual stimulation experiments, several studies (not necessarily oddball‐based) report that P1, an early sensory component peaking around 100 msec, also constitutes an index of mobilization of automatic attentional resources [see review in Hopfinger and Mangun, 2001].
The present research employed the visual passive oddball paradigm, presenting an emotionally neutral picture as standard stimulus (80.2% of trials) and emotionally positive (D+), negative (D−), and neutral (D0) pictures as deviant stimuli (19.8%). To avoid the interference of differential voluntary attention toward these stimuli, subjects were requested to carry out a distracting, high‐demand task while the images were being presented. The scope of this experiment was to obtain data that may help answer three important questions. The first one refers to intensity‐related issues: it has been hypothesized that it is more important to respond to signal stimuli, whose significance is known by the subject, than to novel stimulation [Öhman et al., 2000]. Do emotional deviant stimuli elicit greater P1, P2, or N2 amplitudes than do neutral deviant stimuli? The second question deals with time: it has been suggested that emotional stimuli, due to their important consequences, need faster responses than do neutral ones [Öhman et al., 2001]. Do neural mechanisms associated with automatic attention captured by emotional deviant stimuli present shorter response latencies than do those related to neutral deviant stimuli? Finally, the third question refers to space or neural location: some experimental data and theoretical proposals suggest that urgent reactions involve specific neural mechanisms that differ from deep‐processing neural mechanisms [LeDoux, 2000a; Shizgal, 1999]. Does automatic attention to deviant emotional stimuli activate neural areas different from those activated by attention to deviant neutral stimuli?
SUBJECTS AND METHODS
Subjects
Thirty‐seven right‐handed students from the Universidad Autónoma de Madrid took part in this experiment. These 37 subjects (28 women) were aged between 20–48 years (mean, 21.54 years; standard deviation [SD], 4.59 years). They took part voluntarily in the experiment and provided their informed consent to participate in it, reporting normal or corrected‐to‐normal visual acuity.
Stimuli and Procedure
As mentioned above, the passive oddball paradigm was used as experimental task. In total, 378 stimuli were presented to subjects. The standard stimulus (303 presentations) consisted of an emotionally neutral picture (a wristwatch). Three types of deviant stimuli were employed (25 presentations for each type), all with similar contrast, brightness, physical complexity and color saturation: D+ or deviant positive (an opposite‐gender nude), D− or deviant negative (open mouth of a snarling wolf), and D0 or deviant neutral (a wheel). Each presentation lasted 200 msec. All photographs were of the same size (13.22 degrees [visual angle] high × 19.39 degrees wide) and were presented in the center of the screen. Intertrial interval was 1,000 msec.
All stimuli had a green frame (50% of images in standard, D+, D0, and D− categories) or a red frame (50%) 0.21 degree wide. Green‐ and red‐framed stimuli were presented in random order. The task consisted of “mentally counting” the number of changes in the color frame from the previous presentation to the current one. The 378 presentations (303 standard and 75 deviant) were divided into 9 blocks of 43 presentations, and subjects verbally reported the number of changes they counted after each of the blocks. As mentioned above, this distracting task was designed to ensure that participants directed their limited controlled resources mainly to this distracting task, rather than to the images' content. This strategy equalizes controlled attention with respect to all stimuli, so differential effects may be attributed to other noncontrolled processes. Tasks similar to the present one, which guide the focus of attention toward distracting or secondary elements of briefly presented visual stimuli, hinder allocation of controlled resources toward critical elements even when these appear in the middle of the screen [Mack and Rock, 1998; Merikle et al., 2001]. The distracting task was sufficiently difficult for the achievement of this objective, because none of the participants reported the correct number of frame color changes (mean deviation from correct answer on changes in color frame per subject, 15.22; SD, 18.87). Participants were instructed to look continuously at a small mark located in the center of the screen.
Recording
Electroencephalographic (EEG) data were recorded using an electrode cap (ElectroCap International) with tin electrodes. In total, 58 scalp locations were used: Fp1, Fpz, Fp2, AF3, AF4, F7, F5, F3, F1, Fz, F2, F4, F6, F8, FC5, FC3, FC1, FCz, FC2, FC4, FC6, T7, C5, C3, C1, Cz, C2, C4, C6, T8, TP7, CP5, CP3, CP1, CPz, CP2, CP4, CP6, TP8, P7, P5, P3, P1, Pz, P2, P4, P6, P8, PO7, PO3, PO1, POz, PO2, PO4, PO8, O1, Oz, and O2. All scalp electrodes and one electrode at the left mastoid (M1) were referenced originally to one electrode at the right mastoid (M2). For the entire sample of electrodes, originally M2‐referenced data were re‐referenced off‐line using the average of the mastoids (M1 and M2) method. Electrooculographic (EOG) data were recorded supra‐ and infraorbitally (vertical EOG) and from the left versus right orbital rim (horizontal EOG). Electrode impedances were always kept below 3 kΩ. A bandpass of 0.1–50 Hz (3 dB points for −6 dB/octave roll‐off) was used for the recording amplifiers. The channels were continuously digitizing data at a sampling rate of 250 Hz during the complete recording session. The continuous recording was divided into 960‐msec epochs for each trial, beginning 200 msec before target onset. A visual inspection was also carried out, eliminating epochs with eye movements or blinks. ERP averages were categorized according to each type of stimulus (Standard, D+, D0, D−). This artifact rejection scarcely affected deviants: average rejection was 3.43 trials for D− (SD = 1.92); 3.03 for D0 (SD = 2.10); and 4.41 for D+ (SD = 2.07).
RESULTS
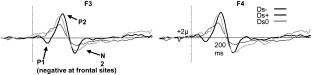
Figure 1 shows the grand averages for each stimulus condition, once the baseline (prestimulus recording) had been subtracted from each ERP, corresponding to six recording channels (F3, F4, C3, C4, P3, and P4) selected from the 58 channels used. In all statistical contrasts involving analyses of variance (ANOVAs), the Greenhouse‐Geisser (GG) epsilon correction was applied to adjust the degrees of freedom of the F‐ratios, and post‐hoc comparisons to determine the significance of pairwise contrasts were made using the Bonferroni procedure (α = 0.05).
Figure 1.
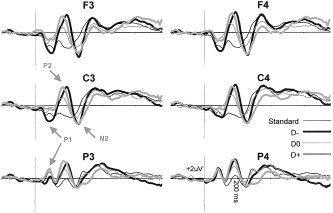
Grand averages. Mean responses to the four groups of stimuli at F3, F4, C3, C4, P3, and P4 (D−, deviant negative; D0, deviant neutral; D+, deviant positive).
Temporal Principal Component Analysis
Components explaining most ERP variance were extracted and quantified through a covariance matrix‐based temporal principal component analysis (tPCA). This technique has been recommended repeatedly for this task, because exclusive use of traditional visual inspection of grand averages and voltage computation may lead to several types of misinterpretation [Chapman and McCrary, 1995; Coles et al., 1986; Donchin and Heffley, 1978; Fabiani et al., 1987]. The main advantage of this procedure is that it presents each ERP component with its “clean” shape, extracting and quantifying them free of the influences of adjacent or subjacent components (traditional grand averages can show components in a distorted way and may even not to show some of them).
The number of components selected was decided based on the scree test [Cliff, 1987]. Extracted components were submitted to varimax rotation. After this selection criterion, seven components were extracted from ERPs. The presence of the three components mentioned above as relevant for this research (P1, P2, and N2) was confirmed in this analysis. Factor peak‐latency and topography characteristics (Fig. 2, 3) thus associate Factor 3 (peaking at 180 msec) with the wave labeled P2 in grand averages (Fig. 1), Factor 5 (240 msec) with N2 deflection, and Factor 6 (105 msec) with P1. These labels will be employed hereafter to make the results easier to understand. Figure 2 shows the rotated loadings plotted over time for these three components, and Figure 3 illustrates their mean factor scores for each location in the form of scalp maps. Factor scores, the parameter in which temporal factors are quantified, are calculated for each individual ERP and reflect the amplitude of the component.
Figure 2.
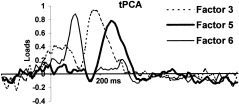
Factor loadings of relevant factors after varimax rotation.
Figure 3.
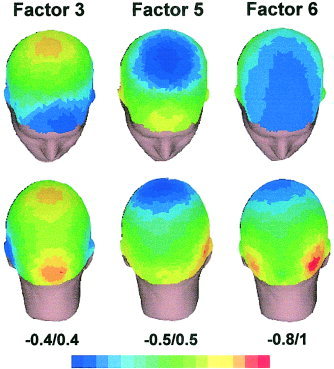
Topographic maps representing the relevant factor scores (averaged for the four types of stimuli) obtained in each of the 58 recording channels. [Color figure can be viewed in the online issue, which is available at www.interscience.wiley.com.]
Experimental Effects ANOVA
Analyses of experimental effects required the ERPs, recorded at 58 globally distributed scalp points, to be grouped into different scalp regions, because frequently ERP components behave differently in some scalp areas than in others (e.g., present opposite polarity or react differently to experimental manipulations). This regional grouping was determined through a covariance matrix‐based spatial PCA (sPCA) on P1, P2, and N2 temporal factor scores. This system to configure and quantify scalp regions is preferable to an a priori subdivision into fixed scalp regions for all components [Carretié et al., 2003; Spencer et al., 1999], because sPCA demarcates scalp regions according to the real behavior of each scalp‐point recording (basically, each region or spatial factor is formed with scalp points where recordings tend to covary). Consequently, the shape of the sPCA‐configured regions is functionally based and scarcely resembles the shape of the traditional, geometrically configured regions. Moreover, each spatial factor can be quantified through the spatial factor scores, a single parameter that reflects the amplitude of the whole spatial factor.
Two spatial factors, one frontal and the other posterior (although with different shapes in each case), were also established through the scree test for each of the three components. Subsequently, ANOVAs on frontal and posterior spatial factors of P1, P2, and N2 were computed. To neutralize both the effect of voluntary attention (which, as explained above, was equalized through the task for standard and deviant stimuli) and the effect of stimulus variables other than emotional (at least partially), factor scores to standards were subtracted from factor scores to D−, D0, and D+. These subtractions are referred to as Ds−, Ds0, and Ds+ hereafter and reflect the distance in amplitude, from standards, of each of the deviants (i.e., the level of attentional capture).
The effect of stimuli (three levels: Ds−, Ds0, and Ds+) was always significant in the frontal but not in the posterior spatial factor of the three components: P1 (F[2,72] = 15.00, GG epsilon = 0.90, P < 0.001), P2 (F[2,72] = 11.01, GG epsilon = 0.92, P < 0.001) and N2 (F[2,72] = 6.11, GG epsilon = 0.92, P < 0.01). To illustrate the main trends of these significant contrasts, Figure 4 shows the mean amplitudes for each stimulus and each component. Interpretation of this figure must take into account that P1 is negative at frontal areas (see Fig. 1), where the significant differences have been observed: the highest amplitudes were represented by the highest negativities. Post‐hoc tests yielded the results shown in Table I. Figure 5 shows the difference waves of deviants minus standard.
Figure 4.
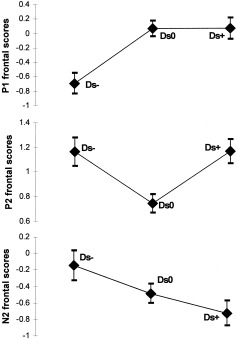
P1, P2, and N2 frontal factor scores (directly related to amplitudes) in response to the three types of stimuli analyzed through ANOVA (Ds−, deviant negative minus standard; Ds0, deviant neutral minus standard; Ds+, deviant positive minus standard).
Table I.
Post‐hoc differences between stimulus types
| ERP | Significant contrasts |
|---|---|
| P1 | Ds− vs. Ds+ |
| Ds− vs. Ds0 | |
| P2 | Ds0 vs. Ds− |
| Ds0 vs. Ds+ | |
| N2 | Ds+ vs. Ds− |
Differences were found by Bonferroni test (P < 0.05). ERP, event‐related potential; Ds−, deviant negative minus standard; Ds0, deviant neutral minus standard; Ds+, deviant positive minus standard).
Figure 5.
Difference waves (average of all subjects) of deviant negative minus standard (Ds−), deviant neutral minus standard (Ds0), and deviant positive minus standard (Ds+), at two frontal electrodes (experimental effects were significant at frontal locations), F3 and F4.
Source Localization
The next step was to localize the frontal focuses that originate the frontal spatial factors (sensitive to the experimental effects as explained). Low‐resolution brain electromagnetic tomography (LORETA) was applied to locate the origins of P1, P2, and N2. LORETA is a 3D, discrete linear solution for the EEG inverse problem [Pascual‐Marqui, 1999; Pascual‐Marqui et al., 1994], and its solutions have shown significant correspondence with those provided by functional magnetic resonance imaging (fMRI) in the same tasks [Vitacco et al., 2002], with the error margin of source localization being 14 mm [Pascual‐Marqui, 1999]. In its current version, LORETA refers to a three‐shell spherical model registered to the Talairach human brain atlas [Talairach and Tournoux, 1988]. The solution is given, therefore, in three coordinates: x is the distance in millimeters to the right (+) or left (−) of midline; y is the distance anterior (+) or posterior (−) to the anterior commissure; and z is the distance above (+) or below (−) a horizontal plane through the anterior and posterior commissures. For the three components (P1, P2, and N2), source analyses were carried out on the single average of each factor score (directly related to amplitudes, as explained previously) in response to all the stimuli. Figure 6 shows the main sources of activity for the three components, which belong to the visual association cortex; however, a frontal focus (whose localization was our scope in present source analyses) is also visible in the three components (its strength grows from P1 to N2). Table II shows the location of these main focuses (originating in the visual association cortex), and the frontal focuses (originating in the anterior cingulate cortex).
Figure 6.
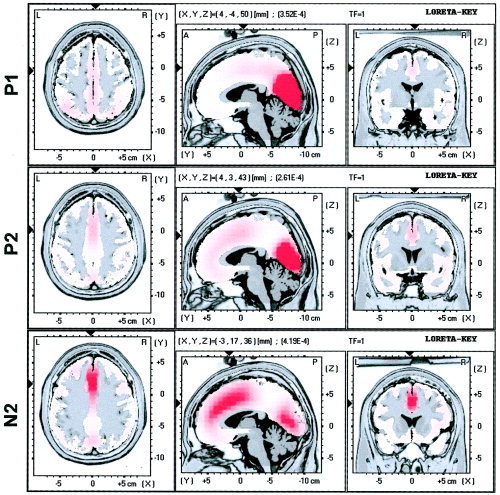
Images of neural activity from a single average of the responses to all stimuli, computed with LORETA for P1, P2, and N2 factor scores. The main focuses are represented through three orthogonal brain views in Talairach space, sliced through the region of the maximum activity. Left slice: axial, seen from above, nose up; center slice: sagittal, seen from the left; right slice: coronal, seen from the rear. Talairach coordinates: x from left (L) to right (R); y from posterior (P) to anterior (A); z from inferior to superior. Black triangles at the margins of each view point the location of the main frontal focus. [Color figure can be viewed in the online issue, which is available at www.interscience. wiley.com.]
Table II.
Main focuses provided by LORETA for P1, P2, and N2
| Talairach (x, y, z) | Anatomically close regions (d ≤ 4 mm) | |
|---|---|---|
| P1 | ||
| Main focus | 4, −81, 8 | Cuneus (BA 17), d = 0 mm |
| Cuneus (BA 18), d = 3 mm | ||
| Main frontal focus | 4, −4, 50 (22.35%)a | Cingulate gyrus (BA 24), d = 1 mm |
| P2 | ||
| Main focus | 4, −74, 8 | Cuneus (BA 18), d = 1 mm |
| Main frontal focus | 4, 3, 43 (44.31%)a | Cingulate gyrus (BA 24) d = 2 mm |
| N2 | ||
| Main focus | 4, −74, 8 | Cuneus (BA 18), d = 1 mm |
| Main frontal focus | −3, 17, 36 (99.21%)a | Cingulate gyrus (BA 32), d = 1 mm |
Percentages indicate the relative weight of the frontal focus with respect the main focus in explaining the component. Talairach coordinates: x from left to right, y from posterior to anterior, z from inferior to superior. BA, Brodmann area; d, distance.
Control Analyses
Each subject filled out a bidimensional scaling test for each type of picture after the recording sessions, assessing its valence (−2 [negative] to 2 [positive] being the extremes of this affective dimension) and arousal (−2 [calming] to 2 [arousing]) level, two affective dimensions that are considered widely to explain the principal variance of the emotional meaning [Lang et al., 1993; Osgood et al., 1957; Russell, 1979; Smith and Ellsworth, 1985]. Statistical analyses were carried out on these assessments to confirm first that the pictures' affective valence was as assumed a priori, and second, that positive and negative pictures were balanced with respect to their arousal levels. Table III shows the means and standard error of means (SEM) of both dimensions for each type of image. One‐way repeated‐measures ANOVA was computed for valence and arousal dimensions, using Stimuli (four levels: Standard, D+, D0, and D−) as factors. ANOVA yielded significant differences both in valence and in arousal (F[3,108] = 91.57, GG epsilon = 0.86, P < 0.001 and F[3,108] = 14.70, GG epsilon = 0.94, P < 0.001, respectively). Post‐hoc contrasts indicated that Standard and D0 did not present significant differences with respect to valence and arousal level. D+ and D− showed different valences but not different arousal levels. D+ and D− differed from D0 and Standard in both arousal and valence level.
Table III.
Valence, arousal, familiarity, and physical complexity assessments given by the 37 subjects to the four types of stimulation
| Stimulation | Arousal | Valence | Familiarity | Complexity |
|---|---|---|---|---|
| Standard | 0.46 (0.16) | 0.08 (0.14) | −1.43 (0.13) | 1.14 (0.17) |
| D− | 1.65 (0.12) | −1.19 (0.14) | 0.22 (0.21) | 0.68 (0.16) |
| D0 | 0.38 (0.16) | −0.22 (0.14) | −0.22 (0.14) | −1.11 (0.18) |
| D+ | 1.19 (0.19) | 1.73 (0.08) | −1.27 (0.3) | 0.54 (0.18) |
Means and SEM (in brackets) of valence (−2, negative to 2, positive), arousal (−2, calming to 2, arousing), familiarity (−2, familiar to 2, strange), and physical complexity (−2, simple to 2, complex) assessments given by the 37 subjects to the four types of stimulation (Standard, D− [deviant negative], D0 [deviant neutral], and D+ [deviant positive]).
The second control analysis tested the possibility that stimulus variables other than emotional ones were influencing ERP amplitudes. Particularly, subjects also assessed the familiarity (−2 [familiar] to 2 [strange]) and physical complexity (−2 [simple] to 2 [complex]) of each stimulus (Table III). Multiple regression analyses were carried out to test the association of valence, arousal, familiarity, and complexity with P1, P2, and N2 amplitudes (i.e., with P1, P2, and N2 frontal spatial factors). None of the four variables associated with N2, only arousal associated with P2 (β = −0.29, t[106] = −2.73, P < 0.01), and both valence and complexity associated with P1 (β = 0.20, t[106] = 2.05, P < 0.05, and β = −0.24, t[106] = −2.26, P < 0.05, respectively). Complexity and valence, however, were correlated significantly (r = −0.24, P < 0.025), so the effect of both variables on P1 may not be pure but mediated by their association to each other. In fact, when the influence of complexity was neutralized (partialled out) via a partial correlation analysis, the correlation between valence and P1 amplitude maintained its significance (r = 0.22, P < 0.01), but when the influence of valence was neutralized, complexity lost its association with P1. In other words, the association of stimulus complexity itself with P1 was nonsignificant.
DISCUSSION
As in previous studies, P1, P2, and N2 have shown significant sensitivity to automatic attention capture in response to visual stimuli. The behavior of these three ERP components shows characteristics that seem to reflect gradual phases or steps in the sequence of activity occurring 100–240 msec after stimulus onset. Functionally, this sequence is characterized initially by greater mobilization of attentional resources toward negative deviant stimuli, continues with resources directed to emotional deviant stimuli (positive and negative), and finishes with resources directed preferentially toward neutral and positive deviants. Anatomically, this sequence is characterized by decreasing activation of several areas of the visual association cortex (VAC) and by the growing involvement of the anterior cingulate cortex (ACC). This activation of the ACC begins at dorsal areas (Brodmann's area [BA] 24) and finishes at ventral areas (BA 32). Interestingly, statistical analyses show significant differences in the frontal scalp region but not in the posterior and suggest that the ACC but not the VAC is sensitive to the emotional content of the stimulation capturing automatic attention.
The involvement of ACC (BA 24 and 32) in attention [Bush et al., 2000; Cardinal et al., 2002; Posner, 1995; Sturm et al., 1999; Turak et al., 2002] and in the response to emotional stimuli [Berthoz et al., 2002; Lane et al., 1998; Peoples, 2002; Ploghaus et al., 1999] makes this prefrontal region a candidate area for a crucial role in interaction of attention and emotion. It is important to stress in this study that ACC is not involved exclusively in controlled processes, but also in automatic neural processes [Phillips et al., 2003]. Other prefrontal regions, such as the medial prefrontal cortex, with which the ACC is related particularly closely (BA 32) [Lane et al., 1997; 1999], also show this double (attention and emotion) involvement [Adolphs et al., 2003; Bussey et al., 1997; Teasdale et al., 1999]. Additional information and discussion on the three components involved in the sequence is presented below.
P1 (Peak at 105 msec)
The first phase of the sequence of neural activity is reflected in P1 (which, as indicated, is negative at frontal locations). In our study, P1 was characterized by presenting its highest amplitude in response to negative stimulation. As can be deduced from stimulus and control analyses, it is not probable that the observed differences were due to physical configuration of the stimulation. Moreover, recent data (from an active, selective attention task) exist indicating that P1 sensitivity to emotional visual stimuli does not depend on its physical configuration [Smith et al., 2003]. The fact that negative stimuli (but not other deviant stimuli) mobilize attentional resources as early as 105 msec is probably a manifestation of the negativity bias. This bias refers to the fact that, according to several proposals, negative, aversive events elicit more rapid or more prominent emotional responses (involving cognitive and physiologic changes) than do neutral or positive ones [Cacioppo and Gardner, 1999]. The existence of the negativity bias has received recently experimental support from studies on brain activity [Carretié et al., 2001; Ito et al., 1998; Northoff et al., 2000]. This phenomenon would have obvious adaptive and evolutionary advantages: the consequences of reacting slowly to a dangerous or injurious event are often much more dramatic than are the consequences of a similar reaction to neutral or even appetitive stimuli [Öhman et al., 2000; Ekman, 1992].
Analyses indicate that the frontal focus of P1 manifests this negativity bias. This short latency of prefrontal response to the emotional aspects of the stimulation (P1 peaks at 105 msec) is apparently an odd finding. Other laboratories, however, have also found prefrontal responses to affective aspects of visual stimulation around 100 msec, both in intracranial recordings [Kawasaki et al., 2001] and in ERPs [Holmes et al., 2003]. Amygdala may facilitate this short response latency. This nucleus, which receives early visual inputs [LeDoux, 2000b], interacts with many attention‐related areas of the brain, including the prefrontal region [Vuilleumier, 2002]. The amygdala thus may activate these areas to facilitate rapid reaction from the organism [see Holmes et al., 2003].
P2 (Peak at 180 msec)
The second phase is reflected in P2, which has shown greater amplitudes in response to emotional deviant stimuli (negative and positive) than in response to neutral deviant stimuli. This trend confirms that the two types of events (emotional and nonemotional) seem to present different levels of biological importance. The importance of negative stimuli has been explained already, but positive stimuli (food, mates, etc.) require a biologically adaptive approaching behavior that, although not so urgent as the avoiding behavior triggered by aversive stimuli, is not required by neutral or routine stimuli [Öhman et al., 2001]. The neural origin of this component, typically obtained in the visual oddball task, has yet to be studied. The present data suggest that, like its auditory counterpart (mismatch negativity), P2 originates primarily in the sensory cortex (supratemporal, in the case of MMN) [see review in Alho, 1995] in practically the same areas as P1, but that frontal areas also contribute to its generation [see Alho et al., 1994, with respect to MMN]. Specifically, the present analyses suggest that ACC contributes to the generation of P2, being sensitive to the emotional characteristics of the stimulation. Due to its association with attentional processes and other ACC‐related functions, such as stimulus salience (a stimulus characteristic with strong affective value), previous literature has also indicated that this component may originate partially in the ACC [see Potts and Tucker, 2001].
N2 (Peak at 240 msec)
The third phase is reflected in N2, which has shown higher amplitudes to positive and neutral deviants, thus supporting the idea that these two types of stimuli do not need such urgent mobilization of attentional resources as do negative stimuli. In this phase, activation of ACC is produced ventrally (BA 32). The fact that P1 and P2, two components that react strongly to negative stimuli, show their focus in dorsal ACC (BA 24) and that N2, which does not react to negative stimuli, shows its focus in ventral ACC, suggests that these two areas may play a different role in the reaction to emotional stimuli (the former being able to develop faster responses). Further research employing techniques with higher spatial resolution (as indicated already, LORETA error margin is up to 14 mm) should explore this suggestion.
Depending on the type of task, N2 deflection may reflect different processes. In fact, it has been subdivided into different components that may be found in response to auditory stimuli (e.g., N2a, N2b, N2c). It has been proposed that some of these components reflect automatic processes whereas others reflect controlled processes [Näätänen and Picton, 1986]. Although this N2 typology does not always seem to fit well with visual ERPs [Daffner et al., 2000], the central distribution of the present N2 (Fig. 3) may link it to the auditory N2b. Some data suggest that N2b may represent the frontier between automatic and controlled phases of the orienting response, because it is already sensitive to certain central controlled processes [Näätänen and Gaillard, 1983; Näätänen and Picton, 1986]. This “semiautomatic” component [Daffner et al., 2000], may therefore be seen as reflecting the final phase of automatic attention‐related neural mechanisms.
CONCLUSIONS
This description of the observed data can be summarized in the form of answers to the three questions we intended to investigate. First, P1 and P2 amplitudes suggest that, at least in the initial phases, mobilization of resources related to automatic attention is greater in response to emotional deviant stimuli than in response to nonemotional deviant stimuli. This result indicates that attentional capture is not an all‐or‐nothing process, but a gradual one. Second, P1, P2, and N2 amplitudes show that emotional stimuli mobilize automatic attention resources before neutral stimuli do. In particular, aversive events, which frequently require an urgent response, capture this type of attention before any other stimulus. Third, analyses on the origin of these three ERP components suggest that as the sequence advances from P1 to N2 the ACC is increasingly involved, and that this activation moves from dorsal (P1 and P2) to ventral ACC (N2). This finding supports the idea that, also in relation to automatic attention, neural circuitry activated in response to stimuli that require rapid responses differs at least in some aspects from that activated in response to stimuli that require deep processing. Further research employing wider sets of stimuli (both qualitatively and quantitatively) is needed to confirm and to investigate in depth the present findings.
Acknowledgements
We thank P. Casado, F. Muñoz, and A. Iglesias for their help in data collection.
REFERENCES
- Adolphs R, Tranel D, Damasio AR (2003): Dissociable neural systems for recognizing emotions. Brain Cogn 52: 61–69. [DOI] [PubMed] [Google Scholar]
- Alho K (1995): Cerebral generators of mismatch negativity (MMN), and its magnetic counterpart (MMNm), elicited by sound changes. Ear Hear 16: 38–51. [DOI] [PubMed] [Google Scholar]
- Alho K, Woods DL, Algazi A, Knight RT, Näätänen R (1994): Lesions of frontal cortex diminish the auditory mismatch negativity. Electroencephalogr Clin Neurophysiol 91: 353–362. [DOI] [PubMed] [Google Scholar]
- Berthoz S, Artiges E, Van de Moortele PF, Poline JB, Rouquette S, Consoli SM, Martinot JL (2002): Effect of impaired recognition and expression of emotions on frontocingulate cortices: an fMRI study of men with alexithymia. Am J Psychiatry 159: 961–967. [DOI] [PubMed] [Google Scholar]
- Bush G, Luu P, Posner MI (2000): Cognitive and emotional influences in anterior cingulate cortex. Trends Cogn Sci 4: 215–222. [DOI] [PubMed] [Google Scholar]
- Bussey TJ, Muir JL, Everitt BJ, Robbins TW (1997): Triple dissociation of anterior cingulate, posterior cingulate, and medial frontal cortices on visual discrimination tasks using a touchscreen testing procedure for the rat. Behav Neurosci 111: 920–936. [DOI] [PubMed] [Google Scholar]
- Cacioppo JT, Gardner WL (1999): Emotion. Annu Rev Psychol 50: 191–214. [DOI] [PubMed] [Google Scholar]
- Cardinal RN, Parkinson JA, Hall J, Everitt BJ (2002): Emotion and motivation: The role of the amygdala, ventral striatum, and prefrontal cortex. Neurosci Biobehav Res 26: 321–352. [DOI] [PubMed] [Google Scholar]
- Carretié L, Hinojosa JA, Mercado F (2003): Cerebral patterns of attentional habituation to emotional visual stimuli. Psychophysiology 40: 381–388. [DOI] [PubMed] [Google Scholar]
- Carretié L, Martín‐Loeches M, Hinojosa JA, Mercado F (2001): Attention and emotion interaction studied through event‐related potentials. J Cogn Neurosci 13: 1109–1128. [DOI] [PubMed] [Google Scholar]
- Chapman RM, McCrary JW (1995): EP component identification and measurement by Principal Components Analysis. Brain Cogn 27: 288–310. [DOI] [PubMed] [Google Scholar]
- Cliff N (1987): Analyzing multivariate data. New York: Harcourt Brace Jovanovich. [Google Scholar]
- Coles MGH, Gratton G, Kramer AF, Miller GA (1986): Principles of signal acquisition and analysis In: Coles MGH, Donchin E, Porges SW, editors. Psychophysiology: systems, processes, and applications. Amsterdam: Elsevier; p 183–221. [Google Scholar]
- Daffner KR, Mesulam MM, Scinto LFM, Calvo V, Faust R, Holcomb PJ (2000): An electrophysiological index of stimulus unfamiliarity. Psychophysiology 37: 737–747. [PubMed] [Google Scholar]
- Donchin E, Heffley EF (1978): Multivariate analysis of event‐related potential data: a tutorial review In: Otto D, editor. Multidisciplinary perspectives in event‐related brain potential research. Washington, DC: US Government Printing Office; p 555–572. [Google Scholar]
- Ekman P (1992): An argument for basic emotions. Cogn Emot 6: 169–200. [Google Scholar]
- Escera C, Alho K, Winkler I, Näätänen R (1998): Neural mechanisms of involuntary attention to acoustic novelty and change. J Cogn Neurosci 10: 590–604. [DOI] [PubMed] [Google Scholar]
- Fabiani M, Gratton G, Karis D, Donchin E (1987): Definition, identification, and reliability of measurement of the P300 component of the event‐related brain potential In: Acles PK, Jennings JR, Coles MGH, editors. Advances in psychophysiology, Vol 2 London: JAI Press; p 1–78. [Google Scholar]
- Graham FK, Hackley SA (1991): Passive and active attention to input In: Jennings JR, Coles MGH, editors. Handbook of cognitive psychophysiology. Chichester: Wiley; p 251–356. [Google Scholar]
- Holmes A, Vuilleumier P, Eimer M (2003): The processing of emotional facial expression is gated by spatial attention: evidence from event‐related brain potentials. Cogn Brain Res 16: 174–184. [DOI] [PubMed] [Google Scholar]
- Hopfinger JB, Mangun GR (2001): Electrophysiological studies of reflexive attention In: Folk C, Gibson B, editors. Attraction, distraction, and action: multiple perspectives on attentional capture. Amsterdam: Elsevier; p 3–26. [Google Scholar]
- Ito TA, Larsen JT, Smith NK, Cacioppo JT (1998): Negative information weighs more heavily on the brain: the negativity bias in evaluative categorizations. J Pers Soc Psychol 75: 887–900. [DOI] [PubMed] [Google Scholar]
- Kawasaki H, Kaufman O, Damasio H, Damasio AR, Granner M, Bakken H, Hori T, Howard MA 3rd, Adolphs R (2001): Single‐neuron responses to emotional visual stimuli recorded in human ventral prefrontal cortex. Nat Neurosci 4: 15–16. [DOI] [PubMed] [Google Scholar]
- Kenemans JL, Verbaten MN, Roclofs JW, Slangen JL (1989): “Initial‐” and “change‐Ors”: an analysis based on visual single‐trial event‐related potentials. Biol Psychol 28: 199–226. [DOI] [PubMed] [Google Scholar]
- Kenemans JL, Verbaten MN, Melis CJ, Slangen JL (1992): Visual stimulus change and the orienting reaction: event‐related potential evidence for a two‐stage process. Biol Psychol 33: 97–114. [DOI] [PubMed] [Google Scholar]
- Lane RD, Chua PML, Dolan RJ (1999): Common effects of emotional valence, arousal, and attention on neural activation during visual processing of pictures. Neuropsychologia 37: 989–997. [DOI] [PubMed] [Google Scholar]
- Lane RD, Fink GR, Chua PML, Dolan RJ (1997): Neural activation during selective attention to subjective emotional responses. Neuroreport 8: 3969–3972. [DOI] [PubMed] [Google Scholar]
- Lane RD, Reiman EM, Axelrod B, Yun LS, Holmes A, Schwartz GE (1998): Neural correlates of levels of emotional awareness. Evidence of an interaction between emotion and attention in the anterior cingulate cortex. J Cogn Neurosci 10: 525–535. [DOI] [PubMed] [Google Scholar]
- Lang PJ, Greenwald MK, Bradley MM, Hamm AO (1993): Looking at pictures: affective, facial, visceral, and behavioral reactions. Psychophysiology 30: 261–273. [DOI] [PubMed] [Google Scholar]
- LeDoux JE (2000a): Emotion circuits in the brain. Annu Rev Neurosci 23: 155–184. [DOI] [PubMed] [Google Scholar]
- LeDoux JE (2000b): Cognitive‐emotional interactions: listen to the brain In: Lane RD, Nadel IL, editors. Cognitive neuroscience of emotion. Oxford: Oxford University Press; p 129–155. [Google Scholar]
- Mack A, Rock I (1998): Inattentional blindness. Cambridge, MA: MIT Press. [Google Scholar]
- Merikle PM, Smilek D, Eastwood JD (2001): Perception without awareness: perspectives from cognitive psychology. Cognition 79: 115–134. [DOI] [PubMed] [Google Scholar]
- Näätänen R, Gaillard AWK (1983): The orienting reflex and the N2 deflection of the event‐related potential (ERP) In: Gaillard AWK, Ritter W, editors. Tutorials in ERP research: endogenous components. Amsterdam: North‐Holland; p 119–141. [Google Scholar]
- Näätänen R, Picton TW (1986): N2 and automatic versus controlled processes In: Zappoli R, Denoth F, editors. Cerebral psychophysiology: studies in event‐related potentials. Amsterdam: Elsevier; p 169–186. [PubMed] [Google Scholar]
- Northoff G, Richter A, Gessner M, Schlagenhauf F, Fell J, Baumgart F, Kaulisch T, Kotter R, Stephan KE, Leschinger A, Hagner T, Bargel B, Witzel T, Hinrichs H, Bogerts B, Scheich H, Heinze HJ. (2000): Functional dissociation between medial and lateral prefrontal cortical spatiotemporal activation in negative and positive emotions: a combined fMRI/MEG study. Cereb Cortex 10: 93–107. [DOI] [PubMed] [Google Scholar]
- Öhman A (1979): The orienting response, attention, and learning: an information processing perspective In: Kimmel HD, van Olst EH, Orlebeke JF, editors. The orienting reflex in humans. Hillsdale, NJ: LEA; p 443–471. [Google Scholar]
- Öhman A, Flykt A, Esteves F (2001): Emotion drives attention: detecting the snake in the grass. J Exp Psychol Gen 130: 466–478. [DOI] [PubMed] [Google Scholar]
- Öhman A, Hamm A, Hugdahl K (2000): Cognition and the autonomic nervous system: orienting, anticipation, and conditioning In: Cacioppo JT, Tassinary LG, Bernston GG, editors. Handbook of psychophysiology (2nd ed). Cambridge: Cambridge University Press; p 533–575. [Google Scholar]
- Osgood C, Suci G, Tannenbaum P (1957): The measurement of meaning. Urbana, IL: University of Illinois. [Google Scholar]
- Pascual‐Marqui RD (1999): Review of methods for solving the EEG inverse problem. Int J Bioelectromag 1: 75–86. [Google Scholar]
- Pascual‐Marqui RD, Michel CM, Lehman D (1994): Low resolution electromagnetic tomography: a new method for localizing electrical activity in the brain. Int J Psychophysiol 18: 49–65. [DOI] [PubMed] [Google Scholar]
- Peoples LL (2002): Will, anterior cingulate cortex, and addiction. Science 296: 1623–1624. [DOI] [PubMed] [Google Scholar]
- Phillips ML, Drevets WC, Rauch SL, Lane R (2003): Neurobiology of emotion perception. I. The neural basis of normal emotion perception. Biol Psychiatry 54: 504–514. [DOI] [PubMed] [Google Scholar]
- Ploghaus A, Tracey I, Gati JS, Clare S, Menon RS, Matthews PM, Rawlins JN (1999): Dissociating pain from its anticipation in the human brain. Science 284: 1979–1981. [DOI] [PubMed] [Google Scholar]
- Posner M (1995): Neuropsychology: modulation by instruction. Nature 373: 189–199. [DOI] [PubMed] [Google Scholar]
- Potts GF, Tucker DM (2001): Frontal evaluation and posterior representation in target detection. Cogn Brain Res 11: 147–156. [DOI] [PubMed] [Google Scholar]
- Russell JA (1979): Affective space is bipolar. J Pers Soc Psychol 37: 345–356. [Google Scholar]
- Shizgal P (1999): On the neural computation of utility: implications from studies of brain stimulation reward In: Kahneman D, Diener E, Schwarz N, editors. Well‐being: the foundations of hedonic psychology. New York, NY: Russell Sage Foundation; p 500–524. [Google Scholar]
- Siddle D, Stephenson D, Spinks JA (1983): Elicitation and habituation of the orienting response In: Siddle D, editor. Orienting and habituation: perspectives in human research. Chichester: Wiley; p 109–182. [Google Scholar]
- Smith CA, Ellsworth PC (1985): Patterns of cognitive appraisal in emotion. J Pers Soc Psychol 48: 813–838. [PubMed] [Google Scholar]
- Smith NK, Cacioppo JT, Larsen JT, Chartrand TL (2003): May I have your attention, please: electrocortical responses to positive and negative stimuli. Neuropsychologia 41: 171–183. [DOI] [PubMed] [Google Scholar]
- Sokolov EN (1963): Perception and the conditioned reflex. Oxford: Pergamon Press. [Google Scholar]
- Spencer KM, Dien J, Donchin E (1999): A componential analysis of the ERP elicited by novel events using a dense electrode array. Psychophysiology 36: 409–414. [DOI] [PubMed] [Google Scholar]
- Sturm W, de Simone A, Krause BJ, Specht K, Hesselmann V, Radermacher I, Herzog H, Tellmann L, Muller‐Gartner HW, Willmes K (1999): Functional anatomy of intrinsic alertness: evidence for a fronto‐parietal‐thalamic‐brainstem network in the right hemisphere. Neuropsychologia 37: 797–805. [DOI] [PubMed] [Google Scholar]
- Talairach J, Tournoux P (1988): Co‐planar stereotaxic atlas of the human brain. Stuttgart: Thieme. [Google Scholar]
- Tales A, Newton P, Trosciancko T, Butler S (1999): Mismatch negativity in the visual modality. Neuroreport 10: 3363–3367. [DOI] [PubMed] [Google Scholar]
- Teasdale JD, Howard RJ, Cox SG, Ha Y, Brammer MJ, Williams SCR, Checkley SA (1999): Functional MRI study on the cognitive generation of affect. Am J Psychiatry 156: 209–215. [DOI] [PubMed] [Google Scholar]
- Turak B, Louvel J, Buser P, Lamarche M (2002): Event‐related potentials recorded from the cingulate gyrus during attentional tasks: a study in patients with implanted electrodes. Neuropsychologia 40: 99–107. [DOI] [PubMed] [Google Scholar]
- Vitacco D, Brandeis D, Pascual‐Marqui RD, Martin E (2002): Correspondence of event‐related potential tomography and functional magnetic resonance imaging during language processing. Hum Brain Mapp 17: 4–12. [DOI] [PMC free article] [PubMed] [Google Scholar]
- Vuilleumier P (2002): Facial expression and selective attention. Curr Opin Psychiatry 15: 291–300. [Google Scholar]