

Abstract
Printed word frequency can modulate retrieval effort in a task requiring associative semantic judgment. Event‐related fMRI, while avoiding stimulus order predictability, is in theory statistically less powerful than block designs. We compared one event‐related and two block designs that evaluated the same semantic judgment task and found that similar brain regions demonstrated the word frequency effect. Although the responses were lower in amplitude, event‐related fMRI was able to detect the word frequency effect to a comparable degree compared to the block designs. The detection of a frequency effect with the event‐related design also suggests that stimulus–order predictability may not be as serious a concern in block designs as might be supposed. Hum. Brain Mapping 18:186–193, 2003. © 2003 Wiley‐Liss, Inc.
Keywords: fMRI, design methods, language, semantics, word frequency
INTRODUCTION
Two major types of experimental designs utilized in cognitive experiments using fMRI are block and event‐related designs [Buckner et al., 1996; Dale and Buckner, 1997]. In this work, “event‐related” design refers to the “rapid mixed” trials variant of the technique [Donaldson and Buckner, 2001; Miezin et al., 2000]. Block designs have superior statistical power [Friston et al., 1999] and may be more appropriate if the experimental goal is to detect subtle differences in BOLD signal across different test conditions. The temporal structure of the signal arising from block designs allows artifacts arising from non‐physiologic signal fluctuations to be more easily detected by visually inspecting the experimental signal time course. A third advantage of block designs is that experiments using this design are simpler to implement because careful randomization and spacing of different stimulus categories is not required [Aguirre and D'Esposito, 1999; Donaldson and Buckner, 2001].
Rapid mixed event‐related fMRI designs, on the other hand, permit a randomized presentation of stimuli that theoretically reduce confounds arising from stimulus order predictability. The ability to sort trial responses post hoc according to specific behavioral outcomes such as subsequent memory [Wagner et al., 1998], response accuracy [Carter et al., 1998], or latency are other potential advantages of this design. Event‐related designs also allow inspection of different temporal characteristics of responses to varied stimulus categories [Pu et al., 2001]. Despite a number of excellent theoretical discussions on the relative merits of each design [Aguirre and D'Esposito, 1999; Birn et al., 2002; Donaldson and Buckner, 2001; Friston et al., 1999], there have been relatively few comparisons of block and event‐related designs. Most published comparisons have used visual checkerboard stimuli [Janz et al., 2000] or finger opposition [Bandettini and Cox, 2000] and have focused on signal detection efficiency, waveform reproducibility, and methods for optimizing stimulus presentation [Birn et al., 2002]. To date, there have been no published comparisons between block and event‐related designs utilizing tasks engaging higher cognitive function. In these types of tasks, stimulus order effects related to task switching or transient effects of uncertain origin [Konishi et al., 2001] may be important in modulating brain activation.
Optimal design of block design fMRI experiments requires attention to the total number of stimuli used, block length, inter‐stimulus interval (ISI), the relationship of ISI to block length and TR, and the ordering of different stimulus types. In event‐related designs, both the ISI (the interval between two successive stimuli regardless of category) and Intertrial Interval (ITI; the interval between stimuli of a particular category) have to be carefully considered [Aguirre and D'Esposito, 1999; Aguirre et al., 1997; Birn et al., 2002; Donaldson and Buckner, 2001; Friston et al., 1999; Hopfinger et al., 2000; Zarahn et al., 1997]. In addition, the placement and the total number of stimulus categories (including neutral conditions such as fixation) have to be considered. These parameters were adjusted in the present experiments in order to study each method in a best‐case situation. This was intended to improve the likelihood of relative differences in activation between two stimulus levels being detected.
Our interest in relative levels of cortical activation within the left prefrontal region with varied task demands is motivated by the observation that activity in this region is modulated by semantic retrieval effort [Chee et al., 2002]. Specifically, retrieval effort may be influenced by the word frequency of the test items used in a semantic judgment task when the association between test words is controlled. If reliable and reproducible, these differences in prefrontal activation may be used to track neural changes related to the reorganization of semantic memory in the course of gaining language proficiency.
Another important consideration in fMRI experiments is the choice of an appropriate control task. An “ideal” control task is one that allows the cognitive process of interest to be isolated. “Rest” has been criticized as a control condition because activation in regions known to be activated during linguistic tasks has been observed during these periods, possibly a result of “inner speech” [Binder et al., 1999]. “Rest” has also been shown to result in greater medial temporal activation than a number of alternative baseline conditions [Stark and Squire, 2001].
In this report, we present data from three different experiments, two involving block designs with differing control conditions and a third involving an event‐related design. The principal goal of this study was to compare block and event‐related designs to determine if the latter could detect the word frequency effect (WFE). A specific concern was to determine if stimulus‐order predictability might confound experiments where word frequency is modulated. Additionally, we also compared the effect of two different control tasks, size judgment and fixation, on the detection and magnitude of the WFE. The former block design was used in previous studies to evaluate associative semantic processing. The latter design, with fixation as the control condition, is less frequently used in contemporary block design experiments given the concerns about additional mental activity taking place during “rest.” However, evaluating a blocked experiment where fixation was used as the control condition provides a closer comparison between block and event‐related designs.
METHODS
Experiment 1: block design with size judgment
Twelve healthy, right‐handed undergraduate volunteers (8 men, 4 women; aged 19 to 26 years) performed semantic associative judgments on word triplets in a block design fMRI experiment (Fig. 1). They were instructed to choose the word from a pair that was more closely related to the sample stimulus (Fig. 1, top item in each panel) and to press the appropriate button on a two‐button mouse. Details concerning methodology are available elsewhere [Chee et al., 2002].
Figure 1.
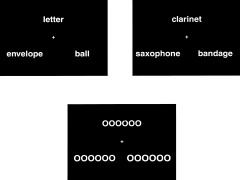
Exemplars of the stimuli used in the semantic judgment tasks (high and low frequency) and control tasks for Experiment 1 (block design with size judgment).
In the control task, the sample comprised a string of “O's,” which varied in length from 3 to 6 (i.e., “OOO” to “OOOOOO”). One of a pair of “O‐strings” was 6% smaller (or larger) than the sample and the other was 12% smaller (or larger). Participants were instructed to choose the item that was closer in size to the sample stimulus and to indicate their choice by pressing the right or left mouse button.
Stimuli with different word frequencies were presented in alternating blocks and counter‐balanced across runs. Each volunteer was exposed to a total of 64 high‐frequency and 64 low‐frequency triplets. Each stimulus appeared for 2.5 sec and was followed by fixation for 0.5 sec. Each task block appeared for 18 sec and control blocks appeared for 30 sec. Block timing was configured keeping the noise power spectrum of fMRI data in mind [Zarahn and D'Esposito, 1997]. The use of irregular ISI relative to block timing was intended to allow sampling of MR signal across different values within a block [Price et al., 1999] and to increase the signal detection sensitivity.
Experiment 2: block design with fixation
Eight healthy, right‐handed volunteers (4 men, 4 women; aged 21 to 30 years) performed semantic associative judgments on word triplets in a block design fMRI experiment, similar to Experiment 1, except that fixation was used as the control condition in this experiment.
Volunteers were scanned in four runs of 102 scans, each involving two blocks of eight triplets for each frequency. Each triplet appeared for 2.0 sec and was followed by fixation for 0.5 sec. Each task block appeared for 20 sec and control blocks appeared for 28 sec. The rest of the experimental parameters were identical to the ones used in Experiment 1.
Experiment 3: event‐related design
Twelve healthy, right‐handed volunteers (8 men, 4 women; aged 18 to 23 years) gave informed consent and performed the same semantic judgment task as in Experiment 1. Volunteers were scanned in four runs of 148 scans, each involving 16 low‐frequency and 16 high‐frequency triplets, totaling 128 stimuli per subject. Each stimulus was presented for 2 sec, synchronized to the timing of the image acquisition (TR). The two stimulus types were randomly presented within each run and separated by fixation times of 4, 6, 8, or 10 sec. This allowed the MR signal to have a range of fluctuation so as to improve hemodynamic response estimation [Donaldson and Buckner, 2001]. The resulting mean ITI was 18.5 sec for each task with a minimum ISI of 6 sec.
Imaging and image analysis
Experiments were performed in a 2.0 T Bruker Tomikon S200 system (Bruker, Karlsruhe, Germany). A blipped gradient‐echo EPI sequence was used with a TR of 2,000 msec, a FOV of 23 × 23 cm and a 128 × 64 pixel matrix. Fifteen oblique axial slices approximately parallel to the AC–PC line 4 mm thick (2‐mm gap) were acquired. High‐resolution anatomical reference images were obtained using a three‐dimensional (3‐D) spoiled‐gradient‐recalled‐echo sequence. A bite‐bar was used to reduce head motion. Following phase correction, the functional images were analyzed using BrainVoyager 2000 v. 4.6 software (Brain Innovation, Maastricht, Holland). Intensity normalization was performed prior to motion correction.
In the spatial domain, a smoothing kernel of 4 mm FWHM was used for the computation of individual activation maps for both designs. Data from all experiments were analyzed without temporal smoothing. The functional MR data sets were first registered to the stack of coplanar T2 images acquired at the end of the study, and these images were then registered to the high‐resolution 3‐D anatomical image of the brain. The resulting realigned data set was then transformed into Talairach space [Talairach and Tournoux, 1988].
In the two block‐design experiments, individual subject statistical maps were computed using a general linear model (GLM) with two explanatory variables: high‐and low‐frequency test items. The expected BOLD signal change was modeled using a modified gamma function (Δ 1.5 sec; τ 2.5) synchronized to blocks of cognitive tasks [Boynton et al., 1996].
For each individual, regions of interest (ROI) in the left prefrontal region (corresponding to Brodmann's areas 44, 45, 47, 6, and 9), encompassing the inferior and middle frontal gyri, were defined by sampling volumes that were active in both low‐ and high‐frequency semantic judgment relative to control task. Within each individual ROI, the average MR signal from the six control scans before each block was used as the baseline against which percent signal change of the semantic task block was calculated. Blocks of the same frequency were then averaged. The first four transitional scans of the block were discarded in calculating the mean percent signal change value for each frequency. Paired t‐tests comparing high‐ and low‐frequency words were performed for each ROI using individual percent signal change values.
For the event‐related experiment, hemodynamic responses to task stimuli were modeled using deconvolution [Beauchamp et al., 2002]. Eight predictors for each semantic judgment task were estimated, corresponding to a temporal resolution of 2 s. A GLM with these 16 predictors was applied to every voxel. Statistical maps were generated using the third, fourth, and fifth predictors of each set, which accounted for most of the variance. Two sets of estimates (responses to low‐ and high‐frequency word triplets) were obtained from the time series of the prefrontal ROI, defined in the same way as for the block design experiments. These were presented as percent signal change curves for each ROI. For each curve, a representative value of percent signal change was obtained by averaging across the third, fourth, and fifth predictors. Percent signal change values for high‐ and low‐frequency words associated with each ROI were compared across volunteers using paired t‐tests as described for the block design experiment.
Group level activation maps were created using a multi‐subject GLM for each experimental design. For both block designs, the two predictors, high and low frequency, were set as explanatory variables. For the event‐related design, only the third, fourth, and fifth predictors of each set were used. Regions activated above an uncorrected threshold of P < 0.001 for high‐ or low‐frequency items were displayed (Fig. 2). Activation peaks of interest were also tabulated (see Table II).
Figure 2.
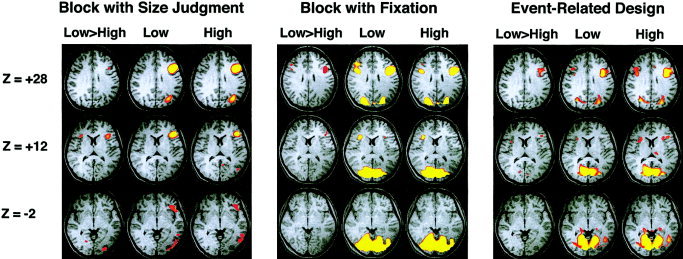
Axial brain slices showing areas activated in the low‐ and high‐frequency conditions as well as in the contrast between these two conditions in the block and event‐related experiments. Group level data is depicted (n = 12 for the block design using size judgment as a control, n = 8 for the block design using fixation as control, and n = 12 for the event‐related design).
Table II.
Talairach co‐ordinates of the activation peaks of regions jointly activated by low and high frequency words as well as the regions active in the contrast between low and high frequency words with each of the experimental designs
| Brain region and Brodmann's area | Block design (size) | Block design (fixation) | Event‐related design | |||||||||
|---|---|---|---|---|---|---|---|---|---|---|---|---|
| x | y | z | F | x | y | z | F | x | y | z | F | |
| Low and high frequency | ||||||||||||
| Frontal | ||||||||||||
| Inferior frontal gyrus (BA 44) | −40 | 13 | 27 | >50 | −46 | 7 | 30 | >50 | −37 | 12 | 27 | 36 |
| 35 | 16 | 26 | 32 | — | — | — | — | 38 | 14 | 30 | 25 | |
| Inferior frontal gyrus (BA 44) | 32 | 22 | 8 | 28 | 37 | 6 | 30 | >50 | 28 | 23 | 9 | 36 |
| Precentral gyrus (BA 4) | — | — | — | — | −43 | −31 | 40 | 40 | 35 | 1 | 30 | >50 |
| Cingulate gyrus/SMA (BA6/24) | −2 | 1 | 47 | >50 | −4 | 3 | 51 | >50 | −6 | 7 | 45 | >50 |
| Temporal | ||||||||||||
| Middle temporal gyrus (BA 21) | −55 | −44 | −3 | >50 | — | — | — | — | — | — | — | — |
| Fusiform gyrus (BA 37) | −43 | −56 | −12 | >50 | * | * | * | −45 | −50 | −9 | >50 | |
| Parietal | ||||||||||||
| Superior parietal lobule (BA 7) | −31 | −65 | 38 | 45 | −26 | −57 | 46 | >50 | −31 | −64 | 44 | 50 |
| 24 | −65 | 40 | >50 | 28 | −67 | 39 | 45 | |||||
| Occipital | ||||||||||||
| Lingual gyrus (BA 18) | — | — | — | — | −40 | −70 | −9 | >50 | −28 | −69 | −9 | >50 |
| Lingual gyrus (BA 19) | — | — | — | — | — | — | — | — | −16 | −62 | 4 | >50 |
| Low > high frequency | ||||||||||||
| Frontal | ||||||||||||
| Inferior frontal gyrus (BA 44) | −40 | 15 | 28 | 4.4 | −42 | 15 | 28 | 4.5 | −40 | 10 | 28 | 6.4 |
| Inferior frontal gyrus (BA 44/45) | −46 | 27 | 17 | 6.4 | −46 | 29 | 21 | 4.2 | −31 | 28 | 11 | 4 |
| 32 | 22 | 8 | 5.6 | — | — | — | — | 33 | 12 | 12 | 4.4 | |
| Anterior cingulate (BA 6) | −4 | 14 | 44 | 3.6 | — | — | — | — | −5 | 17 | 45 | 5.6 |
| — | — | — | — | — | — | — | — | 5 | 12 | 45 | 4.8 | |
Left fusiform activation in the Block (fixation) experiment was not clearly separable from the occipital activation.
Figure 3.
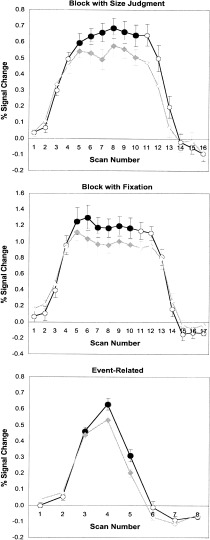
Percent signal change graphs depicting group‐averaged responses to low‐ and high‐frequency stimuli obtained from the left prefrontal ROI in the event‐related and block designs. Error bars depict 1 SE.
To facilitate a comparison in the size of the WFE, a normalized index of difference (NID) of activation was computed from percent signal change values obtained from the left prefrontal ROI in the low‐ (low) and high‐frequency (high) conditions. The value of NID = 2(low − high)/(low + high). The use of this index was intended to provide a metric that afforded comparisons in effect size between individuals or study sessions given that unlike PET, fMRI does not provide absolute values of signal change. NID was computed for all three experiments.
RESULTS
Behavioral results
Mixed design ANOVA, with frequency (high and low) as within‐subject variable and experimental group (1, 2, and 3) as between‐subject variable revealed significant main effects of frequency on reaction time [F(1,29) = 132.97, P < 0.001] and accuracy [F(1,29) = 35.22, P < 0.001]. Low‐frequency items took longer to process and performance was less accurate. There was an interaction between frequency and experimental group [F(2,29) = 4.64, P < 0.05] for reaction time. While the accuracy differences are statistically significant, the mean performance level was excellent (above 90%) with either type of test stimulus (Table 1).
Table I.
Behavioral responses associated with the two block experiments and the event‐related experiment
| Block design (size) | Block design (fixation) | Event‐related design | ||||
|---|---|---|---|---|---|---|
| High frequency | Low frequency | High frequency | Low frequency | High frequency | Low frequency | |
| Accuracy | 0.98 (0.02) | 0.93 (0.05) | 0.98 (0.03) | 0.92 (0.05) | 0.98 (0.02) | 0.94 (0.04) |
| RT (sec) | 1.17 (0.10) | 1.29 (0.13) | 1.06 (0.06) | 1.21 (0.05) | 1.12 (0.09) | 1.20 (0.09) |
Values in parentheses represent 1 SD.
Regions activated when subjects performed semantic judgments
Semantic judgments involving both low‐ and high‐frequency words relative to size judgment (Experiment 1) activated a network of areas that included the left prefrontal (BA 9, 44), left posterior temporal (BA 21, 22), inferior temporal (BA 37), and left parietal (BA 7) regions (Fig. 2). Activation was strongly left lateralized. These findings are concordant with those reported previously [Chee et al., 2002]. Similar regions were activated for low‐ and high‐frequency stimuli although the spatial extent of activation was greater with low‐frequency stimuli.
In the block design with fixation as the control condition (Experiment 2), prefrontal and parietal activations were more bilateral compared to the previous experiment. There was no posterior‐lateral temporal activation. The inferior temporal activation blended with extensive bilateral occipital activation and a definite peak could not be clearly identified (Table II, Fig. 2). Since mouse button presses were not required in the fixation control, primary motor and premotor activation were observed in the contrast between task and control.
In the event‐related design, left prefrontal (BA 9, 44) and parietal (BA 7) regions were activated as with the block design. Activation in the prefrontal region was more bilateral as in the case of the Experiment 2, additionally involving the right prefrontal and parietal regions. The concordance of peak activations in the left prefrontal region between the two designs was fair to good (Table II, Fig. 2).
BOLD signal differences between low and high frequency stimuli
At the group level, the direct contrast between low‐ and high‐frequency stimuli using voxel‐by‐voxel image analysis revealed a WFE in the left inferior prefrontal region in all three experiments. The region was within 1.0 cm. of the region previously reported as demonstrating the WFE [Chee et al., 2002]. At lower thresholds, a small right prefrontal (Experiments 1 and 3) and anterior cingulate (Experiments 1 and 3) activation emerged in the contrast of conditions.
An ROI‐based percent signal change analysis applied to the left prefrontal region showed statistically significant differences in BOLD signal between the low‐ and high‐frequency conditions in Experiment 1 [t(1,11) = 2.90, P < 0.05], Experiment 2 [t(1,7) = 4.71, P < 0.005], and Experiment 3 [t(1,11) = 4.33, P < 0.005]. The mean NID, an index of the size of the WFE, for Experiments 1, 2, and 3 were very close, 0.19 (SE 0.07), 0.18 (SE 0.03), and 0.16 (SE 0.04), respectively. While these figures are not directly comparable because of the different volunteers involved, the slight differences in stimulus timing and the difference in baselines used, there is an indication that the size of the WFE is at least comparable across block and event‐related fMRI designs.
DISCUSSION
The present data demonstrate that event‐related fMRI is capable of demonstrating the WFE as well as a block design. Event‐related fMRI has several advantages in the context of language‐related tasks. The ability to segregate correct from incorrect responses in particular may be of use in evaluating the effects of language learning over time (this feature was not exploited in the present study because of the high accuracy rates). Specifically, it might be interesting to determine patterns of activation as a result of a shift in balance between correct and incorrect responses that occur as a result of differences in language proficiency. As a proof of this concept, anterior cingulate activity was significantly increased in error trials where subjects were performing a variant of a working memory task [Carter et al., 1998].
In addition to magnitude of activation differences, event‐related designs have the potential to show task‐dependent variations in temporal response profiles [Buckner and Braver, 1999]. However, we did not observe any differences in onset, peak latency, or a delay in activity decay in the present study. The only other language processing study to date that has evaluated hemodynamic responses, did not show any differences in time‐to‐peak or the width (FWHM) of responses when comparing Chinese and English verb generation [Pu et al., 2001].
Compared to block designs, event‐related designs have a theoretically lower detectability of activations. Detectability in this setting refers to the estimation of the response amplitude of different designs [Bim et al., 2002]. The present dataset is interesting in this regard because there appears not to be a compromise in the detectability of the WFE with the event‐related design. Although it is the relative difference in activation elicited by low‐ and high‐frequency word stimuli that is of interest, greater sensitivity of detection of activation will presumably contribute to the detection of the contrast. The comparison of absolute magnitude of percent signal change across the two experiments, requires one to be mindful of the effect of the different baseline conditions used in the two experiments [for an interesting set of comparisons see Stark and Squire, 2001]. In the present experiments, the perceptual baseline (size judgment task) used in the block design experiment reduced the peak activation magnitude compared to semantic judgment with fixation.
After discounting the effects of different baselines, the fact remains that the detected signal change in the event‐related study is perhaps higher than expected from theoretical considerations. It is notable that most simulation as well as empirical data relating to the optimization of event‐related fMRI has involved visual or motor tasks in which modeling the effects of stimulus duration in the form of an impulse response function may be appropriate [Birn et al., 2002; Hagberg et al., 2001; Liu et al., 2001]. In tasks involving higher cognition such as in the present experiment, the assumption of a linear time‐invariant system may not apply. Even in an experiment involving flashing checkerboards and finger opposition, empirical data have shown a lowering of amplitude in the event‐related design of approximately 35% whereas the predicted lowering was 65% [Bandettini and Cox, 2000]. This suggests that non‐linear, time‐varying effects may be more prevalent than previously thought. It is known that rate‐of‐presentation of language tasks exerts non‐linear effects on the modulation of cerebral blood flow by language tasks [Price et al., 1996]. While speculative until further empirical evidence emerges, we posit that non‐linear neuronal responses that are greater at the onset of linguistic processing and that interact with rate‐of‐presentation effects, may underlie the relative preservation of response magnitude in the event‐related relative to the block design experiment.
In summary, we found that the WFE is quite robust and reproducible in terms of effect size and spatial location across different volunteers and with block as well as event‐related designs. This should encourage other investigators to take advantage of the benefits of event‐related designs in exploring higher cognitive functions.
REFERENCES
- Aguirre GK, D'Esposito M (1999): Experimental design for brain fMRI In: Bandettini PA, editor. Functional MRI. Berlin: Springer‐Verlag; 369–380. [Google Scholar]
- Aguirre GK, Zarahn E, D'Esposito M (1997): Empirical analyses of BOLD fMRI statistics. II. Spatially smoothed data collected under null‐hypothesis and experimental conditions. Neuroimage 5: 199–212. [DOI] [PubMed] [Google Scholar]
- Bandettini PA, Cox RW (2000): Event‐related fMRI contrast when using constant interstimulus interval: theory and experiment. Magn Reson Med 43: 540–548. [DOI] [PubMed] [Google Scholar]
- Beauchamp MS, Lee KE, Haxby JV, Martin A (2002): Parallel visual motion processing streams for manipulable objects and human movements. Neuron 34: 149–159. [DOI] [PubMed] [Google Scholar]
- Binder J, Frost J, Hammeke T, Bellgowan P, Rao S, Cox R (1999): Conceptual processing during the conscious resting state: a functional MRI study. J Cogn Neurosci 11: 80–95. [DOI] [PubMed] [Google Scholar]
- Birn RM, Cox RW, Bandettini PA (2002): Detection versus estimation in event‐related fMRI: choosing the optimal stimulus timing. Neuroimage 15: 252–264. [DOI] [PubMed] [Google Scholar]
- Boynton GM, Engel SA, Glover GH, Heeger DJ (1996): Linear systems analysis of functional magnetic resonance imaging in human VI. J Neurosci 16: 4207–4221. [DOI] [PMC free article] [PubMed] [Google Scholar]
- Buckner RL, Bandettini PA, O'Craven KM, Savoy RL, Petersen SE, Raichle ME, Rosen BR (1996): Detection of cortical activation during averaged single trials of a cognitive task using functional magnetic resonance imaging. Proc Natl Acad Sci USA 93: 14878–14883. [DOI] [PMC free article] [PubMed] [Google Scholar]
- Buckner RL, Braver TS (1999): Event‐related functional MRI In: Bandettini PA, editor. Functional MRI. Berlin: Springer‐Verlag; p 441–450. [Google Scholar]
- Carter CS, Braver TS, Barch DM, Botvinick MM, Noll D, Cohen JD (1998): Anterior cingulate cortex, error detection, and the online monitoring of performance. Science 280: 747–749. [DOI] [PubMed] [Google Scholar]
- Chee MWL, Hon NHH, Caplan D, Lee HL, Goh J (2002): Frequency of concrete words modulates prefrontal activation during semantic judgments. Neuroimage 16: 259–268. [DOI] [PubMed] [Google Scholar]
- Dale AM, Buckner RL (1997): Selected averaging of rapidly presented individual trials using fMRI. Hum Brain Mapp. 5: 329–340. [DOI] [PubMed] [Google Scholar]
- Donaldson DI, Buckner RL (2001): Effective paradigm design In: Smith SM, editor. Functional MRI: an introduction to methods. Oxford: Oxford University Press; p 177–196. [Google Scholar]
- Friston KJ, Zarahn E, Josephs O, Henson RN, Dale AM (1999): Stochastic designs in event‐related fMRI. Neuroimage 10: 607–619. [DOI] [PubMed] [Google Scholar]
- Hagberg GE, Zito G, Patria F, Sanes JN (2001): Improved detection of event‐related functional MRI signals using probability functions. Neuroimage 14: 1193–1205. [DOI] [PubMed] [Google Scholar]
- Hopfinger JB, Buchel C, Holmes AP, Friston KJ (2000): A study of analysis parameters that influence the sensitivity of event‐related fMRI analyses. Neuroimage 11: 326–333. [DOI] [PubMed] [Google Scholar]
- Janz C, Schmitt C, Speck O, Hennig J (2000): Comparison of the hemodynamic response to different visual stimuli in single‐event and block stimulation fMRI experiments. J Magn Reson Imag 12: 708–714. [DOI] [PubMed] [Google Scholar]
- Konishi S, Donaldson DI, Buckner RL (2001): Transient activation during block transition. Neuroimage 13: 364–374. [DOI] [PubMed] [Google Scholar]
- Liu TT, Frank LR, Wong EC, Buxton RB (2001): Detection power, estimation efficiency, and predictability in event‐related fMRI. Neuroimage 13: 759–773. [DOI] [PubMed] [Google Scholar]
- Miezin FM, Maccotta L, Ollinger JM, Petersen SE, Buckner RL (2000): Characterizing the hemodynamic response: effects of presentation rate, sampling procedure, and the possibility of ordering brain activity based on relative timing. Neuroimage 11: 735–759. [DOI] [PubMed] [Google Scholar]
- Price CJ, Moore CJ, Frackowiak RS (1996): The effect of varying stimulus rate and duration on brain activity during reading. Neuroimage 3: 40–52. [DOI] [PubMed] [Google Scholar]
- Price CJ, Veltman DJ, Ashburner J, Josephs O, Friston KJ (1999): The critical relationship between the timing of stimulus presentation and data acquisition in blocked designs with fMRI. Neuroimage 10: 36–44. [DOI] [PubMed] [Google Scholar]
- Pu Y, Liu H, Spinks JA, Mahankali S, Xiong J, Feng C, Tan LH, Fox PT, Gao J (2001): Cerebral hemodynamic response in Chinese (first) and English (second) language processing revealed by event‐related functional MRI. Magn Reson Imag 19: 643–647. [DOI] [PubMed] [Google Scholar]
- Stark CE, Squire LR (2001): When zero is not zero: the problem of ambiguous baseline conditions in fMRI. Proc Natl Acad Sci USA 98: 12760–12766. [DOI] [PMC free article] [PubMed] [Google Scholar]
- Talairach J, Tournoux P (1988): Co‐planar stereotaxic atlas of the human brain. New York: Thieme Medical Publishers. [Google Scholar]
- Wagner AD, Schacter DL, Rotte M, Koutstaal W, Maril A, Dale AM, Rosen BR, Buckner RL (1998): Building memories: remembering and forgetting of verbal experiences as predicted by brain activity. Science 281: 1188–1191. [DOI] [PubMed] [Google Scholar]
- Zarahn E, D'Esposito M (1997): A trial‐based experimental design for fMRI. Neuroimage 6: 122–138. [DOI] [PubMed] [Google Scholar]
- Zarahn E, Aguirre GK, D'Esposito M (1997): Empirical analyses of BOLD fMRI statistics. I. Spatially unsmoothed data collected under null‐hypothesis conditions. Neuroimage 5: 179–197. [DOI] [PubMed] [Google Scholar]