Abstract
Ensembles of coupled nonlinear systems represent natural candidates for the modeling of brain dynamics. The objective of this study is to examine the complex signal produced by coupled chaotic attractors, to discuss their potential relevance to distributed processes in the brain, and to illustrate a method of detecting their contribution to human EEG morphology. Two measures of quantifying the behavior of coupled nonlinear systems are presented: a measure of phase synchrony and a novel measure of intermittent phase desynchronization. These are used to quantify the behavior of numerical examples of coupled chaotic attractors. Experimental evidence of their contribution to the morphology of the human alpha rhythm is then illustrated in a study of EEG recordings from 40 healthy human subjects. Amplitude‐adjusted phase‐randomized surrogate data is used to test the null hypothesis that the observed patterns of phase coherence can be described by purely linear methods. Statistical analysis reveals that this null hypothesis can be robustly rejected in a small number (∼4%) of EEG epochs. These findings are discussed with reference to the adaptive function and complex dynamics of the brain. Hum. Brain Mapping 15:175–198, 2002. © 2002 Wiley‐Liss, Inc.
INTRODUCTION
The organization of the human brain is characterized by networks of coupled neural systems across many scales of length [Nunez, 1995]. Local neural circuits include cortical macrocolumns and subcortical nuclei (such as the basal ganglia) and typically serve functionally specific roles. They are constituted by dense local interconnections between excitatory cells and inhibitory interneurons. Coupling between these local regions arises by virtue of sparse long‐range excitatory projections, such as cortico‐cortical fibers. This coupling facilitates large‐scale integrative processes involving coordination between specialized networks [Friston et al., 1995]. Monoaminergic neurons from ascending brain stem nuclei, utilizing second messenger systems, regulate the functional synaptic strength of these long‐range connections, hence modulating the strength of regional interdependence [Cooper et al., 1991]. Finally, the voltage‐dependant nature of potassium and calcium channels in the neural membrane ensures that the dynamics within and between these systems are highly nonlinear.
Coupled nonlinear dynamical systems thus serve as natural candidates for models of neural dynamics. This study overviews the behavior that occurs when chaotic systems are coupled together and presents experimental evidence for their contribution to the EEG. Chaotic synchrony and intermittent desynchronization are defined and illustrated with numerical examples. It is argued that both these processes may play important and complimentary roles in brain function. In particular, chaotic synchrony may facilitate integrative functions requiring co‐operative processing in different networks across the brain. Desynchronization may allow the brain to switch flexibly between one coherent state and another [Kelso et al., 1992; Kwapieri et al., 1998]. Research into the role of autonomous chaotic systems has been the focus of much research in neuroscience [Basar, 1980; Pritchard and Duke, 1992]. The theory of coupled nonlinear systems may represent an important conceptual evolution in this area [Friston, 2000].
Synchronization in nonlinear and neural systems
The role of synchronous activity in the cerebral cortex of the brain is currently of special interest, because the coherent firing of neurons and neural ensembles has been proposed as a mechanism of 'binding' the activity in parallel networks during sensory perception and information processing [Gray et al., 1989; Miltner et al., 1999; Rodriguez et al., 1999; Singer, 1995; Stopfer et al., 1997). Thus far the majority of studies of coherence in neuroscience data have employed linear measures of interdependence, such as the coherence function [Achermann and Borbely, 1998] and cross‐correlation [Gray et al., 1989; Stopfer et al., 1997]. Experiments suggesting that nonlinear dynamics play a role in the firing patterns of individual neurons [Faure and Korn, 1997], local cortical networks [Freeman, 1990] and in the generation of the EEG [Pezard et al., 1996; Rombouts et al., 1995; Stam et al., 1999], however, motivate an investigation into synchronous behavior between coupled chaotic systems.
Mathematically, an ensemble of coupled chaotic subsystems take the form,
| (1) |
where xi is the m‐dimensional state space vector and Fi the local nonlinear dynamics of the i‐th subsystem. H(x) is the function that introduces the global contribution of coupling from all other nodes to the local evolution of each node. Thus, a system of n‐coupled nodes is represented by the evolution of the state space vector, x = {x1,…,xn} in the phase space, ℜ︁nxm. There are two parameters; C is the coupling strength between nodes; a parameterizes the local dynamics within each node, such as the density of a certain membrane channel. The value of a is chosen so that in the absence of coupling (C = 0) the local dynamics are chaotic. If the local dynamics are all identical (F i = F j), and the coupling symmetrical, then the system (equation 1) leaves the symmetry manifold (xi = xj) invariant. That is, orbits within this manifold remain there for all time. It is common to distinguish between the dynamics tangential (within) and transverse (normal) to this manifold. Similarly, one can distinguish between the tangential and transverse Lyapunov exponents [Ashwin et al., 1999]. The latter describe the growth or decay of perturbations in the direction transverse to the invariant manifold.
Pecora and Carroll [1990] initially reported synchronization between two identical chaotic systems coupled to a common signal. When this occurs the Euclidean distance between the two chaotic systems approaches zero. Thus, orbits of equation (1) approach a chaotic attractor supported by the m ‐dimensional symmetry manifold. Such systems are said to be in identical synchronization (IS). If the transverse Lyapunov exponents for this manifold are all negative then the state of synchronized chaos is stable to desynchronizing perturbations.
If the system (equation 1) is deformed in any way such that the perfect symmetry of the local dynamics (F i ≠ F j) or the coupling is destroyed, then the symmetry manifold is no longer invariant under the action of equation (1) and thus IS is not achievable. Other forms of synchrony between the coupled systems, however, are still possible. Afraimovich et al. [1986] first described ‘almost complete coincidence’ of the orbits of coupled non‐identical chaotic oscillators. Rulkov et al. [1995] described this phenomenon, where there is a predictable, but not identical, relationship between each local node as generalized synchronization (GS) Rosenblum et al. [1996>] have also demonstrated chaotic phase synchrony (PS) between coupled nonidentical chaotic systems. Two systems are said to be phase synchronized if their phases, ϕ1(t) and ϕ2(t) satisfy,
| (2) |
That is, the phase difference between the systems does not grow with time. This may occur even if the amplitudes of the systems remain uncorrelated. Phase synchronization has been illustrated between cardiac and respiratory rhythms [Schaffer et al., 1998] and in microscopic neural system [Makarenko and Llinas, 1998]. We will refer to the phase synchronization manifold as that subregion of phase space to which orbits of equation (1) are confined when equation (2) is satisfied. It is important to note that the nature and existence of this manifold has not yet been rigorously studied.
Desynchronization in nonlinear and neural systems
Desynchronization is also observed in a wide range of biological phenomena, particularly neural systems. For example, it is well established that the amplitude of synchronized alpha activity (8–13 Hz) in human electroencephalographic (EEG) recordings decreases when subjects open their eyes or process visual stimuli. This process, called event‐related desynchronization, correlates with a variety of physiological, behavioral and cognitive parameters [Boiten et al., 1992; Clochon et al., 1996; Klimesch et al., 1997; Pfurtscheller, 1977; Sergeant et al., 1987; Stam and Tavy Keunen, 1993; Van Winsum et al., 1984]. The term desynchronization, however, has typically been applied to measures of alpha power, not to the alpha phase coherence. Desynchronization is inferred from visual inspections of EEG recordings that display fast, irregular and discordant behavior when alpha power diminishes [Steriade et al., 1990]. This methodological problem has only recently been addressed [Haig and Gordon, 1998] and is rigorously defined here.
Desynchronization in coupled nonlinear systems have been shown to occur in a variety of contexts, typically as excursions away from the state of IS. With linear coupling between identical systems, desynchronization is observed near the stability boundary of robust synchronization. This occurs because periodic orbits, dense on the supporting synchronization manifold, lose transverse stability as the coupling strength is diminished [Heagy et al., 1998; Pikovsky and Grassberger, 1991]. Although the transverse Lyapunov exponents for the synchronized state are negative when averaged over long time intervals, they are briefly (locally) positive whenever the orbits pass close to a transversally unstable orbit [Maistrenko et al., 1998; Rulkov and Sushchik, 1997]. This leads to finite excursions away from the synchronization manifold, corresponding to intermittent bursts of desynchronization. Patterns of desynchronization have been studied in large assemblies of coupled nonlinear systems [Heagy et al., 1995; Kapitaniak and Chua, 1994; Marino et al., 1998; Pecora 1998]. Although these arrays synchronize with weak coupling, desynchronizing bifurcations occur when either the coupling strength or the number of systems in the array exceeds a critical threshold. Desynchronization in these arrays is also due to transversely unstable periodic orbits and, by breaking symmetry, leads to the appearance of macroscopic structure. Thus desynchronization occurs in both temporal and spatial domains.
The focus of this study is on the phenomena of chaotic phase synchronization and intermittent phase desynchronization, and their potential contribution to the EEG alpha rhythm.
EXPERIMENTAL TECHNIQUES
Nonlinear data analysis
We are interested in quantifying the cooperative and complex behavior between two discretely sampled systems, generating the bivariate time series;
Where each time series arises from a local multivariate process, and between which there is possibly a mutual interdependence. Initially, we use numerical data from coupled chaotic attractors where the equations are set in advance. Subsequently EEG data is used, in which case the time series reflect neuronal field potentials summed over several square centimeters of cortex. We now describe the method by which these time series were analyzed.
Phase synchronization entropy
As with [Rosenblum et al., 1996, 1997] the Hilbert transform was used to extract the phase from each of the time series. If
 |
(3) |
is the Hilbert transform of the j‐th time series, then the analytic signal
| (4) |
uniquely determines the amplitude A j(t) and phase ϕj(t). Subtraction of the phases yields the relative phase
| (5) |
If this remains constant for some integers, n and m, then we have n:m phase‐locking (we only examine the case n = m). Because this is a circular measure, its temporal evolution is contained on a cylindrical phase space. Following Tass et al. [1998], an index based on the Shannon entropy was employed to characterize the distribution of the relative phase. Thus,
| (6) |
with
| (7) |
and
| (8) |
where the interval ϕ ∈ [0,2π] is partitioned into N regular bins and p k is the measured probability of the relative phase ϕ(t) falling into bin k. Normalized in this way, λ corresponds the relative Shannon entropy of the distribution of ϕ(t). Maximum entropy, a uniform distribution, corresponds to λ = 1 (no phase synchronization) and minimum entropy (perfect phase locking) corresponds to λ = 0. The choice of N in equation (8) is arbitrary although λ does converge with increasing N, allowing accuracy limits to be chosen. Figure 1 shows an example of the convergence of λ with increasing N for a typical time series produced by one of the numerical systems defined below.
Figure 1.
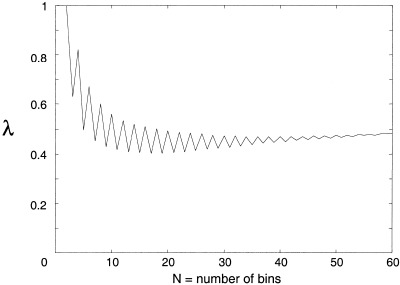
Phase entropy, λ vs. N = number of partitions in equations (7) and (8).
Index of intermittent phase desynchronization
The total entropy of a signal can be reduced by two mechanisms; divergence of individual events from equiprobability, and divergence of successive events from independence [Gatlin, 1972]. The Shannon entropy only measures the probability distribution of individual events, and is thus only sensitive to the first of these mechanisms. Yet the information capacity of a signal (the potential to store useful information) is most efficiently increased by utilizing both mechanisms [Gatlin, 1972]. To measure the reduction of entropy due to dependence between events, high‐order conditional entropies based on transition probabilities between events must be incorporated [Freund and Rateitschak, 1998]. For long signals and a finely partitioned event space, this rapidly becomes computationally prohibitive. The presence of large transient deviations of the Shannon entropy from its asymptotic mean is an index of long‐range event interdependence, however, and therefore correlates closely with information capacity. We employed a computationally simple measure that detects this phenomenon.
The time series are divided into n regular intervals and the Shannon subentropy λi is calculated for each of the subintervals. A new measure δn is then introduced,
 |
(9) |
where,
| (10) |
Thus δn is the standard deviation of the phase entropy across n‐subdivisions. To avoid an arbitrary choice of subdivision duration, the range that δ takes can be examined across different orders of time. For a fixed length of time series data, this is achieved by varying n. This may permit a natural time scale to be defined as the length of the subintervals that maximizes δ.
To examine the relationship between δ and long‐range interdependence, consider an ergodic source. Subintervals of n consecutive data points produced by this source are known as n‐tuples (n‐tuples commencing with event x i are n i‐tuples). For a source with no memory (zero‐order), the average Shannon entropy of all n i‐tuples in the signal will be equivalent, because the probability spectrum of all events in any n‐tuple is the same as probability spectrum of the source. If the source has order n, however, then x i biases the probability spectrum of the remainder of that n‐tuple. Therefore the average entropy of all the n i‐tuples will not equal the average entropy of all the n j‐tuples (i ≠ j). The stronger the probability interdependence, the more dissimilar will be these entropies and hence the greater the standard deviation of measured n‐block entropies in the signal. On the other hand, events occurring subsequent to the n‐tuple are, by construction, not biased by x i and have the same probability spectrum as the source. Thus, if m ≫ n, then the m ‐tuples will all have similar entropy, which will approximate the entropy of the source. Thus the variability of the Shannon entropy amongst the m‐tuples will approach zero. This is illustrated formally in the Appendix.
The existence of significant variations in λ (and thus high δ) over several orders of magnitude therefore implies a complex signal with interdependence across several time scales. This optimizes the balance between reliability/error detectability and message variability and therefore the information capacity of the signal [Ebeling 1995; Freund and Rateitschak, 1998; Gatlin, 1972].
Surrogate data construction
As discussed above, the numerical data sets are generated by nonlinear equations set in advance. In the experimental situation, the properties of the underlying system are partially understood, but the exact mechanisms generating the EEG are still far from being fully elucidated. More specifically, although the existence of long‐range interdependence in the brain is to be expected due to the underlying anatomy, it is possible that only linear interdependence appears in the EEG. Finite length data sets, measurement noise, digital filtering, and 1/f power‐frequency distributions, such as occurs in the EEG, are all known to give rise to spurious identification of nonlinearity [Osborne and Provencale, 1989; Rapp et al., 1993; Ruelle, 1990]. To control for these, surrogate data sets were constructed. These share the linear properties of the experimental data (amplitude distribution, spectral density function and cross‐spectral density) but are altered so as to destroy nonlinear structure. The nonlinear measures, δ and λ, are extracted from these data sets. If these are statistically different from their experimental counterparts, then it is possible to reject the null hypothesis that the experimental data comes from a purely linear process.
An algorithm combining an amplitude‐adjusted [Theiler et al., 1992] and multivariate [Pritchard and Theiler, 1994; Rombouts et al., 1995] technique was employed. The technique is as follows. The first step is to generate two independent Gaussian time series, z 1(t) and z 2(t), from a pseudorandom number generator with the same length as the original data. Next, the sequence of each Gaussian time series is re‐ordered to match the rank of the corresponding original time series. That is, if x 1(t) is the n‐th smallest of all the x 1's, then z 1(t) is the n‐th smallest of the z 1's. The same is done for the z 2's. The re‐ordered z's are said ‘to follow’ the x's. Then F, the discrete Fourier transform operator is applied to the re‐ordered z's to obtain
| (11) |
for j = 1,2. Two modified phase randomized transforms are then obtained by rotating the phase at each frequency by a random variable, ϕj(f), where ϕj is chosen independently from the interval [0,2π]. This is achieved by multiplying the complex amplitude at each frequency by e iϕ(f), giving
| (12) |
Two constraints are necessary at this step. To guarantee that the inverse Fourier transform will be real, the phases are chosen such that ϕj(−f) = −ϕj(f). Second, to preserve the cross‐correlations between the surrogate time series, both transforms must be rotated by the same random variable at each frequency, ϕ1(f) = ϕ2(f) for all f. An inverse Fourier transform is then taken of each modified transform. This produces a surrogate time series, z̃j(t) for each Gaussian time series, zj(t). Finally, the original time series, x 1(t) and x 2(t), are each re‐ordered to follow the ranks of the corresponding z̃ j(t). This produces bivariate surrogate time series, x̃ 1(t) and x̃ 2(t), which share the same amplitude distribution, autocorrelation function and cross‐spectral density functions as x 1(t) and x 2(t). In practice, there is some distortion of the spectrum toward white noise, due to finite precision arithmetic.
Numerical examples of coupled chaotic attractors
The behavior of coupled nonlinear systems, and their quantification by means of these measures is illustrated here using numerical examples of coupled Lorenz attractors. These are chosen because they have been widely studied and their properties are well known. Unstable periodic orbits are dense on the attracting manifold, which is critical to the phenomenon of desynchronization. The effects of both symmetric and asymmetric coupling were examined because of the importance of both in modeling brain region interactions, which are generally mutually, but asymmetrically, interconnected. Linear and nonlinear coupling were also investigated, as this has recently been proposed as an important distinction in neural systems [Friston, 2000]. These coupled systems are not intended to exactly model the dynamics of the brain, but rather to exemplify the type of dynamic interactions thought to be relevant to understanding the behavior of the cortex.
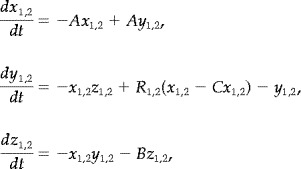
The Lorenz system is a set of three ordinary differential equations derived as an approximation for convection flow limited to two dimensions [Lorenz, 1963]. For linear coupling, the following systems are considered,
 |
(13) |
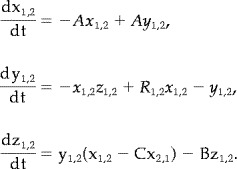
with control parameters R 1,2, and coupling parameter 0 ≤ C ≤ 1. With A = 10, B = 8/3 and R > 26 the system has a chaotic attractor; two ‘wings’ each around a repelling spiral, separated by an unstable saddle point. In the autonomous (uncoupled) system, orbits switch between each wing after a series of expanding rotations take them close to the unstable manifold of the saddle point. The unstable fixed points and a typical orbit of the Lorenz attractor are illustrated in Figure 2. The saddle point makes the dynamics considerably complex with multiple unstable manifolds. All results in this study are for A = 10, B = 8/3, R 1,2 = 28 unless stated. Thus, these are identical and symmetrically coupled and the symmetry manifold is invariant. For nonlinear coupling the following systems are considered,
 |
(14) |
Figure 2.
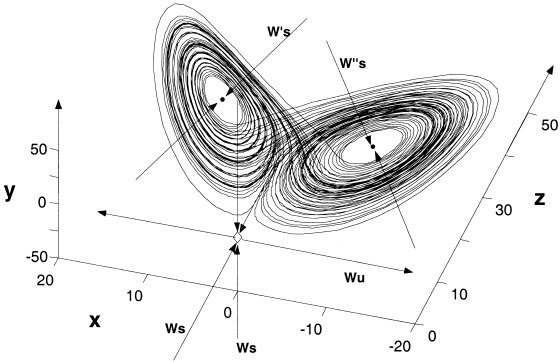
Orbits on the Lorenz attractor and the three hyperbolic fixed points. Two unstable spiral points (dots) each with a single attracting inset (W′ s and W″ s) are separated by an unstable saddle point at the origin (diamond) with a stable planar inset (W s × 2) and single repelling outset (W u). Axes are the dependant variables in equation (13) with C = 0.
Finally, asymmetric coupling is analyzed by modifying the differential equation for z with the addition of a single nonlinear term to one attractor only. Hence, we consider,
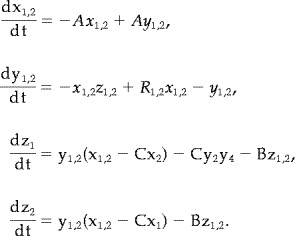 |
(15) |
By breaking the symmetry of the coupling, this term destroys the invariance of the symmetry manifold. Numerical integrations were carried in MatLab using a Runge‐Kutta technique.
Human EEG data
Subjects and data acquisition
Subjects were 40 adults (age 20–54) who disavowed psychiatric or neurological illness. An electrode cap was used to acquire data from the International 10‐20 System of scalp sites. Linked earlobes served as the reference. Skin resistance at each site was <5 kΩ. Data was digitized and collected at a rate of 250 Hz. Artifacts caused by eye movement were corrected offline. Data was collected from each subject during 130 sec of a resting eyes‐open paradigm, and 130 sec during a resting eyes‐closed paradigm [for further details, see Haig and Gordon, 1998].
Data processing
EEG data was filtered into the alpha range using a high‐order finite impulse response digital band‐pass filter (8–13 Hz). To avoid confounding of inter‐electrode coherence by the effects of a common reference electrode [Fein et al., 1988], bi‐electrode derivations were used. Four pairs of derivations were used to study: 1) posterior inter‐hemispheric (O1‐P3/O2‐P4); 2) anterior interhemispheric (F3‐C3/F4‐C4); and (3,4) fronto‐posterior intrahemispheric interactions (O1‐P3/F3‐C3 and O2‐P4/F4‐C4). These derivatives were obtained by simply subtracting one measured potential from the other in each electrode pair before further analysis. The EEG was studied in epochs of 4.096 sec (29 epochs/subject). For each epoch, a single (overall) value of λ was calculated for further analysis. The index of desynchronization, δ, was derived from 4, 8, and 16 subdivisions, representing timescales of 1,024 msec, 512 msec, and 256 msec respectively.
Statistical analysis
In each subject, 19 realizations of surrogate data were generated, each from a randomly chosen 4.096 second interval of experimental data. The surrogate data was then filtered and subject to the same analysis as the experimental data. Hence, for each subject, an ensemble of surrogate measures were derived,
for i = 1,2,…19. These were used to generate a mean and SD for each measure in each subject. This permitted calculation of the z‐score for testing of the null hypothesis in each EEG epoch. Generating 19 surrogate data sets allows confidence intervals to be set at 95% (P = 0.05). To account for repeated calculation of the same measures, a Bonferroni correction was made. Therefore,
| (16) |
is the corrected P‐value after n repeated observations. Thus, for each subject, a P‐value of 1.8 × 10⁻³ (n = 29 epochs) was set for rejection of the null hypothesis for each measure in any epoch, whereas P = 4.4 × 10⁻⁴ (n = 29 × 4 indices) was set for the rejection of any measure in any epoch. For the whole data set the corresponding values were P = 4.4 × 10⁻⁵ (n = 29 × 40 subjects) for each measure in each epoch, and P = 1.1 × 10⁻⁵ (n = 40 × 29 × 4) for any measure in each epoch. Epochs where the null hypothesis was rejected were visually inspected to ensure that they were artifact‐free.
Finally, to calibrate the approximate number of false positive rejections of the null hypothesis, a surrogate data set was used as an experimental time series [Theiler and Prichard, 1997]. That is, the amplitude‐adjusted algorithm was applied to the raw EEG. This served as a pseudo‐experimental test series, and was statistically compared to ‘surrogate surrogate’ data. Clearly, any rejections of the null hypothesis reflect methodological limitations, and not nonlinearity in the surrogate time series, which has been removed.
RESULTS
Numerical simulations
Chaotic phase synchronization with linear coupling
The behavior of two identical Lorenz attractors with linear coupling (equation 13) exhibits a transition from disordered behavior to robust PS with increasing coupling strength. An example of equation (13) with C = 0.15 is presented in Figure 3. Figure 3a shows both attractors, Figure 3b shows the time series of x 1(t) and x 2(t). The phase difference ϕ (Fig. 3c) and the entropy λ (Fig. 3d) reveal the transition to phase locking after an initial unstable transient. Figure 3e shows the relationship between phase entropy and coupling strength with the transition to robust PS evident as the rapid decrease of phase entropy at C ≅ 0.12.
Figure 3.
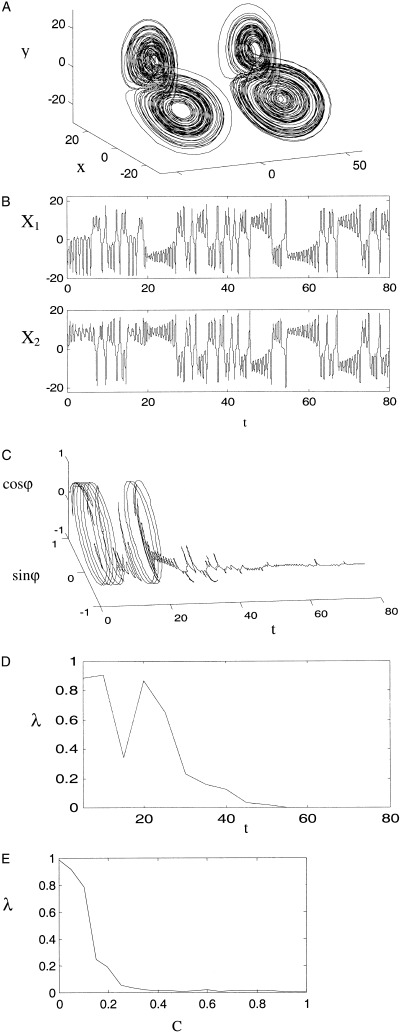
Timeseries and phase entropy for linearly coupled Lorenz systems (equation 13) for coupling strength C = 0.13. (a) Coupled chaotic attractors, with second attractor offset to the right for graphical clarity. (b) Chaotic timeseries for x 1 (top) and x 2 (lower). (c) Temporal evolution of the phase difference with axes of sinϕ, cosϕ and time. (d) Temporal evolution of the phase entropy, with timeseries divided into 16 subintervals. (e) Phase entropy as a function of linear coupling strength.
Phase synchrony and desynchronization with nonlinear coupling (equations 14, 15)
In the ‘undercoupled’ case (C ≅ 0) the two Lorenz systems show no phase synchrony and their phases vary chaotically even if identical (R 1 = R 2) and started in phase. Thus the cylindrical space of the phase difference evolution is almost uniformly covered and λ is close to 1. As the coupling is increased (C ≅ 0.1), epochs of synchronous behavior appear. An example of this is illustrated in Figure 4. In Figure 4b, an epoch of phase synchronized behavior is evident from t = 50 to t = 70. The two systems occupy opposite wings of their attractors during this epoch. In Figure 4c, this epoch manifests as a restriction of the relative phase to one partition of the interval ϕ ∈ [0,2π], typically at π phase difference, ϕ(t) ≅ π. This results in a distinct but brief lowering of λ, apparent in Figure 4d.
Figure 4.
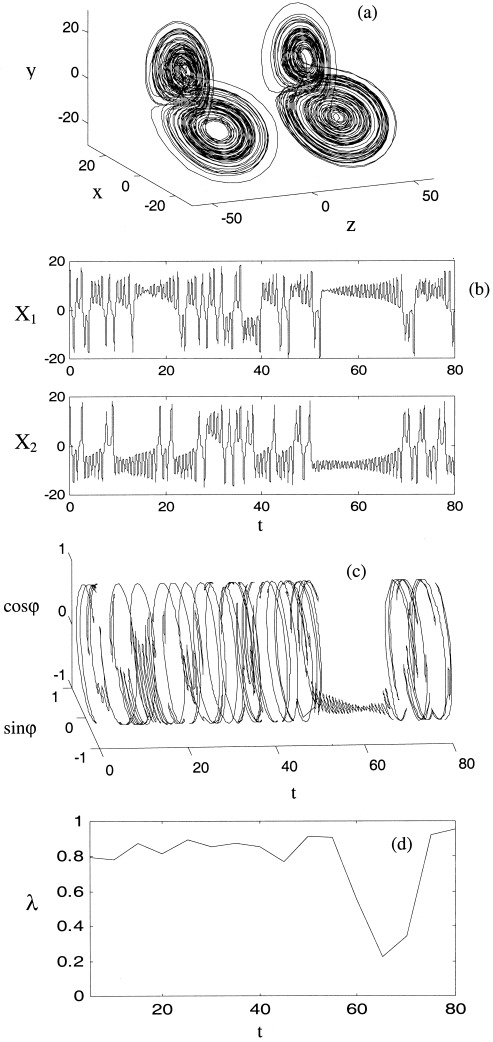
Exemplar synchronous epoch between coupled Lorenz systems (equation 14) with weak nonlinear coupling, C = 0.1. Axes and panels are as for Figure 3a–d.
When the coupling is increased further (C ≅ 0.4), these synchronous epochs are longer and more ordered, resulting in more frequent epochs of low λ. Between these epochs the dynamics are characterized by bursts of high amplitude desynchronized behavior as illustrated in Figure 5. There causes irregular switching between epochs of low λ and bursts of high λ as evident if Figure 5d. The bursts correspond to long excursions in phase space that subsequently return around the inset of one of the unstable spirals. These excursions are have much greater amplitude than those that occur close to the stability boundary in the linearly coupled system. This is due to the contribution of the nonlinear coupling term to the escape orbit dynamics.
Figure 5.
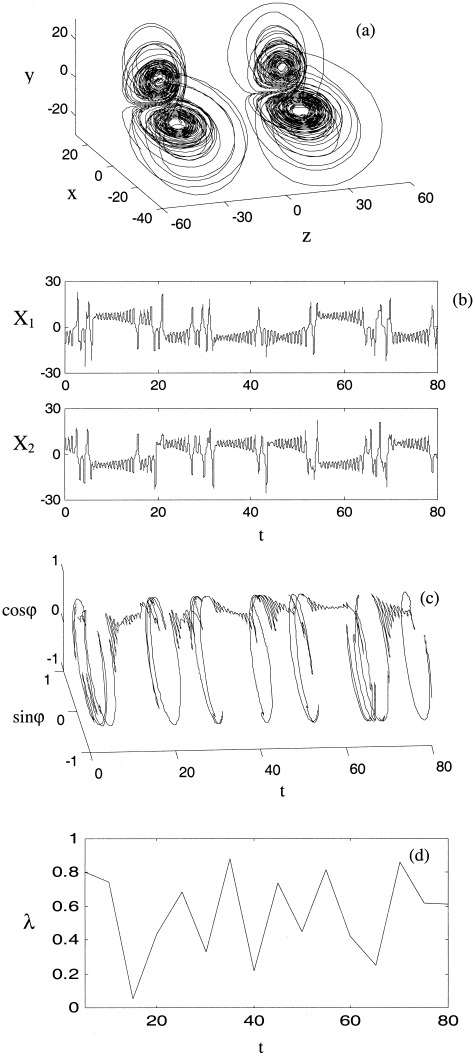
With moderate nonlinear coupling (C = 0.4) high amplitude excursions appear, corresponding to desynchronous bursts. A this point, phase entropy has approached its global minimum (λ = 0.6) for these non‐linearly coupled systems (equation 14). Axes and panels are as for Figure 3a–d.
If the coupling is increased further the desynchronous bursts appear more frequently, occasionally resulting in orbits that escape well away from the region of the autonomous attractors as evident in Figure 6a. In the ‘overcoupled’ case (C ≅ 0.8) these desynchronized orbits dominate phase space causing entropy to rise again. In the asymmetrically coupled case these orbits leave the vicinity of the unstable fixed points once C > 0.75 and our numerical computation time diverges. In the symmetric case phase entropy approaches its maximum value as C ≅ 1. Figure 7 shows the overall relationship between phase entropy and nonlinear coupling. Both symmetric (solid) and asymmetric coupling (dashed) are associated with a global minimum of λ. This is in contrast with the linearly coupled system (equation 13), where λ falls and remains at zero above a critical threshold.
Figure 6.
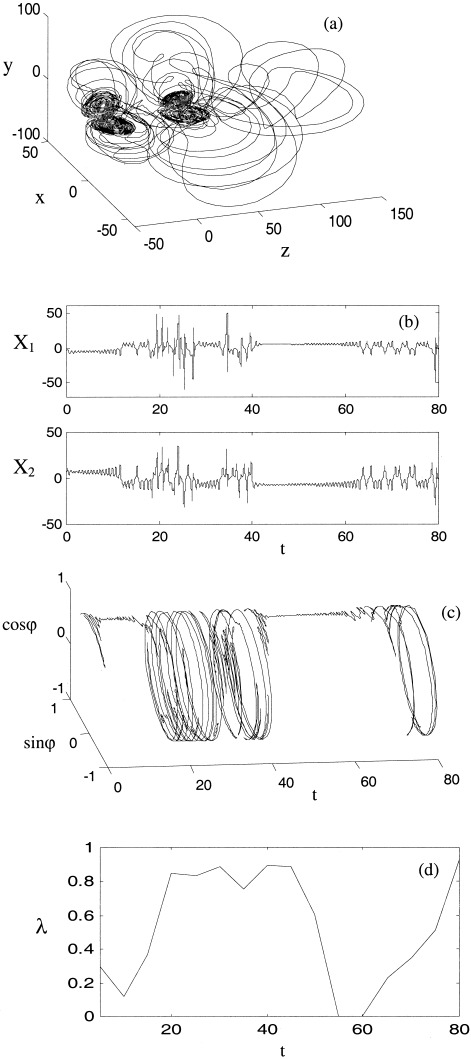
With strong nonlinear coupling the desynchronous excursions are increasingly long and disorganized. Axes and panels are as for Figure 3a–d. This example is with asymmetric coupling, C = 0.6.
Figure 7.
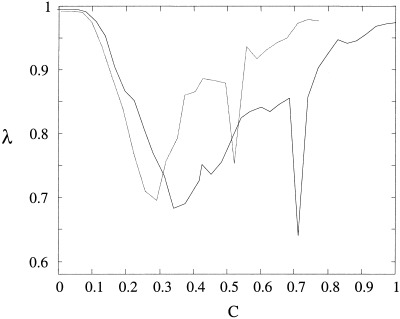
The relationship between phase entropy and coupling strength for the coupled Lorenz systems with nonlinear, symmetrical coupling (solid) and non‐linear asymmetric coupling (dot‐dot). Results are the average of 20 runs at each coupling strength with t = 160′ and exclusion of an initial transient of t = 160′.
The irregular nature of the phase desynchronizations is illustrated by the index δ. The value of this index against the strength of nonlinear coupling across the time‐scale of t = 5 (32 subdivisions of t = 160) is illustrated in Figure 8. Note that the irregular switching rises to a plateau, and slowly drops off once the desynchronized behavior begins to dominate the behavior of the systems. In Figure 9 is presented the value of this index across two orders of magnitude of time‐scales. Weak, moderate and strong nonlinear coupling have been calculated and compared to two white noise signals. Note the strong maximum in irregular desynchronization at the scale of t = 5. This is the time‐scale at which visual inspection of the time series exhibits the greatest amount of complex behavior.
Figure 8.
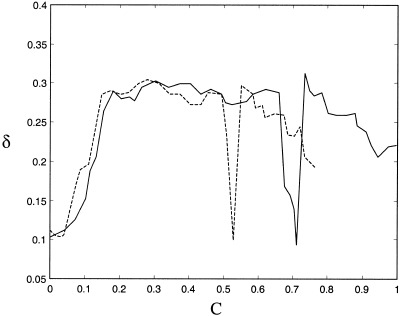
Shannon entropy irregularity δ versus nonlinear coupling strength for the systems (equation 14) and (equation 15). Irregularity here is measured for 32 subdivisions across a timescale of 160′ after exclusion of an initial transient of 160′. The results shown are the averages of twenty runs at each coupling strength. Due to prohibitive computation time, results for system (equation 15) were only calculated up to C = 0.75.
Figure 9.
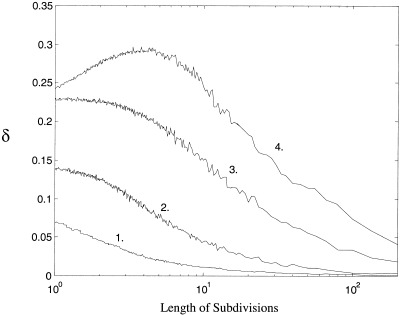
Entropy irregularity across increasing lengths of temporal subdivisions for the coupled Lorenz system (equation 3). Lower axis is length scale of subdivisions and vertical axis is the standard deviation of phase entropy δ across that scale. Four representative averages are plotted. 1. Phase difference between two white noise signals, 2. Weak non‐linear coupling, C = 0.03, 3. Strong non‐linear coupling, C = 0.97. 4. Moderate nonlinear coupling C = 0.48. 5. Initial transients have been excluded.
In summary, nonlinear coupling induces complex behavior involving both chaotic phase synchronization and desynchronous bursting. Unlike linear coupling, however, increasing the coupling strength does not inhibit the bursting, but instead causes high amplitude excursions. This leads to a global minimum of entropy and maximum of the index of information capacity, δ, at intermediate coupling strengths.
Idiosyncratic almost‐periodic attractors
Of additional interest is the localized appearance of almost‐periodic attractors not seen in the autonomous state. An example of these is shown in Figure 10. In the symmetric case (equation 14) the attractors appear at C = 0.72, and in the asymmetric case (equation 15), C = 0.54. They account for the deep local minima of λ and δ at these values in Figures 7 and 8. They are stable to a constant 10% white noise perturbation applied to the dependent variables, and also are stable to small perturbations in coupling strength and the control parameter, R. Hence they appear to occur in a large region of parameter values. They occur after a transient of variable length. For coupling strengths of C = 0.69 and C = 0.73 in equation (14) and C = 0.51 and C = 0.57 in equation (15) these attractors are themselves unstable transients. The existence of such (orderly) transients, however, still cause local reductions in λ and δ at these values of C. These attractors are ‘idiosyncratic’ in that they arise by virtue of sudden stabilization of desynchronized orbits, and not as gradual transformations of the autonomous attractors. Variants occur with many other types of nonlinear coupling, arguing that they may be ‘typical’ for nonlinearly coupled chaotic attractors.
Figure 10.

Idiosyncratic almost‐periodic attractors (a) with non‐linear coupling, C=0.54 in (3) The first system is offset to the right for graphical clarity. The behavior of these systems in the time domain (b), (c) produces high amplitude spike and waveforms. (d) The relationship in phase space between the Lorenz attractor and an idiosyncratic attractor. The Lorenz attractor is now a chaotic ruin (an initial transient).
Symmetry manifold and the phase synchronization manifold
In this section we examine the relationship of the phase synchronization manifold to the symmetry manifold. This is achieved by viewing the orbits in the phase space spanned by (X = x1–x2, Y = y1–y2, Z = z1–z2), with the symmetry manifold thus located at the origin. Figure 11 illustrates an example of chaotic phase synchrony due to strong linear coupling, (equation 13) between identical attractors. In this case, phase synchronization is associated with an asymptotic approach to the origin in this projection, as shown in Figure 11. In Figure 11a and 11b, it can be seen that this occurs as an attracting spiral inset. Figure 11c shows the Euclidean distance of these orbits from the origin against time on a log‐linear axis, revealing that this orbit approaches the symmetry manifold exponentially (with the decay rate determined by the transverse Lyapunov exponents). This same association between phase synchrony and an approach to the symmetry manifold also occurs with symmetric nonlinear coupling. Thus, in these systems, with symmetric coupling and identical parameters, PS occurs by virtue of the more restrictive IS. In these symmetrical cases the phase synchronization manifold is supported on the symmetry manifold.
Figure 11.
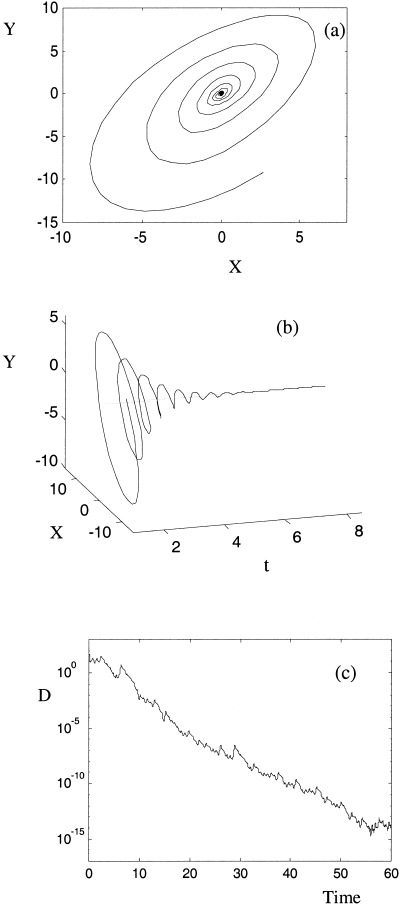
(a) Behavior near the synchronization manifold for the linearly coupled Lorenz system (equation 13) with C = 0.128 in the X,Y‐plane. The SM is the red diamond. (b) Temporal evolution of this orbit around the SM. (c) D = Euclidean distance to the manifold over a longer time interval, shows an exponential approach to the SM.
With nonidentical attractors in equation (13) or equation (14) or asymmetric nonlinear coupling (equation 15), the orbits approach a complex manifold in the vicinity of the symmetry manifold, but not the symmetry manifold itself, during epochs of phase synchrony. During these epochs orbits spiral outwards from two repelling points located symmetrically beside the symmetry manifold in the X,Y‐plane. Figure 12a displays an example of one such orbit, with the entrance and exit trajectories to this region shown. Figure 12b illustrates the temporal behavior of one such transient, showing that the system switches between the two repelling spirals during phase synchrony. Figure 12c displays three of these epochs, separated by desynchronous bursts. The phase synchronization manifold appears to be an invariant set in the vicinity of the symmetry manifold with a fractal structure, consistent with observations of the structure of the generalized synchronization manifold [Hunt et al., 1997]. Phase desynchronizations correspond to bursts away from this complex synchronization manifold. Whilst the geometry is more complex, the intermittent behavior of phase desynchronization is similar to its counterpart in symmetrical systems.
Figure 12.
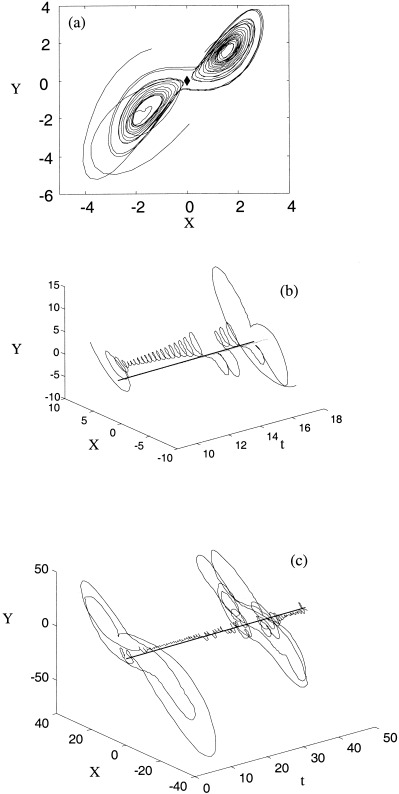
(a) Behavior near the synchronization manifold for the Lorenz system with asymmetric nonlinear coupling (equation 4) and C = 0.35 in the X,Y‐plane, (b) Temporal evolution of this orbit. (c) Longer time interval with two synchronous epochs and two long desynchronizations.
In summary, the introduction of asymmetry into the coupled Lorenz systems acts to ‘pull’ the manifold of phase synchronization away from the symmetry manifold, creating a more complex manifold. This is important as it shows that chaotic PS is robust to symmetry‐breaking perturbations, as can be expected to occur in neural systems.
Impact of phase‐randomization on phase synchronization
Numerical simulations also allow examination of the phase‐randomization algorithm and the specificity and sensitivity to nonlinearity of the two measures of phase dynamics. Time series data from system (equation 14) with C = 0.35 is compared to surrogate data. The original time series and its nonlinear and linear properties are shown in Figure 13a–e. The corresponding surrogate analysis are illustrated in Figure 13f–j. The time series (Fig. 13a,f), relative phase evolution (Fig. 13b,g) and phase complexity (Fig. 13c,h) are markedly different. The variation of phase entropy is also markedly decreased, as is evident in panels (Fig. 13c) and (Fig. 13h). This occurs because the high frequency components of the Fourier transform associated with the desynchronous bursts are spread throughout the time series. The spectral density function (Fig. 13d,i) and cross‐spectral density (Fig. 13e,j), however, are almost identical. As remarked before, there is some distortion of the spectrum toward white noise, due to rounding error. Thus, although the linear properties are almost identical, the nonlinear structure is clearly destroyed. Calculating the nonlinear indices for surrogate data sets constructed from equation (14) with varying coupling strength yields mean values of λ = 9855 and δ = 0. 0625 with no dependence on C . Thus, for example, the null hypothesis of linear correlations only between X 1 and X 2 for the time series in Fig. 11 can be rejected with P = 3 × 10−75! In contrast, with C = 0 the null hypothesis could not be rejected (P = 0. 9067). Linearly correlated nonlinear time series, constructed by summation of uncoupled time series (e.g., X 1 = 0.6X 1 + 0.4X 2, X 2 = 0.4X 1 + 0.6X 2) were also tested against surrogate data. Once again, the null hypothesis could not be rejected.
Figure 13.
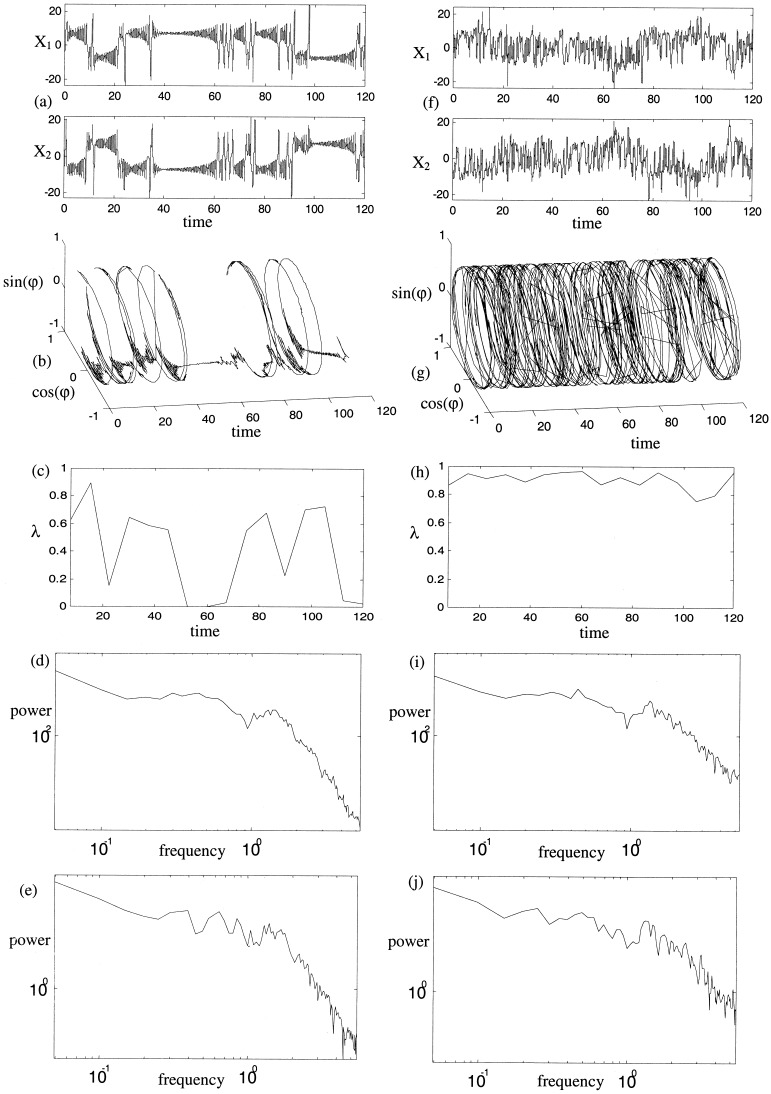
Linear and nonlinear analysis of coupled nonlinear system and surrogate data. (a) Time series calculated from equation (14) with C = 0.35. (f) Surrogate data constructed from (a). (b,g) Evolution of relative phase from each of these time series. (c,h) Phase entropy calculated from each of these. (d,i) Spectral density functions of the original and surrogate time series. (e,j) Cross‐spectral density functions of the original and surrogate time series. Nonlinear indices are λ = 0.53, δ8 = 0.30, δ16 = 0.32 for the original time series and λ = 0.99, δ8 = 0.03, δ16 = 0.06 for the surrogate data.
Thus the surrogate data algorithm preserves the linear properties of the bivariate time series but destroys the nonlinear interdependencies in the presence of nonlinear desynchronizations.
Experimental data
Statistical results
A total of 1,160 (29 × 40) 4.096 sec epochs of EEG were analyzed in each paradigm (eyes open and eyes closed) and for each electrode pairing. The results of the statistical analysis of these epochs are presented in Tables I and II. The results for the posterior interhemispheric bipolar derivations (O1‐P3/O2‐P4) in the eyes‐open recordings are discussed in the following paragraphs, then compared to the other electrode pairs and the results for the eyes closed recordings.
Table I.
Experimental results for posterior eletrode pairs, O1‐P3/O2‐P4, eyes open and eyes closed recordings. Results are the percentage of times each of the indices were outside the confidence intervals for the null hypothesis. A: Uncorrected (p = 0.05). B: Corrected within each subject (p = 1.7 × 10⁻³). C: Corrected for entire database (p = 4.3 × 10⁻⁵).
| λ | δ4 | δ8 | δ16 | |
|---|---|---|---|---|
| Eyes open | ||||
| A | 16.47 | 10.95 | 9.83 | 8.97 |
| B | 8.10 | 2.76 | 2.50 | 1.10 |
| C | 6.21 | 1.38 | 1.47 | 0.86 |
| Eyes closed | ||||
| A | 25.90 | 13.10 | 10.00 | 6.03 |
| B | 10.69 | 3.10 | 1.64 | 0.86 |
| C | 7.84 | 1.90 | 0.86 | 0.26 |
Table II.
Experimental results for all recordings. Values are the number of epochs containing at least one index outside the confidence intervals for the null hypothesis (p < 1.1 × 10⁻⁵). Electrode placement 1. O1‐P3/O2‐P4, 2. O1‐P3/C3‐F3, 3. O2‐P4/C4‐F4, 4. C3‐F3/C4‐F4.
| Recording | Electrode placement | Total epochs n (%) |
|---|---|---|
| Eyes open | 1 | 53 (4.6%) |
| 2 | 32 (2.7%) | |
| 3 | 33 (2.8%) | |
| 4 | 29 (2.5%) | |
| Eyes closed | 1 | 49 (4.2%) |
| 2 | 37 (3.2%) | |
| 3 | 33 (2.8%) | |
| 4 | 39 (3.4%) |
Results for eyes open, posterior inter‐hemispheric recordings
Across all of the epochs studied, the rejection of the null hypothesis occurred significantly more often than expected by chance (5%), and more often for the phase entropy measure, λ than for each of the δ's. Thus the null hypothesis could be rejected in 16.5% of cases for λ, and in 10.9%, 9.8%, and 9.0% for δ at the scale of 1024 msec, 512 msec, and 256 msec respectively (with P = 0.05). When corrected for repeating the analysis of all epochs in each subject the statistics fell accordingly. Thus, the null hypothesis could be rejected on average for 8.1% of epochs for λ, and 2.8%, 2.5%, and 1.1% for δ at each respective scale in each subject. Once again, these are higher than the expected values (0.17%). When corrected further for repeating the measures across the whole database, the null hypothesis could be rejected in 6.2% of all epochs for λ, and in 1.4%, 1.5%, and 0.86% for δ at the scale of 1,024 msec, 512 msec, and 256 msec respectively. Thus the null hypothesis could be rejected in some epochs for all of the indices, although most often for λ.
The results for determining the presence of nonlinear phase interdependence were calculating after further correcting these statistics for repeating the four different measures on each epoch. The null hypothesis was rejected in those artifact‐free epochs containing at least one measure outside the corrected confidence intervals. In each subject, an average of 2.5 of the 29 epochs (8.7%) were thus found to be outside the confidence intervals for the null hypothesis. There was considerable variety between subjects. Ten of the subjects contained no such epochs. The others contained on average 3.3 epochs each (range = 1–23). For the entire database, a total of 53 (4.5%) of the 1,160 epochs of EEG yielded at least one nonlinear index outside the corrected confidence intervals. Inspection of these epochs revealed that the experimental λ values were less than their surrogate counterparts, whereas the experimental δ values were greater. This is consistent with the rejection of the null hypothesis in the direction of the predicted hypothesis of nonlinear phase desynchronization.
Results for ‘surrogate surrogate’ data
The rate of null hypothesis rejection for surrogate data should be equivalent to the chosen alpha power, 5%. The actual rate of rejection was slightly higher, 7.9%. There was no significant difference between any of the indices. Using the same criteria as above, 7 epochs from the data set of 1,160 (0.60%) allowed rejection of the null hypothesis. This represents the rate of false positives on the whole data set.
Comparison of electrode locations, and with eyes open or closed
Similar analysis of the other bipolar pairings revealed that the posterior sites contained the largest number of nonlinear epochs during both eyes open and eyes closed recordings. The difference between the posterior sites and the other sites was most marked during the eyes open recording. In these recordings, these figures were 4.6% (O1‐P3/O2‐P4), 2.7% (O1‐P3/C3‐F3), 2.8% (O2‐P4/C4‐F4), 2.5% (C3‐F3/C4‐F4). In the eyes closed recordings, the corresponding results were 4.2%, 3.2%, 2.8% and 3.4% respectively.
Analysis of epochs for which the null hypothesis could be rejected
Inspection of the raw EEG of the epochs identified as nonlinear generally revealed short episodes of coherent alpha activity of irregular intervals, separated by variable length low‐amplitude, high‐frequency activity. Two exemplar epochs are illustrated in Figures 14 and 15. All nonlinear indices for both these epochs were outside the corrected confidence intervals for the null hypothesis (P < 4.3 × 10⁻⁵). The epoch in Figure 14 shows a distinct interval of phase synchronization that is similar to the numerical example of weak nonlinear coupling in Figure 4. By comparison, Figure 15 illustrates several epochs of phase synchronization separated irregularly by desynchronous bursts, and is similar to the numerical example of moderate nonlinear coupling in Figure 5.
Figure 14.
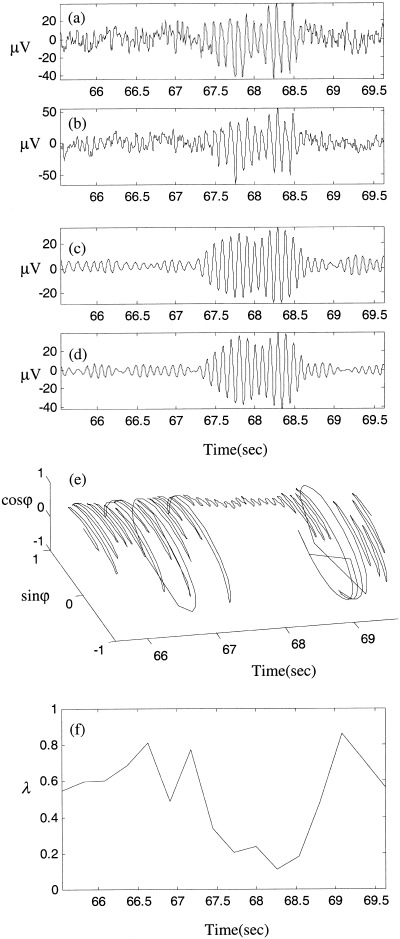
Illustration of an epoch identified as containing nonlinear interdependence. (a,b) Unfiltered recordings of bipolar derivations O1‐P3 and O2‐P4 respectively. (c,d) Same signals after 8–13 Hz bandpass filtering. (e) Evolution of their phase difference and (f) shows phase entropy for 16 subdivisions of the time interval.
Figure 15.
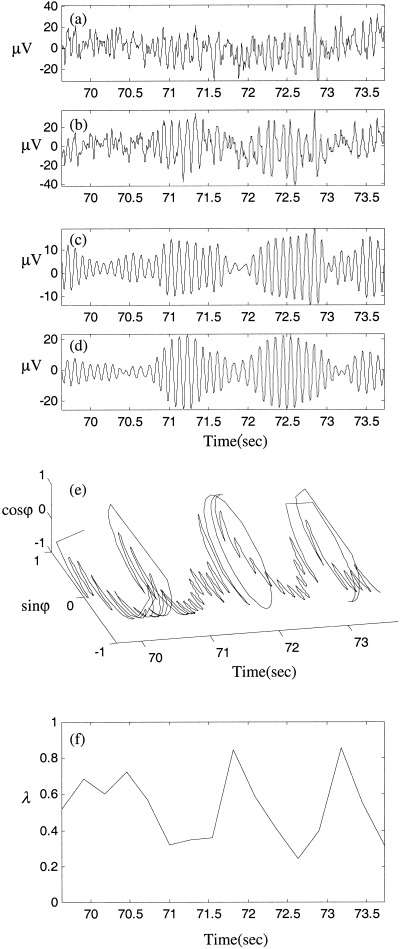
Same as Figure 14, for a different EEG epoch.
Linear coherence analysis of the epochs identified as ‘nonlinear’ reveals a large peak in the alpha range, which is completely absent in the database as a whole. This is shown in Figure 16.
Figure 16.
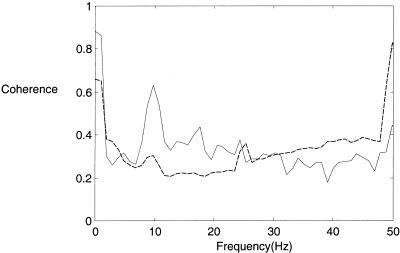
Coherence analysis of the epochs identified as containing nonlinear interdependence (solid) compared to all epochs (dashed) in the eyes open, posterior recordings obtained by a moving Welch window technique.
DISCUSSION
In this article, we have studied the brain as an ensemble of local nonlinear neural systems interconnected by long‐range nonlinear (cortico‐cortical) coupling. This is an extension of previous studies using coupled nonlinear oscillators to model the brain that have generally focused on synchronous periodic oscillations [e.g., Frank et al., 2000]. Setting the local dynamics into the chaotic regime permits a greater variety of behavior, which has been the focus of this study.
With nonlinear coupling between chaotic attractors, there exists a trade‐off between epochs of chaotic phase synchrony and bursts of increasingly long desynchronized excursions. This causes a global minimum of entropy and maximum of information capacity at intermediate coupling strengths. Such an optimum state is robust to changes in parameter values and coupling symmetry. Nonlinearly coupled nonlinear systems thus represent a simple mechanism to generate a complex signal that can be optimized by tuning either local (nonlinear) or global (modulatory) parameters. One of the fundamental properties of neural systems is their optimization according to environmental requirements. According to the current perspective, this could be achieved through modulation of cortico‐cortical coupling by subcortical monoamine neurons or resetting of local network sensitivity (nonlinear gain).
The appearance of ‘idiosyncratic’ periodic‐like attractors in small regions of parameter space punctuates the trend toward a global optimum state. In particular, they produce sharp local minima in the index of information capacity. The waveform of these attractors in the time‐domain is similar to the appearance of the EEG during petit‐mal epilepsy convulsions. During such episodes, subjects are unable to process sensory information or produce meaningful behaviors, thus suggesting that the cortex has been transiently compromised by a suboptimal dynamical state. This is consistent with the nonlinear indices for these waveforms.
The construction of appropriate surrogate data sets permits the statistical testing of the proposal that nonlinear phase dynamics are present in the EEG. We tested the null hypothesis that the dynamic variations in EEG alpha activity occur as random variations of linearly correlated noise. This null hypothesis was rejected in approximately 2–5% of the EEG epochs studied, depending on the choice of electrode derivations and whether subjects' eyes were open or close. The rejection of this null hypothesis argues for the existence of macroscopic nonlinear dynamics intermittently determining EEG waveform and interdependences. Although the overall phase entropy λ was the most sensitive index, the δ indices add information concerning the scale of alpha desynchronizations.
There are several strengths of the present approach. The phenomenon of volume conduction, which confounds the distinction between true neural interdependence and the propagation of electrical fields from their sources, amounts to linear superposition of electrical signals, and is therefore controlled for by the use of linearly correlated surrogate data sets. The employment of numerical simulations permits the explicit pre‐testing of the methodology, including the validity of the surrogate algorithm and the sensitivity of the nonlinear measures. The experimental findings can be interpreted directly into a theoretical paradigm. Finally, the nonlinear algorithms are performed directly on the scalar time series. This is in contrast with other nonlinear techniques that begin with a time‐delay embedding of the time series. Central steps in this approach, such as the false‐nearest neighbors test, are not reliable in the presence of chaotic intermittency. This may explain the slightly higher number of ‘nonlinear epochs’ found here than in Stam et al. [1999].
The findings in this study must be cautiously interpreted in the context of several methodological limitations. For example, the numerical results are not derived from equations incorporating neurophysiology. Much of the behavior observed, however, does not rely upon the evolution orbits of specific systems, but on quite general properties of nonlinear systems, such as a dense set of unstable periodic orbits on the manifold supporting the chaotic attractor. It is possible to show that a local population of interacting excitatory and inhibitory neurons can be robustly modeled by a class of nonlinear systems with this property [Breakspear, 2001; Wang, 1991]. We also observed that much of the critical behavior was robust to other changes, such as the type of coupling and the symmetry of the attractors.
The experimental methodology also has some limitations. For example, it was necessary to filter the raw data into the alpha range to produce a signal with a consistent phase. To some extent, the process of filtering relies on an assumption that the alpha rhythm reflects activity in specific neural networks [Nunez et al., 2001]. The alpha rhythm was chosen because there exists well‐studied associations between alpha activity and a variety of physiological, cognitive and behavioral parameters. In addition, a recent study of the alpha rhythm found strong evidence for occasional instances of nonlinear dynamics [Stam et al., 1999]. Also, using a completely alternative technique of detecting nonlinear interdependence in bivariate data it is possible to illustrate that unfiltered EEG displaying generalized synchronization has up to 50% more power at the alpha peak than the rest of the EEG [Breakspear and Terry, 2001a]. Several observations support the use of filtering. Firstly, as noted above, visual inspection confirms that the filtered signal preserves the phase of the alpha activity in the raw signal. Secondly, linear coherence analysis reveals a strong peak in the alpha range for the ‘nonlinear’ epochs, which is absent in the database as a whole. This argues that the technique does focus on phase interdependence in alpha activity, and does not produce an apparent alpha phase through aliasing of faster frequencies.
Another limitation arises because the surrogate techniques are imperfect and can lead to spurious rejections of the null hypothesis [Rapp et al., 1994]. Testing the surrogate data itself for nonlinearity is a way of detecting this and did yield a slightly higher than expected rate of null rejections (7.9% rejected at the 95% confidence level). At the level of the entire data set, however, only seven (0.6%) epochs of surrogate EEG permitted false rejection of the null hypothesis, in comparison to 53 epochs of the actual EEG. Taking this (0.6%) as an estimate for the rate of false positives, we are left with a true positive rejection rate of 4.0% for the actual data. It must be noted, however, that the null hypothesis is for linearly correlated stationary linear noise. Its rejection implies that the time series are either nonlinear or nonstationary. Using the current methods of nonlinear analysis, it is not possible to distinguish these two possibilities. On the one hand, a ‘nonstationary’ stochastic process (with time‐dependent means, variance or spectral properties) violates the assumptions underlying the construction of the surrogate data and increases the rate of false positives [Schreiber, 1999]. Conversely, a ‘nonstationary’ nonlinear process (with time‐dependent state parameters) would ‘flood’ the nonlinear EEG epochs with either strong phase synchronized or completely unsynchronized dynamics. This would obscure the occurrence of intermittent phase desynchronization and increase the rate of false negatives. The situation is further complicated by the fact that a stationary nonlinear process exhibiting intermittent desynchronization produces distinct dynamical behaviors (synchronized and desynchronized), each with different spectral properties. Therefore the problem cannot be adequately addressed by a simple test of nonstationarity, based on a Box‐Jenkins approach. Several authors have proposed that brain dynamics involve a continual combination of both of nonlinearity and nonstationarity [Breakspear and Friston, 2001b; Friston, 1997, 2001; Palus, 1996] so that an absolute distinction may not be appropriate. The problem is perhaps best addressed by considering the results of different nonlinear techniques together.
There are two possible interpretations of the finding that large‐scale neuronal interactions only occasionally exhibit nonlinear phase dynamics. Firstly, it may be that most of the nonlinearity of the neuron does not manifest at large spatial scales, so that macroscopic neural systems typically operate in a ‘near‐linear’ state. It has recently been shown that a linear approximation of a nonlinear model of neocortical dynamics is able to accurately reproduce the EEG spectrum [Robinson et al., 2000]. From this perspective, macroscopic dynamics only become nonlinear at critical junctures such as phase transitions. Although infrequent, such nonlinear phase transitions have been proposed as being critical to normal brain function [Kelso et al., 1992; Wright et al., 1985]. An alternative interpretation is that the brain is constantly operating in a highly nonlinear domain. This arises through transient nonlinear and asynchronous coupling of neural assemblies that constitute the basic neural coding of information [Friston, 1997]. According to this interpretation, however, such transients are only occasionally of the appropriate spatial magnitude, temporal scale and cortical location to be mapped strongly in the EEG. Although we have found evidence of occasional nonlinearity at the scale of 4.096 sec, it may be that shorter bursts of nonlinear interdependencies occur very frequently across a range of spatial scales. The central proposal of this study, that nonlinear desynchronization facilitates the brain's flexible and adaptive behavior, is compatible with both of these interpretations. Further work is currently underway to establish the cognitive significance of this phenomenon.
Acknowledgements
The author is very grateful to Peter Robinson, Evian Gordon and John Terry for their helpful discussions and revisions of the manuscript, and to the referees for some important and helpful comments. The EEG data analyzed in this study was acquired by Homi Bahramali, Illario Lazzaro and Barry Manor at the Brain Dynamics Centre, Westmead Hospital, Sydney.
Signals with a high information capacity balance the opposing restraints of error detectability and message variability by containing interdependencies between individual events across many different scales [Gatlin, 1972]. These interdependencies can be detected by calculating the higher order entropies based on transitional probabilities [Freund, 1998]. A long signal and a finely partitioned event space, however, make the computation of these prohibitive. In this appendix it is shown that the existence of transitional probabilities across a temporal scale of n causes a divergence of the entropies calculated on blocks of n consecutive symbols. This is detected as an increase in δ, the standard deviation of these entropies. The values of δ across several magnitudes of scale (Fig. 9) thus reflect the information capacity of the signal.
Consider a source S that outputs a signal s(t) over an event space s ∈ [a,b] during a time interval t ∈ [0,T]. We say that X is an N‐partition of [a,b] if the elements x i ∈ X are N disjoint regions that cover [a,b]. A finite‐length signal s(t) of S and a partition X produce a finite symbol sequence F = x i(1), x j(2),…, x k(T) where x i(t) indicates which element of X contains s(t) at time t. The probability spectrum of F is given by,
| (A1) |
where η(x i) is the number of times x i appears in F. The probability spectrum of S is,
| (A2) |
We will assume that our signal length is sufficient to ensure that p F(x i) ≅ p S(x i). In the numerical simulations used to generate Figure 14, T > 50 000.
The conditional probability of event x i occurring at time t + τ given the occurrence of event x k at time t is,
| (A3) |
where the sequence x k,…,x i is τ + 1 symbols long. For any sequence we must have,
| (A4) |
and,
| (A5) |
We define an n‐tuple to be any block of n‐successive symbols from F, and an n k‐tuple to be any n‐tuple with initial symbol x k. The probability of symbol x i appearing in an arbitrary position within an n k‐tuple is given by,
 |
(A6) |
The entropy of a finite string, λF is given by substituting equation (A6) into equation (6) to equation (8). That is,
 |
(A7) |
The average entropy of all n k‐tuples within F is given by
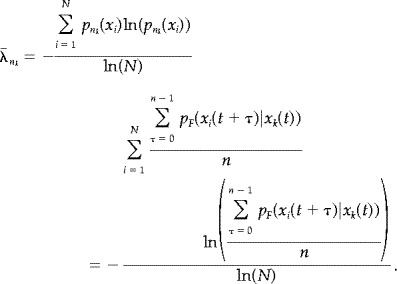 |
(A8) |
If S is a zero‐order Markov source then the elements of F occur independently. That is,
| (A9) |
For all t,τ > 0, with i,k ≅ [1,N]. In this case equation (A6) reduces to,
 |
(A10) |
and on substitution into equation (A8),
 |
(A11) |
Therefore the mean subentropies of all n k ‐tuples are equal. Obviously there will be some variation of the actual sub‐entropies around this value. The size of this variation depends upon the length of n, and approaches zero as n increases, as illustrated for the white noise signal (equation 1) in Figure 9.
S is an n‐th order Markov source if there is an interdependence between individual events over the length of n. That is, there exist i,k such that
| (A12) |
for τ = n. A more general condition is that this holds true for all i,j and for all τ ≅ [0,n]. Substituting equation (A12) into equation (A4) and using equation (A5) implies that there exists j ≠ k such that,
| (A13) |
for τ = n. There is thus a divergence of the n ‐th order transitions from equiprobability. Substituting equation (A13) into equation (A6) yields,
| (A14) |
and hence,
| (A15) |
Thus, for n‐th order Markov sources, the mean subentropies of the n k‐tuples are not equal. The stronger the event interdependence (the greater the differences between the conditional probabilities), the greater the difference between the average subentropies. Therefore the actual subentropies will vary around different mean values, and the standard deviation of all the subentropies in F will be statistically higher than in the zero order case.
In our case, S is a coupled nonlinear system chosen from equation (13) to equation (15), s(t) = ψ(t) ≅ [0,2π] and X is an N‐equipartition with bin size 2π/N. With coupling strength, C, chosen such that phase‐locking occurs, equation (A7) holds most strongly for j = 1 and k = N. That is, when the phase difference is close to zero, there exists a high probability that phase‐locking will occur over some time length τ such that ψ remains close to zero. Figure 9 therefore illustrates the typical length of the laminar (synchronous) epochs for these coupled systems.
REFERENCES
- Achermann P, Borbely A (1998): Coherence analysis of the human sleep electroencephalogram. Neuroscience 85: 1195–1208. [DOI] [PubMed] [Google Scholar]
- Afraimovich V, Verichev N, Rabinovich M (1986): Stochastic synchronization of oscillation in dissipative systems. Radiophys Quantum Electron 29: 795. [Google Scholar]
- Ashwin P, Covas E, Tavakol R (1999): Transverse instability for non‐normal parameters. Nonlinearity 12: 563–577. [Google Scholar]
- Basar E (1980): Chaos in brain function. Springer‐Verlag: London. [Google Scholar]
- Boiten F, Sergeant J, Geuze R (1992): Event‐related desynchronization: the effects of energetic and computational demands. Electroencephalogr Clin Neurophysiol 82: 302–309. [DOI] [PubMed] [Google Scholar]
- Breakspear M (2001): Perception of odors by a nonlinear model of the olfactory bulb. Int J Neural Syst 11: 101–124. [DOI] [PubMed] [Google Scholar]
- Breakspear M, Terry J (2001a): Detection and description of nonlinear interdependence in normal multichannel human EEG data. University of Warwick Preprint: 16/2001.
- Breakspear M, Friston K (2001b): Symmetries and itinerancy in nonlinear systems with many degrees of freedom. Behav Brain Sci 24: 646–647. [Google Scholar]
- Clochon P, Fontbonne J, Lebrun N, Etevenon P (1996): A new method for quantifying EEG event‐related desynchronization: amplitude envelope analysis. Electroencephalogr Clin Neurophysiol 98: 126–129. [DOI] [PubMed] [Google Scholar]
- Cooper J, Bloom F, Roth R (1991): The biochemical basis of neuropharmacology. Oxford University Press: Oxford. [Google Scholar]
- Ebeling W (1995): Dynamic entropies and predictability of evolutionary systems In: Nonlinear dynamics, chaotic and complex systems. Infeld E, Zelazny R, Galkowski A.(eds.) Cambridge: Cambridge University Press. [Google Scholar]
- Fein G, Raz J, Brown FF, Merrin EL (1988): Common reference coherence data are confounded by power and phase effects. Electroencephalogr Clin Neurophysiol 69: 581–584. [DOI] [PubMed] [Google Scholar]
- Frank T, Daffertshofer A, Peper C, Beek P, Haken H (2000): Toward a comprehensive theory of brain activity: coupled oscillators under external forces. Physica D 144: 62–86. [Google Scholar]
- Freund J, Rateitschak K, 1998. Entropy analysis of noise contaminated sequences. Int J Bifurcat Chaos 85: 933–940. [Google Scholar]
- Faure P, Korn H (1997): A nonrandom dynamic component in the synaptic noise of a central neuron. Proc Natl Acad Sci USA 94: 6506–6511. [DOI] [PMC free article] [PubMed] [Google Scholar]
- Freeman W (1990): Nonlinear neural dynamics in olfaction as a model for cognition In: Basar E, editor. Chaos in brain function. Berlin: Springer‐Verlag. [Google Scholar]
- Freund J, Rateitschak K (1998): Entropy analysis of noise contaminated sequences. Int J Bifurcat Chaos 8: 933–940. [Google Scholar]
- Friston K, Tononi G, Sporns O, Edleman G (1995): Characterizing the complexity of neuronal interactions. Hum Brain Mapp 3: 302–314. [Google Scholar]
- Friston K (1997): Transients metastability and neuronal dynamics. Neuroimage 5: 164–171. [DOI] [PubMed] [Google Scholar]
- Friston K (2000): The labile brain. I. Neuronal transients and nonlinear coupling. Phil Trans R Soc Lond B 355: 215–236. [DOI] [PMC free article] [PubMed] [Google Scholar]
- Gatlin L (1972): Information theory and the living system. New York: Columbia University Press. [Google Scholar]
- Gray C, Konig P, Engel A, Singer W (1989): Oscillatory responses in cat visual cortex exhibit inter‐columnar synchronization which reflects global stimulus properties. Science 338: 334–337. [DOI] [PubMed] [Google Scholar]
- Haig A, Gordon E (1998): EEG alpha phase at stimulus onset significantly affects the amplitude of the P3 ERP component. Int J Neurosci 93: 101–116. [DOI] [PubMed] [Google Scholar]
- Heagy J, Pecora L, Carroll T (1995): Short wavelength bifurcation and size instabilities in coupled oscillator systems. Phys Rev Lett 7421: 4185–4188. [DOI] [PubMed] [Google Scholar]
- Heagy J, Carroll T, Pecora L (1998): Desynchronization by periodic orbits. Phys Rev E 52: R1253–R1256. [DOI] [PubMed] [Google Scholar]
- Hunt B, Ott E, Yorke J (1997): Differentiable synchronization of chaos. Phys Rev E 55: 4029–4034. [Google Scholar]
- Kapitaniak T, Chua L (1994): Hyperchaotic attractors of unidirectionally‐coupled Chua's circuits. Int J Bifurcat Chaos 4: 477–482. [Google Scholar]
- Kelso J, Bressler S, Buchanan S, DeGuzman G, Ding M, Fuchs A, Holroyd T (1992): A phase transition in human brain and behavior. Phys Lett A 169: 134–144. [Google Scholar]
- Klimesch W, Doppelmayer M, Schimke H, Ripper B (1997): Theta synchronization and alpha desynchronization in a memory task. Psychophysiology 34: 169–176. [DOI] [PubMed] [Google Scholar]
- Kwapieri J, Drozdz S, Liu L, Ioannides A (1998): Cooperative dynamics in auditory brain response. Phys Rev E 58: 6359–6367. [Google Scholar]
- Lorenz E (1963): Deterministic nonperiodic flow. J Atmos Sci 20: 130–141. [Google Scholar]
- Maistrenko Y, Maistrenko V, Popovich A, Mosekilde E (1998): Transverse instability and riddled basins in a system of two coupled logistic maps. Phys Rev E 57: 2713–2724. [Google Scholar]
- Makarenko V, Llinas R (1998): Experimentally determined chaotic phase synchronization in a neuronal system. Proc Natl Acad Sci USA 95: 15747–15752. [DOI] [PMC free article] [PubMed] [Google Scholar]
- Marino I, Perez‐Munuzuri V, Matias M (1998): Desynchronization transitions in rings of coupled chaotic oscillations. Int J Bifurcat Chaos 8: 1733–1738. [Google Scholar]
- Miltner W, Braun C, Arnold M, Witte H, Taub E (1999): Coherence of gamma‐band EEG activity as a basis for associative learning. Nature 397: 434–436. [DOI] [PubMed] [Google Scholar]
- Nunez P (1995): Neocortical dynamics and human brain rhythms. Oxford: Oxford University Press. [Google Scholar]
- Nunez P, Wingeler B, Silberstein R (2001): Spatial structures of human alpha rhythms: microcurrent sources multi‐scale measurements and global binding of local networks. Hum Brain Mapp 13: 125–164. [DOI] [PMC free article] [PubMed] [Google Scholar]
- Osborne A, Provencale A (1989): Finite correlation dimension for stochastic systems with power‐law spectra. Physica D 35: 357–381. [Google Scholar]
- Palus M (1996): Nonlinearity in normal human EEG: cycles temporal asymmetry nonstationarity and randomness not chaos. Biol Cybern 75: 389–396. [DOI] [PubMed] [Google Scholar]
- Pecora L, Carroll T (1990): Synchronization in chaotic systems. Phys Rev Lett 64: 821–824. [DOI] [PubMed] [Google Scholar]
- Pecora L (1998): Synchronization conditions and desynchronizing patterns in coupled limit‐cycle and chaotic systems. Phys Rev E 58: 347–360. [Google Scholar]
- Pezard L, Martinerie J, Muller‐Gerking J, Varela F, Renault B (1996): Entropy quantification of human brain spatio‐temporal dynamics. Physica D 96: 344–354. [Google Scholar]
- Pfurtscheller G (1977): Graphical display and statistical evaluation of event‐related desynchronization. Electroencephalogr Clin Neurophysiol 43: 757–760. [DOI] [PubMed] [Google Scholar]
- Pikovsky A, Grassberger P (1991): Symmetry breaking bifurcation for coupled chaotic attractors. J Phys A 24: 4587–4597. [Google Scholar]
- Prichard D, Theiler J (1994): Generating surrogate data for time series with several simultaneously measured variables. Phys Rev Lett 73: 951–954. [DOI] [PubMed] [Google Scholar]
- Pritchard W, Duke D (1992): Measuring chaos in the brain: a tutorial review of nonlinear dynamical EEG analysis. Intern J Neurosci 67: 31–80. [DOI] [PubMed] [Google Scholar]
- Rapp P, Albano A, Zimmerman I, Schmah T, Farwell L (1993): Filtered noise can mimic low‐dimensional chaotic attractors. Phys Rev E 47: 2289–2297. [DOI] [PubMed] [Google Scholar]
- Rapp P, Albano A, Zimmerman I, Jimenez‐Montano M (1994): Phase‐randomized surrogates can produce spurious identifications of non‐random structure. Phys Lett A 192: 27–33. [Google Scholar]
- Robinson P Rennie C, Wright J, Bahramali H, Gordon E, Rowe D (2000): Prediction of electroencephalographic spectra from neurophysiology. Phys Rev E 63: 21903–21920. [DOI] [PubMed] [Google Scholar]
- Rodriguez E, George N, Lachaux N, Martinerie J, Renault B, Varela F (1999): Perception's shadow: long‐distance synchronization of human brain activity. Nature 397: 430–433. [DOI] [PubMed] [Google Scholar]
- Rombouts S, Keunen R, Stam C (1995): Investigation of nonlinear structure in multichannel EEG. Phys Lett A 202: 352–358. [Google Scholar]
- Rosenblum M, Pikovsky A, Kurths J (1996): Phase synchronization of chaotic oscillators. Phys Rev Lett 76: 1804–1807. [DOI] [PubMed] [Google Scholar]
- Rosenblum M, Pikovsky A, Kurths J (1997): From phase to lag synchronization in coupled chaotic oscillators. Phys Rev Lett 78: 4193–4196. [Google Scholar]
- Ruelle D (1990): Deterministic chaos: the science and the fiction. Proc R Soc Lond A 427: 241–248. [Google Scholar]
- Rulkov N, Sushchik M, Tsimring L, Abarbenel H (1995): Generalized synchronization of chaos in unidirectionally coupled chaotic systems. Phys Rev E 51: 980–994. [DOI] [PubMed] [Google Scholar]
- Rulkov N, Sushchik M (1997): Robustness of synchronized chaotic oscillations. Int J Bifurcat Chaos 7: 625–643. [Google Scholar]
- Schaffer C, Rosenblum M, Kurths J, Abel H (1998): Heartbeat synchronized with ventilation. Nature 392: 239–240. [DOI] [PubMed] [Google Scholar]
- Schreiber T (1999): Is nonlinearity evident in time series of brain electrical activity? In: Lehnertz K, Arnhold J, Grassberger P, Elger C, editors. Workshop on chaos in brain. London: World Scientific. [Google Scholar]
- Sergeant J, Geuze R, Van Winsum W (1987): Event‐related desynchronization and p300. Psychophysiology 24: 272–277. [DOI] [PubMed] [Google Scholar]
- Singer W (1995): Putative functions of temporal correlations in neocortical processing In: Koch C, Davis J, editors. Large‐scale neuronal theories of the brain. Massachusetts: MIT Press. [Google Scholar]
- Stam C, Tavy Keunen R (1993): Quantification of alpha rhythm desynchronization using the acceleration spectrum entropy of the EEG. Electroencephalogr Clin Neurophysiol 24: 104–109. [DOI] [PubMed] [Google Scholar]
- Stam C, Pijn J, Suffczynski P, Lopes da Silva (1999): Dynamics of the alpha rhythm: evidence for non‐linearity? Clin Neurophysiol 110: 1801–1813. [DOI] [PubMed] [Google Scholar]
- Steriade M, Gloor P, Llinas R, Lopes da Silva F, Mesulam M (1990): Basic mechanisms of cerebral rhythmic activities. Electroencephalogr Clin Neurophysiol 76: 481–508. [DOI] [PubMed] [Google Scholar]
- Stopfer M, Bhagavan S, Smith B, Laurent G (1997): Impaired odor discrimination on desynchronization of encoding‐encoding neural assemblies, Nature 390: 70–74. [DOI] [PubMed] [Google Scholar]
- Tass P, Rosenblum M, Weule J, Kurths J, Pikovsky A, Volkmann J, Schnitzler A, Freund H (1998): Detection of n:m phase locking from noisy data: application to magnetoencephalography. Phys Rev Lett 81: 3291–3294. [Google Scholar]
- Theiler J, Eubank S, Longtin A, GAldrikian B, Farmer JD (1992): Testing for nonlinearity: the method of surrogate data. Physica D 58: 77–94. [Google Scholar]
- Theiler J, Prichard D (1997): Using “surrogate surrogate data” to calibrate the actual rate of false positives in tests for nonlinearity in time series In: Cutler C, Kaplan D, editors. Nonlinear dynamics and time series. Rhode Island: American Mathematical Society. [Google Scholar]
- Van Winsum W, Sergeant J, Geuze R (1984): The functional significance of event‐related desynchronization of alpha rhythm in attentional and activating tasks. Electroencephalogr Clin Neurophysiol 58: 519–524. [DOI] [PubMed] [Google Scholar]
- Wang X (1991): Period‐doublings to chaos in a simple neural network: an analytic proof, Complex Systems 5: 425–441. [Google Scholar]
- Wright J, Kydd R, Lees G (1985): State changes in the brain viewed as linear steady‐states and nonlinear transitions between steady‐states. Biol Cybern 53: 11–17. [DOI] [PubMed] [Google Scholar]


