

Abstract
Neuroimaging studies using backward masking suggest that conscious and nonconscious responses to complex signals of fear (facial expressions) occur via parallel cortical and subcortical circuits. Little is known, however, about the temporal differentiation of these responses. Psychophysics procedures were first used to determine objective thresholds for both nonconscious detection (face vs. blank screen) and discrimination (fear vs. neutral face) in a backward masking paradigm. Event‐related potentials (ERPs) were then recorded (n = 20) using these thresholds. Ten blocks of masked fear and neutral faces were presented under each threshold condition. Simultaneously recorded skin conductance responses (SCRs) provided an independent index of stimulus perception. It was found that Fear stimuli evoked faster SCR rise times than did neutral stimuli across all conditions, indicating that emotional content influenced responses, regardless of awareness. In the first 400 msec of processing, ERPs dissociated the time course of conscious (enhanced N4 component) from nonconscious (enhanced N2 component) perception of fear, relative to neutral. Nonconscious detection of fear also elicited relatively faster P1 responses within 100 msec post‐stimulus. The N2 may provide a temporal correlate of the initial sensory processing of salient facial configurations, which is enhanced when top‐down cortical feedback is precluded. By contrast, the N4 may index the conscious integration of emotion stimuli in working memory, subserved by greater cortical engagement. Hum. Brain Mapping 21:64–74, 2004. © 2003 Wiley‐Liss, Inc.
Keywords: emotion, fear, event‐related potential, skin conductance, nonconscious
INTRODUCTION
It is not yet known whether the “neural signature” of consciousness involves activity in particular neural networks, a particular temporal pattern of neural activity, or an interaction of spatial and temporal dimensions [Crich and Koch,1998; Frith et al.,1999]. Backward masking is one of the key experimental paradigms used to explore neural responses to below‐awareness stimuli with brain imaging measures. The salience of threat‐related facial expressions as biological signals in human interaction also makes them well suited to the study of nonconscious perception. We used event‐related potential (ERP) recording with backward masking to examine the time course of neural responses to nonconscious versus conscious perception of expressions of fear. Skin conductance arousal was recorded simultaneously, to provide an independent peripheral measure of fear perception.
Functional neuroimaging studies using backward masking to prevent conscious emotion discrimination have observed some degree of emotion modulation in the amygdala, but reduced cortical activity for “unseen” threat‐related facial expression stimuli [Morris et al.,1998, 1999; Whalen et al.,1998]. Observations with “blindsight” patient GY, with a striate cortex lesion, suggest that nonconscious emotion perception may occur via an early visual (brainstem colliculopulvinar)‐thalamo‐amygdala circuit [Morris et al.,2001]. These observations are consistent with the proposal that processing of threat signals may occur via alternative pathways: a direct sensory‐amygdala circuit for rapid and automatic responses to low‐level features, in the absence of cognitive mediation, and a slower cortico‐amygdala pathway for conscious elaboration of stimulus context [Davis,1992; LeDoux,1998].
It has been demonstrated that central processing of threat‐related sensory input relies on feedback from bodily states of autonomic arousal, and this feedback may elicit subjective responses that occur both consciously and nonconsciously [Bechara et al.,1997; Damasio,1996; Williams et al.,2001]. In backward masking studies, nonconscious as well as conscious threat‐related face (and non‐face) stimuli have been shown to enhance autonomic arousal, indexed by skin conductance responses [SCRs; Clark et al.,1992; Dimberg and Öhman,1996; Esteves and Öhman,1993; Öhman and Soares,1998]. These findings suggest that changes in autonomic arousal play a role in differentiating emotionally salient sensory input, even in the absence of conscious recognition. Consistent with neuroimaging findings, brainstem systems involved in regulating autonomic arousal (particularly, locus coeruleus projections within the ascending reticular activating system) may provide a direct pathway for initiating such nonconscious peripheral responses.
To date, ERPs have not been used to examine the time course of nonconscious versus conscious perception of threat‐related face stimuli, within a masking paradigm. Convergent ERP evidence from tachistoscopic, lesion, and high‐density mapping studies, however, provide a basis for predictions in this study. Nonconscious perception has been shown to modulate neural activity within100–200 msec of stimulus onset but, beyond this window, there is a rapid decay in activity [Bernat et al.,2001a; Kiefer and Spitzer,2000; Marzi et al.,2000]. Given high‐density ERP mapping evidence that the first 200 msec of processing is sufficient time for top‐down parietal and prefrontal feedback [Molholm et al.,2002], we suggest that backward masking may prevent or limit such feedback. By contrast, conscious perception is distinguished by sustained and prominent activity beyond 300 msec post‐stimulus, which may reflect the ongoing interaction of sensory and top‐down feedback [Bernat et al.,2001a; Cuthbert et al.,2000; Diedrich et al.,1997; Kiefer and Spitzer,2000]. These observations suggest that ERP components within 200 msec and beyond 300 msec post‐stimulus may provide temporal correlates of the neural circuits engaged by nonconscious versus conscious perception of fear [LeDoux,1998].
ERP studies of conscious perception suggest that face and emotion perception are distinguished by specific components within the first approximately 400 msec of stimulus processing. An N2 component peaking around 200 msec (and also reflected in more specific N170 or N250 components), occurs consistently for face stimuli, both schematic and photographic [Bentin et al.,2002; Schweinberger and Burton,2003]. This component is modulated also by the emotional valence of both schematic and photographic facial expressions [Mikhailova and Bogomolova,1999; Sokolov and Boucsein,2000]. Given consensus that the N2 reflects detection and holistic perceptual analysis of facial configurations [Bentin et al.,1996], it may be modulated by the distinctive configurations that define each facial expression. This proposal is consistent with the role of the early visual stream in emotion modulation [Pizzagalli et al.,2002]. The N4 component is elicited around 400 msec post‐stimulus by conscious processing of the emotion valence of both word and face stimuli [Halgren and Marinkovic,1995; Kiefer and Spitzer,2000]. It is suggested that the N4 reflects the post‐perceptual and conscious integration of meaning and context in working memory [Kiefer and Spitzer,2000].
Threshold Setting
The discrimination threshold (or point at which subjects cannot discriminate emotion from neutral with above‐chance accuracy) has been the criterion for nonconscious perception used in previous neuroimaging studies of masked stimuli (reviewed in the previous section). Attention should also be given to the detection threshold (the point at which subjects cannot detect whether a face stimulus or blank screen has been presented), to provide a stringent test of below‐awareness perception [Shevrin,2001; Snodgrass et al.,1993]. Some degree of conscious detection of stimulus features must occur before emotion discrimination is possible, and this “smidgen of consciousness” may interfere with the ability to examine the correlates of nonconscious perception [Bernat et al.,2001b]. In this study, therefore, we compared responses in both detection and discrimination threshold conditions to a suprathreshold condition, in which awareness was above both these thresholds. We also relied on an objective forced‐choice task, based on signal detection theory, to establish each threshold. This procedure overcomes the potential limitations of subjective self‐report procedures, in which subjects report no awareness (possibly due to uncertainty), but may nonetheless experience some level of conscious awareness [Bernat et al.,2001a].
It was predicted that nonconscious perception would be associated only with ERP components within 100–200 msec post‐stimulus onset, and would be most pronounced for fear. We expected conscious perception to be distinguished by greater activity beyond 300 msec, similarly most prominent for fear, whereas activity would decay across this time frame for nonconscious perception. We predicted that fear would also be distinguished from neutral by the rise time and amplitude of SCRs in both nonconscious and conscious conditions.
SUBJECTS AND METHODS
Threshold‐Setting Experiment
Participants
Fifteen healthy volunteers (eight men, seven women; age‐matched; mean age, 26.4 ± 3.9 years) participated in the threshold‐setting tasks. Inclusion criteria were predominant right‐handedness, normal or corrected to normal vision, and absence of a history of psychiatric or neurologic disorder, head injury, psychotropic medication use, or substance abuse, assessed using a semi‐structured interview, the Westmead Hospital Clinical Information Base (WHCIB) [Williams et al.,2000]. Written and informed consent was obtained from subjects according to National Health and Medical Research Council guidelines. Participants completed two tasks (discrimination and detection) in counterbalanced order.
Stimuli
Psychophysical testing was undertaken at the Brain Dynamics Centre, Westmead Hospital, Sydney. Eight identities depicting facial expressions of fear and neutral were selected from a standardized series [Ekman and Friesen,1976]. Different intensities of expression were derived using standardized computer manipulation [Calder et al.,1997]. Fear expressions were each 100% intensity, but neutral was represented by mildly (25%) happy expressions to control for the observation that 100% neutral expressions tend to be interpreted as somewhat negative [Phillips et al.,1997]. A blank stimulus, of the same rectangular shape and size as face stimuli and filled with an identical mid‐grey background tone, was created by computer manipulation. Stimuli were 430 pixels in height and 340 pixels in width.
Experimental tasks and procedure
The threshold‐setting experiment consisted of two psychophysical tasks: (1) a discrimination threshold‐setting task, to determine the point at which subjects could not discriminate fear versus neutral with above‐chance accuracy; and (2) a detection threshold‐setting task, to determine the point at which subjects could not detect whether a face versus blank screen stimulus was presented. In both tasks, backward masking was employed, so that thresholds could be applied directly in the subsequent ERP study. Participants were asked to keep their choices divided evenly between each option within each task. Using signal detection theory [Macmillan,1986], the objective criterion for lack of conscious perception was d′ = 0 (i.e., the stimulus‐onset asynchrony [SOA] at which performance accuracy does not differ significantly from chance performance or 50%). This procedure overcomes the potential limitation of a subjective self‐report criterion, in which subjects report no awareness (possibly due to uncertainty), but d′ may nonetheless be greater than zero [Bernat et al.,2001a].
Stimuli were presented via an SVGA monitor (refresh rate of 100 Hz). The retinal stimulation was equated between all stimuli and conditions (mean luminance of 30). To ensure precise stimulus presentation duration and to avoid duration error due to screen refresh cycles, the computer video card was programmed directly to write each stimulus to the screen before exposure. This procedure ensured that that exposure was synchronized with the refresh of the monitor. The accuracy of stimulus duration was also confirmed independently using an oscilloscope.
Discrimination threshold (and suprathreshold) task.
The discrimination task was designed to establish the thresholds for conscious, as well as unconscious discrimination. Six blocks of 64 target/mask pairs each were randomized within subjects. SOA between target and mask was manipulated between blocks (20, 30, 50, 90, 170, or 330 msec). Target duration was equivalent to the SOA, such that mask onset was immediate. In each block, half (32) of the target stimuli were fear and the remaining 32 targets were neutral. All mask stimuli were neutral. The interval between presentation of successive target/mask pairs was 1 sec. Neutral mask stimuli were presented for 100 msec and were offset spatially by a 1‐degree visual angle in the direction of the four diagonals of the target stimulus to avoid artefactual detection of facial expressions by the apparent motion in fear/neutral pairs compared to neutral/neutral pairs (e.g., the drop in eyebrow angle from fear target to neutral mask). Subjects made an objective forced‐choice decision about the target face expression (fear vs. neutral) via button‐press after each target/mask trial.
Detection threshold task.
To establish the threshold for unconscious detection, subjects were presented five blocks of 64 target/mask pairs, with five SOAs manipulated between blocks. Given the logical assumption that detection threshold SOA would be shorter than that for discrimination, and that conscious perception was established in the previous task, the five SOAs for this task were a finer‐grained division of the first three SOAs used for the discrimination task (10, 20, 30, 40, and 50 msec). Half (32) of the targets were faces (16 fear, 16 neutral) and the remaining 32 targets were blank stimuli. The presentation procedure followed that for the discrimination task; however, the forced‐choice decision was for face versus blank.
ERP‐SCR Experiment
Participants
Twenty healthy volunteers (10 males, 10 females, age‐matched), meeting identical inclusion and exclusion criteria to the threshold‐setting experiment (mean age, 24.9 ± 7.5 years), took part. Subjects were asked to refrain from caffeinated beverages and nicotine or other substances for 24 hr before testing.
Stimuli and procedure
Testing was undertaken at the Brain Dynamics Centre psychophysiology laboratory, Westmead Hospital, Sydney. Stimuli included fear and neutral faces, identical to those used in the threshold setting experiment. Target‐mask pairs were presented under three threshold conditions: suprathreshold (170 msec SOA), nonconscious discrimination (30 msec SOA), and nonconscious detection (10 msec SOA). Given the minimal individual variation within these SOAs in the threshold‐setting task, it was appropriate to apply them in this participant group. Within each condition, stimuli were presented in similar numbers and structure to the threshold task. A total of 150 fear target‐neutral mask pairs and 150 neutral target‐neutral mask pairs, with a 1‐sec ISI, formed 10 blocks of 30 pairs. The order of conditions was 10, 30, and 170 msec SOA. To avoid confounding effects of suprathreshold perception on subthreshold perception [Bernat et al.,2001a; Wong et al,1994], conditions were not counterbalanced across subjects. Participants were given explicit instructions that pairs of target‐mask face stimuli would be presented. It was emphasized that the first face might be difficult to see, but to concentrate as best they could on it, because they would be asked questions about these faces after testing. The emotional content of the target faces was not revealed in these instructions, to avoid expectancy effects.
Data acquisition
ERP recording.
During presentation of each threshold condition, ERPs were recorded via an electrocap according to the International 10/20 system of electrode placement [Blom and Anneveldt,1982]. The focus of this study was the midline sites Fz, Cz and Pz, with linked earlobes serving as a reference point. Previous studies have shown that midline site ERPs are sensitive to modulation by facial emotion stimuli [e.g., Carretié and Iglesias,1995; Lang et al.,1990]. To correct for eye blinks and non‐stimulus‐related eye movement artifacts, both horizontal and vertical eye movement potentials were recorded using electrodes placed laterally 1 cm from the outer canthus of each eye, and 1 cm above and below the left eye. All electrode impedances were <5 k
 . ERPs were recorded for 200 msec pre‐stimulus until 800 msec post‐stimulus onset, using a DC system with a digitization rate of 250 Hz. Continuous electroencephalograph (EEG) recording was used for the remaining time periods.
Skin conductance data.
Skin conductance was recorded simultaneously with ERP data via a pair of silver‐silver chloride electrodes with 0.05 M sodium chloride gel placed on the distal phalanges of digits II and III of the left hand. The electrode pairs were supplied by a constant voltage and the current change representing conductance was recorded using the DC amplifier.
Data reduction and analyses
ERP data.
ERPs were time‐locked to the onset of target stimuli in each condition. Amplitude and latency for the ERP components of focal interest (P1, N1, P2, N2, P3, and N4) were scored from baseline to peak using an automated system [Haig et al.,1995]. Based on previous ERP studies of unconscious versus conscious perception [Bernat et al.,2001a; Kiefer and Spitzer,2000], the respective time windows for each component peak were: P1, 30–100 msec; N1, 80–140 msec; P2, 180–220 msec; N2, 200–300 msec; P3, 300–500 msec; and N4, 300–600 msec. Outliers for each ERP component at each recording site were defined as greater than three standard deviations above the mean within each condition, and were replaced with the next most extreme point, as described previously by Tabachnick and Fidell [1989]. There were 7 outliers of 2880 total data points. MANOVA was used to analyze ERP amplitude and latency; temporal condition (10, 30, and 170 msec SOA), emotion (fear vs. neutral), and recording site (Fz, Cz, Pz) were within‐subject factors. The focal effects of interest were interactions involving condition and emotion. Paired t‐tests were used to explore significant MANOVA effects according to the a priori hypotheses.
Skin conductance data.
The presence of a phasic skin conductance response (SCR) was defined by an unambiguous increase (>0.05 μS) with respect to each pre‐target stimulus baseline and occurring 1–3 sec after the target face stimulus [Barry and Sokolov,1993]. The number, amplitude, and rise time of SCRs were scored using customized software, based on a sigmoid‐exponent mathematical model that allows each SCR to be linked to the individual eliciting stimulus. It also allows overlapping SCRs (in short ISI paradigms) to be disentangled [Lim et al.,1997]. SCR data were first analyzed using MANOVAs with temporal condition (10, 30, and 170 msec SOA) and emotion (fear vs. neutral) as within‐subject factors. Paired t‐tests were used to explore the a priori contrasts of interest.
ERP‐Skin conductance relationships.
We used Pearson correlation analysis to explore associations between ERP and SCR data.
Time course analyses.
Neuroimaging studies have shown that brain activity in response to fear‐related stimuli may decline across stimulus blocks [e.g., Buchel et al.,1999; LaBar et al.,1998]. In these studies, responses for the first half of each block were compared to those for the second half. We followed this procedure to explore the potential contribution of rapid (within‐block) response attenuation to significant effects involving condition and emotion, for both ERP and skin conductance data. MANOVA was undertaken with time (first 15 vs. last 15 stimuli in each block) and emotion as within‐subject factors. For ERP data, site was an additional within‐subjects factor.
RESULTS
Threshold‐Setting Experiment
Discrimination threshold (and suprathreshold) task
Mean percentage accuracy (and standard error) for each SOA is presented graphically in Figure 1A. Performance was clearly above (P < 0.001) chance for SOAs of 50–330 msec (Fig. 1A). Because performance reached a level that did not differ significantly from chance at 30 msec SOA (t = 1.7, df = 14, P = 0.11), with minimal individual variation (standard error [SE] = 1.02%), it was selected as the nonconscious discrimination threshold. The SOA of 170 msec was selected as the suprathreshold SOA because this was the point at which consistent above‐chance accuracy was reached (SE = 1.09%).
Figure 1.
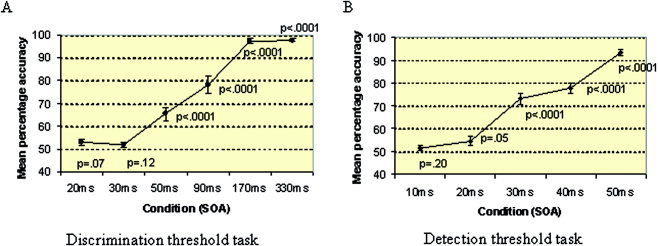
Mean percentage accuracy for SOAs in threshold setting discrimination task (A) and detection task (B). P‐values indicate whether or not accuracy at each SOA differed significantly from a chance‐level performance of 50%.
Detection threshold task
Mean percentage accuracy (and standard error) for each SOA is presented graphically in Figure 1B. Performance was clearly above (P < 0.001) chance level performance for SOAs of 30, 40, and 50 msec, and differed with marginal significance (P = 0.05) for 20 msec. Because it was only at 10 msec SOA that performance did not differ significantly from chance (t = 1.4, df = 14, P = 0.20), with minimal individual variation (SE = 1.02%), this SOA was selected for the nonconscious detection threshold.
Analysis of correct/incorrect responses
For each of the selected sub‐ and suprathreshold SOAs (10, 30, and 170 msec), we undertook χ2 analyses to determine if there were any systematic associations between accuracy (proportion of correct vs. incorrect responses) and the eight identities depicted in the face stimuli. No significant associations were revealed, indicating that the accuracy of stimulus perception would be distributed evenly across individual identities in the subsequent ERP experiment (170 msec SOA: χ2 (35) = 40, P = 0.26; 30 msec SOA, χ2 (49) = 48, P = 0.24; 10 msec SOA, χ2 (42) = 56, P = 0.23).
ERP‐SCR experiment
ERP data
Table I presents the descriptive data for ERP amplitude and latency, and Figure 2 shows average ERP waveforms for responses to fear versus neutral, across conscious and nonconscious discrimination and detection conditions. The focal MANOVA effects, involving emotion are considered in turn.
Table I.
ERP amplitude and latency for perception of fear versus neutral
| ERP component | Fear | Neutral | ||||||||||
|---|---|---|---|---|---|---|---|---|---|---|---|---|
| Amplitude by site | Latency by site | Amplitude by site | Latency by site | |||||||||
| Fz | Cz | Pz | Fz | Cz | Pz | Fz | Cz | Pz | Fz | Cz | Pz | |
| 170 ms SOA | ||||||||||||
| P1 | −1.33 (0.57) | −0.96 (1.01) | −.03 (1.29) | 71.61 (15.79) | 73.22 (13.27) | 74.35 (13.50) | −0.62 (1.25) | −1.14 (0.96) | −0.006 (1.69) | 75.13 (9.28) | 75.65 (16.37) | 78.14 (16.29) |
| N1 | −4.70 (1.68) | −4.27 (1.76) | −2.93 (1.97) | 126.90 (13.66) | 124.50 (12.57) | 114.91 (13.21) | −5.44 (1.83) | −5.10 (1.89) | −3.67 (123.65) | 130.88 (11.17) | 131.02 (9.78) | 123.65 (16.95) |
| P2 | .58 (3.06) | 1.73 (3.30) | 5.03 (4.00) | 174.63 (13.85) | 172.76 (16.02) | 177.5 (36.25) | 0.78 (2.65) | 1.41 (3.22) | 3.89 (2.39) | 177.41 (13.5) | 178.04 (13.75) | 170.66 (23.82) |
| N2 | −7.09 (2.78) | −5.03 (3.56) | −.001 (4.94) | 298.74 (25.77) | 241.85 (24.65) | 215.10 (34.08) | −0.67 (3.30) | −5.38 (4.04) | .002 (5.13) | 243.68 (23.34) | 243.88 (26.78) | 226.17 (25.78) |
| P3 | −3.79 (2.82) | −0.96 (3.71) | 5.42 (5.45) | 298.75 (25.77) | 296.75 (38.02) | 283.25 (28.64) | −3.09 (2.73) | 0.11 (1.67) | 4.98 (5.27) | 299.62 (28.39) | 302.46 (37.26) | 280.45 (26.93) |
| N4 | −10.72 (2.48) | −6.14 (3.09) | −2.41 (2.40) | 358.84 (24.84) | 367.56 (20.88) | 364.22 (33.80) | −7.59 (2.65) | −6.11 (2.69) | −2.20 (3.23) | 350.57 (38.42) | 360.36 (24.38) | 375.84 (52.99) |
| 30 ms SOA | ||||||||||||
| P1 | −0.84 (0.52) | −0.88 (0.72) | 0.41 (2.24) | 64.90 (10.62) | 73.19 (18.24) | 73.13 (15.54) | −0.19 (1.25) | −0.38 (0.91) | 0.18 (2.35) | 66.24 (14.25) | 62.72 (16.04) | 71.87 (16.07) |
| N1 | −4.61 (1.59) | −4.31 (1.94) | −2.93 (1.60) | 126.89 (12.37) | 128.77 (22.64) | 127.78 (18.99) | −4.51 (1.39) | −4.25 (2.23) | −3.07 (2.50) | 127.13 (10.59) | 124.94 (13.89) | 126.86 (28.14) |
| P2 | .79 (2.74) | 1.53 (3.11) | 4.36 (4.06) | 177.28 (15.14) | 177.69 (18.33) | 182.56 (36.32) | 0.94 (2.61) | 1.29 (2.77) | 4.08 (3.25) | 178.81 (12.43) | 179.20 (16.97) | 182.14 (32.29) |
| N2 | −6.51 (3.10) | −5.14 (3.75) | −2.65 (3.86) | 245.09 (26.79) | 243.35 (27.85) | 225.22 (40.84) | −5.39 (2.97) | −4.01 (3.24) | −1.83 (3.58) | 244.24 (28.49) | 241.94 (36.21) | 229.09 (47.13) |
| P3 | −1.62 (3.46) | 0.26 (3.41) | 5.73 (4.46) | 336.54 (20.78) | 348.99 (33.53) | 291.90 (40.20) | −1.06 (3.08) | −0.007 (2.07) | 4.88 (4.33) | 338.89 (40.29) | 352.90 (40.05) | 294.01 (51.46) |
| N4 | −2.21 (1.90) | −1.99 (1.76) | −1.21 (2.94) | 428.96 (30.98) | 398.35 (51.82) | 295.56 (8.82) | −1.49 (1.67) | −1.90 (3.44) | −0.14 (3.18) | 423.83 (56.36) | 403.89 (76.75) | 300.77 (27.07) |
| 10 ms SOA | ||||||||||||
| P1 | −0.23 (1.13) | −0.66 (1.04) | 0.36 (1.56) | 51.57 (11.26) | 53.81 (16.50) | 61.48 (22.30) | −0.37 (1.18) | −.06 (0.95) | .51 (1.44) | 60.24 (14.03) | 66.80 (13.19) | 68.94 (12.05) |
| N1 | −5.12 (1.65) | −4.72 (1.93) | −3.66 (2.24) | 128.21 (11.12) | 125.66 (9.64) | 134.98 (24.29) | −4.73 (1.26) | −4.49 (1.39) | −3.76 (2.15) | 130.24 (8.12) | 129.92 (7.86) | 135.29 (23.58) |
| P2 | 1.43 (2.74) | 1.90 (2.93) | 3.60 (4.18) | 176.73 (11.47) | 175.86 (15.55) | 184.45 (30.81) | 2.03 (2.31) | 2.38 (2.72) | 3.93 (4.60) | 175.16 (11.36) | 177.11 (14.81) | 193.45 (31.16) |
| N2 | −7.56 (3.45) | −5.96 (4.09) | −2.50 (5.53) | 243.52 (23.29) | 245.3 (25.45) | 249.47 (37.92) | −6.19 (3.20) | −4.85 (3.81) | −2.80 (4.55) | 247.94 (24.31) | 246.27 (27.74) | 241.87 (43.33) |
| P3 | −1.33 (3.08) | 0.177 (3.63) | 4.46 (4.72) | 326.67 (27.75) | 334.88 (26.69) | 279.73 (22.48) | −0.92 (3.50) | 1.00 (3.40) | 4.98 (4.70) | 331.96 (33.07) | 333.84 (21.48) | 298.22 (36.58) |
| N4 | −4.17 (2.47) | −3.13 (1.92) | −1.91 (1.76) | 382.04 (56.48) | 404.34 (51.77) | 292.78 (12.28) | −3.38 (2.64) | −2.12 (3.04) | −1.04 (4.33) | 388.75 (50.14) | 399.25 (67.64) | 306.03 (31.14) |
Values are means (SD).
170 ms SOA, conscious; 30 ms SOA, nonconscious discrimination; 10 ms SOA, nonconscious detection; Fz, Cz, Pz, midline sites.
Figure 2.
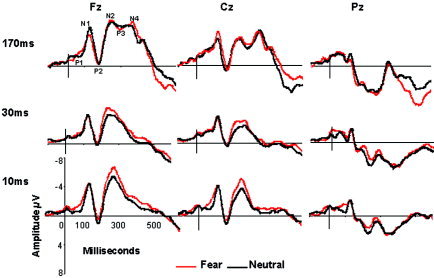
ERP responses to fear and neutral stimuli, across conscious (170 msec SOA) versus nonconscious discrimination (30 msec SOA) and detection (10 msec SOA) conditions, at recording sites Fz, Cz, and Pz.
There was a significant three‐way interaction between condition, emotion, and site for both N2 (F[4,76] = 3.06, P = 0.02) and N4 (F[4,76] = 3.49, P = 0.01) amplitude.
The three‐way effect for N2 was due to increased fronto‐central amplitude for fear relative to neutral for subthreshold (but not suprathreshold) conditions (30 msec SOA: Fz, f6 t[19] = 3.39, P = 0.003; Cz, t[19] = 3.72, P< 0.001; 10 msec SOA: Fz, t[19] = 4.27, P < 0.001; Cz, t[19] = 3.02, P = 0.007). When collapsing across emotion, N2 amplitude was most enhanced overall for the 10‐msec condition, and smallest for the 30‐msec condition, fronto‐centrally (Fig. 2), reflected in significant (P < 0.01) pairwise comparisons between all three conditions. This pattern of N2 amplitude accounted for significant two‐way interactions for condition by emotion (F[2,38] = 3.74, P = 0.03) and condition by site (F[4,76] = 7.43, P < 0.001), as well as a site by emotion interaction of borderline significance (F[2,38] = 3.11, P = 0.056), and main effects for site (F[2,38] = 41.90, P < 0.001) and emotion, at borderline significance (F[2,38] = 4.13, P = 0.056).
By contrast, the N4 three‐way interaction was explained primarily by differences in the suprathreshold condition. N4 responses to fear were greater than neutral only in the suprathreshold (170 msec SOA) condition (t[19] = 4.42, P < 0.001). N4 amplitude was also generally far larger in the suprathreshold condition than in subthreshold conditions at fronto‐central sites, and smallest in the subthreshold discrimination condition, reflected in significant pairwise comparisons (at P ≤ 0.01) between all three conditions for both fear and neutral stimuli at Fz and Cz (but not Pz) (Fig. 2). This pattern accounted for the significant condition by site interaction (F[4,76] = 13.98, P < 0.001), and main effects for condition (F[2,38] = 72.85, P < 0.001), emotion (F[1,19] = 8.71, P = 0.008), and site (F[2,38] = 46.66, P < 0.001).
There was a significant two‐way emotion by condition interaction for P1 latency (F[2,38] = 10.79, P < 0.001). P1 latency was relatively faster for fear versus neutral in the 10‐msec SOA condition (t[19] = −3.65, P = 0.002), but not for 30 msec or 170 msec SOA.
Main effects of emotion
Only N1 latency showed a significant main effect for emotion (F[1,19] = 6.46, P = 0.02), which reflected significantly faster responses to fear versus neutral stimuli (t[19] = 2.54, P = 0.02).
Skin conductance data
Mean data for SCR amplitude, rise time and number (% of total stimuli presented) are presented in Figure 3.
Figure 3.
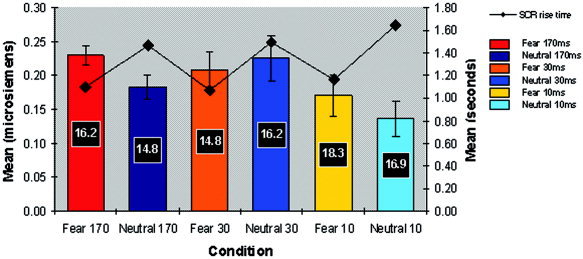
Mean SCR amplitude and number (Y‐axis I) and mean SCR rise time (Y‐axis 2) to fear and neutral stimuli across conscious (170 msec SOA), nonconscious discrimination (30 msec SOA) and nonconscious detection (10 msec SOA) conditions.
For SCR amplitude, MANOVA revealed a significant main effect for condition (F[2,18] = 6.04, P = 0.01). SCRs were generally larger in the nonconscious discrimination (30‐msec) condition, but smaller in the nonconscious detection (10‐msec) condition, relative to SCRs elicited by conscious perception (170‐msec SOA). Neither the main effect for emotion, nor the condition by emotion interaction reached significance. Planned contrasts showed that emotion‐related differences in SCR amplitude were significant only for the 170‐msec condition, in which SCRs were greater to fear than to neutral (t[19] = 2.21, P = 0.039) (Fig. 3).
For SCR rise time, there was a significant main effect for emotion (F[1,19] = 85.51, P < 0.0001), due to the pattern of consistently faster SCR rise time for fear versus neutral stimuli across all three conditions (170 msec, t[26] = 2.41, P = 0.023; 30 msec, t[30] = 2.75, P = 0.01; 10 msec, t[34] = 3.92, P < 0.0001) (Fig. 3).
The mean number of SCRs did not differ between across conditions or emotion, indicating that differences in amplitude and rise time could not be explained by SCR frequency.
ERP and skin conductance relationships
For the conscious perception (170‐msec) condition, there was a significant positive correlation between frontal N2 and SCR amplitude for fear (r[20] = 0.54, P = 0.013), but a significant negative correlation for neutral faces (r[20] = −0.50, P = 0.023). A comparison of these sample correlation coefficients, using the Fisher's z transformation and asymptotic test procedures of Meng et al. [1992] confirmed a significant difference between the values (z = 3.92, P < 0.0001). There were no significant associations between these variables for the nonconscious (10 and 30 msec) conditions. Faster N1 latency was associated with significantly reduced SCR rise time for fear in both the 170‐msec (r[20] = 0.47, P = 0.036) and 30‐msec (r[20] = 0.46, P = 0.042) conditions, and with the 10‐msec condition at borderline significance (r[20] = 0.44, P = 0.054), but there were no significant relationships for neutral. We found no significant associations for SCR indices with either N4 amplitude or P1 latency.
Time course analyses
MANOVA involving time revealed an isolated significant effect for N4 amplitude. The significant time by condition interaction (F[1,19] = 5.17, P = 0.035) was due to greater N4 amplitude across the second half of stimulus blocks for the 170‐msec condition.
DISCUSSION
The findings demonstrated that the time course of neural responses to conscious versus nonconscious perception of fear (relative to neutral) is differentiated by distinct ERP components within the first 400 msec of processing. Neuroimaging studies to date have focused on responses to emotional expressions that cannot be consciously discriminated [Morris et al.,1998; Whalen et al.,1998]. We established thresholds for nonconscious detection of stimuli (10 msec SOA) as well as nonconscious discrimination of emotion (30 msec SOA), which were compared to conscious perception (170 msec SOA). These SOAs are consistent with evidence from single‐neuron recording for a graded neuronal response to backward masking that declines sharply 30 msec after stimulus presentation [Rolls et al.,1999].
Nonconscious fear perception (both detection and discrimination) elicited greater responses for the negative‐going N2 component, elicited around 200 msec post‐stimulus. Nonconsciously detected fear also evoked a faster P1 response within 100 msec of stimulus onset, relative to neutral. Beyond 200 msec, however, there was a decline in activity. By contrast, conscious fear perception was distinguished by a more prominent N4, peaking around 400 msec. The waveform for conscious perception was both sustained and complex, consistent with evidence that later ERPs (generated after 200 msec) reflect endogenous activity, secondary to initial stimulus processing [Courchesne et al.,1975]. The dissociation in the findings for nonconscious (N2) and conscious (N4) perception was most apparent across fronto‐central sites, consistent with previous observations from both depth‐electrode and non‐face emotion studies [Halgren and Marinkovic,1995; Kiefer and Spitzer,2000].
We speculate that the enhanced N4 for conscious fear perception indexes the preferential engagement of cortical networks associated with the conceptual knowledge of the stimulus and integration of emotion in working memory [Adolphs,2002]. This proposal is consistent with MEG evidence that sustained prefrontal activity commences around 300 msec post‐onset for perception of fear expressions [Streit et al.,1999], and the role of prefrontal networks in emotionally appropriate decision making and context processing [Damasio,1996; Taylor et al.,2003]. In this regard, the N4 may provide a temporal correlate of the slower, cortico‐amygdala pathway for fear processing [Le Doux,1998].
In contrast, we speculate that the profile of enhanced and more rapid responses within 200 msec of nonconscious fear detection reflects modulation from a collateral pathway for sensory processing. Early ERP components generated within the first 200 msec of stimulus processing primarily reflect the initial volley of sensory afferents, particularly in the thalamo‐cortical circuit [Kropotov and Etlinger,1999]. For nonconscious detection of fear signals, early ERPs may be enhanced by collateral input from ascending brainstem tracts (such as the reticular activating system, with colliculus input), which subserve rapid and crude sensory alerting functions. The notion of an early alerting system has also been proposed in key theoretical models of attention [Fernandez‐Duque and Posner,1997]. The links between brainstem circuits and the midbrain central gray [Gray,1987] may allow for specific enhancement of nonconscious responses to fear signals.
It is worth emphasising that enhancement of neural activity within 200 msec of stimulus onset was most apparent for nonconscious detection of fear, versus neutral (i.e., 10‐msec SOA condition). Despite the N2 differentiation of fear, N2 amplitude was relatively attenuated at fronto‐central sites for nonconscious discrimination (i.e., 30‐msec SOA condition). There was also no evidence for faster P1 responses to nonconscious discrimination of fear. It is possible that some degree of conscious processing was achieved in this condition, given that stimulus detection was not explicitly precluded [Snodgrass et al.,1993]. This “smidgen of consciousness” may have caused a degree of subjective uncertainty about the stimulus, and thereby generally inhibited responses to the early integration of stimulus features.
Nonetheless, the comparative absence of activity beyond 200 msec for both nonconscious detection and discrimination of stimuli supports the view that there is effectively no secondary or top‐down processing of these stimuli. The indication that a transition to conscious processing is marked by neural responses around 200 msec is consistent with MEG evidence that detailed processing of facial emotion signals occurs within this temporal window [Adolphs,2002]. It also accords with the comparator model, in which the output tagged for conscious processing is determined by the comparison of incoming and stored information approximately every 200 msec in humans [Gray,1995].
Further evidence for discrimination of fear versus neutral across conditions was revealed by the SCR data. Notably, the rise time of SCRs was consistently faster for fear compared to neutral faces across each condition. SCR rise time has been related to heart rate acceleration, which occurs with defensive responding to threat‐related or aversive stimuli [Venables et al.,1980]. This pattern of SCR latency therefore provides independent evidence to suggest that the fear face was perceived as potentially more aversive than neutral, regardless of the level of awareness. Convergent evidence for this proposal was observed for the N1 component occurring around 100 msec post‐stimulus. The N1 showed a corresponding pattern of relatively faster responses to fear across all three conditions, reflected in the significant correlations between N1 latency and SCR rise time.
Although SCR rise time was consistently faster for both conscious and nonconscious perception of fear (vs. neutral), differences in SCR amplitude varied according to level of conscious awareness. SCRs were larger to consciously perceived fear, compared to neutral, consistent with a large pool of evidence from fear‐conditioning studies [Öhman and Soares,1998]. There was also a positive correlation between SCR and N2 amplitude for conscious fear perception, whereas the inverse was observed for neutral. This association is consistent with Adolphs' [2002] model of facial emotion processing, in which emotional reactions involving the body are elicited around 200 msec post‐stimulus. By contrast, differences in SCR amplitude between nonconsciously perceived fear and neutral did not reach significance, and were independent of N2 amplitude. The differentiation of SCR amplitude for conscious and nonconscious fear perception accords with evidence from peripheral autonomic failure patients that the modulation of central (specifically amygdala) responses by autonomic arousal occurs only for conscious processing of fear signals [Critchley et al.,2002]. Given our findings for SCR rise time, we suggest that nonconscious fear perception elicits initial arousal changes within intact autonomic systems (corresponding to the N1 time frame), but that bodily feedback from conscious appraisal of these changes is required to elicit more pronounced differences in peak arousal around the N2 latency window. Collateral reticular circuits may modulate rapid autonomic (as well as central) responses to nonconsciously perceived fear but, in the absence of a potentiating stimulus, feedback from conscious elaboration of “feeling” may be required to augment these responses.
Both ERP and SCR results should also be considered in light of potential limitations of the study. We first considered whether differential habituation might contribute to differences across conditions. SCRs were elicited throughout the experiment, with similar frequency in each condition, indicating that there was not any obvious response attenuation for peripheral indices. In the examination of rapid, within‐block response attenuation, the only significant effect was an increase (rather than decrease) in N4 amplitude from the first to second half of stimulus blocks for the conscious perception (170‐msec SOA) condition. This increase suggests that detailed conceptual analysis of stimuli may in fact show ongoing elaboration (rather than attenuation) during the 30‐sec block period. Second, although backward masking is used frequently to explore responses to below‐awareness stimuli [Frith et al.,1999], ERP studies need to consider the potential effects due to the onsets and offsets of masking stimuli. Here, the mask onset corresponded to the SOA for each condition, and offsets were 110 msec (with 10 msec SOA), 130 msec (with 30 msec SOA), and 270 msec (with 170 msec SOA). Although neural responses to these offsets may have contributed to the differentiation of nonconscious and conscious perception within the first 400 msec of processing, they cannot account for the distinction between fear and neutral and its interaction with awareness.
Taken together, the results of this study point to differentiation in the time course of conscious and nonconscious perception of fear within 400 msec post‐stimulus. In addition, nonconscious detection may be dissociated from nonconscious discrimination of fear during the earliest phase of processing, within 100 msec of stimulus onset. Follow‐up studies with additional emotional expression stimuli are warranted to determine whether these differences are specific to fear, or elicited more generally by emotionally arousing stimuli. These studies might also include additional electrode sites to explore the distribution, including laterality, of ERPs to nonconscious and conscious perception of facial emotion. Future neuroimaging studies may also provide important data on the role of subcortical‐cortical pathways in nonconscious detection versus conscious perception. Skin conductance, including rise time as well as more typical measures of amplitude, would provide an important independent index of perception in these studies.
Acknowledgements
We thank Professor M. Morgan, University College London, for his key contribution to the psychophysics research.
REFERENCES
- Adolphs R ( 2002): Neural systems for recognizing emotion. Curr Opin Neurobiol 12: 169–177. [DOI] [PubMed] [Google Scholar]
- Barry RJ, Sokolov EN ( 1993): Habituation of phasic and tonic components in the orienting reflex. Int J Psychophysiol 15: 39–42. [DOI] [PubMed] [Google Scholar]
- Bechara A, Damasio H, Tranel D, Damasio AR ( 1997): Deciding advantageously before knowing the advantageous strategy. Science 275: 1293–1294. [DOI] [PubMed] [Google Scholar]
- Bentin S, Allison T, Puce A, Perez E, McCarthy G ( 1996): Electrophysiological studies of face perception in humans. J Cog Neurosci 8: 551–565. [DOI] [PMC free article] [PubMed] [Google Scholar]
- Bentin S, Sagiv N, Mecklinger A, Friederici A, von Cramon YD ( 2002): Priming visual face‐processing mechanisms: electrophysiological evidence. Psychol Sci 13: 190–193. [DOI] [PubMed] [Google Scholar]
- Bernat E, Bunce S, Shevrin H ( 2001a): Event‐related potentials differentiate positive and negative mood adjectives during both supraliminal and subliminal visual processing. Int J Psychophysiol 42: 11–34. [DOI] [PubMed] [Google Scholar]
- Bernat E, Shevrin H, Snodgrass M ( 2001b): Subliminal visual oddball stimuli evoke a P300 component. Clin Neurophysiol 112: 159–171. [DOI] [PubMed] [Google Scholar]
- Blom JL, Anneveldt M ( 1982): An electrode cap tested. Electroencephalogr Clin Neurophysiol 54: 591–594. [DOI] [PubMed] [Google Scholar]
- Buchel C, Dolan RJ, Armony JL, Friston KJ ( 1999): Amygdala‐hippocampal involvement in human aversive trace conditioning revealed through event‐related functional magnetic resonance imaging. J Neurosci 19: 10869–10876. [DOI] [PMC free article] [PubMed] [Google Scholar]
- Calder AJ, Young AW, Rowland D, Perrett DI ( 1997): Computer‐enhanced emotion in facial expressions. Proc R Soc Lond B Biol Sci 264: 919–925. [DOI] [PMC free article] [PubMed] [Google Scholar]
- Carretié L, Iglesias J ( 1995): An ERP study on the specificity of facial expression processing. Int J Psychophysiol 19: 183–192. [DOI] [PubMed] [Google Scholar]
- Clark BM, Siddle DA, Bond NW ( 1992): Effects of social anxiety and facial expression on habituation of the electrodermal orienting response. Biol Psychol 33: 211–223. [DOI] [PubMed] [Google Scholar]
- Courchesne E, Hillyard SA, Galambos R ( 1975): Stimulus novelty, task relevance and the visual evoked potential in man. Electroencephalogr Clin Neurophysiol 39: 131–143. [DOI] [PubMed] [Google Scholar]
- Crich F, Koch C ( 1998): Consciousness and neuroscience. Cereb Cortex 8: 97–107. [DOI] [PubMed] [Google Scholar]
- Critchley HD, Mathias CJ, Dolan RJ ( 2002): Fear conditioning in humans: the influence of awareness and autonomic arousal on functional neuroanatomy. Neuron 33: 653–663. [DOI] [PubMed] [Google Scholar]
- Cuthbert BN, Schupp HT, Bradley MM, Birbaumer N, Lang PJ ( 2000): Brain potentials in affective picture processing: covariation with autonomic arousal and affective report. Biol Psychol 52: 95–111. [DOI] [PubMed] [Google Scholar]
- Damasio AR ( 1996): The somatic marker hypothesis and the possible functions of the prefrontal cortex. Philos Trans R Soc Lond B Biol Sci 351: 1413–1420. [DOI] [PubMed] [Google Scholar]
- Davis M ( 1992): The role of the amygdala in fear and anxiety. Annu Rev Neurosci 15: 353–375. [DOI] [PubMed] [Google Scholar]
- Diedrich O, Naumann E, Maier S, Becker G ( 1997): A frontal slow wave in the ERP associated with emotional slides. J Psychophysiol 11: 71–84. [Google Scholar]
- Dimberg U, Öhman A ( 1996): Behold the wrath: psychophysiological responses to facial stimuli. Motivation Emotion 20: 149–182. [Google Scholar]
- Ekman P, Friesen W ( 1976): Pictures of facial affect. Palo Alto: Consulting Psychologists Press. [Google Scholar]
- Esteves F, Öhman A ( 1993): Masking the face: recognition of emotional facial expressions as a function of the parameters of backward masking. Scand J Psychol 34: 1–8. [DOI] [PubMed] [Google Scholar]
- Fernandez‐Duque D, Posner MI ( 1997): Relating the mechanisms of orienting and alerting. Neuropsychologia 35: 477–486 [DOI] [PubMed] [Google Scholar]
- Frith C, Perry R, Lumer E ( 1999): The neural correlates of conscious experience: an experimental framework. Trends Cogn Sci 3: 105–114. [DOI] [PubMed] [Google Scholar]
- Gray JA ( 1987): The psychology of fear and stress, 2nd ed. Cambridge: Cambridge University Press. [Google Scholar]
- Gray JA ( 1995): The contents of consciousness: a neuropsychological conjecture. Behav Brain Sci 18: 659–722. [Google Scholar]
- Haig AR, Gordon E, Roberts G, Anderson J ( 1995): Classification of single‐trial ERP sub‐types: application of globally optimal vector quantization using simulated annealing. Electroencephalogr Clin Neurophysiol 94: 288–297. [DOI] [PubMed] [Google Scholar]
- Halgren E, Marinkovic K ( 1995): Neurophysiological networks integrating human emotions In: Gazzainga M, editor. The cognitive neurosciences. Cambridge: MIT Press; p 1137–1152. [Google Scholar]
- Kiefer M, Spitzer M ( 2000): Time course of conscious and unconscious semantic brain activation. Neuroreport 11: 2401. [DOI] [PubMed] [Google Scholar]
- Kropotov JD, Etlinger SC ( 1999): Selection of actions in the basal ganglia‐thalamocortical circuits: review and model. Int J Psychophysiol 31: 197–217. [DOI] [PubMed] [Google Scholar]
- LaBar KS, Gatenby JC, Gore JC, LeDoux JE, Phelps EA ( 1998): Human amygdala activation during conditioned fear acquisition and extinction: a mixed‐trial fMRI study. Neuron 20: 937–945. [DOI] [PubMed] [Google Scholar]
- Lang SF, Nelson CA, Collins PF ( 1990): Event‐related potentials to emotional and neutral stimuli. J Clin Exp Neuropsychol 12: 946–958. [DOI] [PubMed] [Google Scholar]
- LeDoux JE ( 1998): The emotional brain. New York: Touchstone. [Google Scholar]
- Lim CL, Rennie C, Barry RJ, Bahramali H, Lazzaro I, Manor BR, Gordon E ( 1997): Decomposing skin conductance into tonic and phasic components. Int J Psychophysiol 25: 97–109. [DOI] [PubMed] [Google Scholar]
- Macmillan N ( 1986): The psychophysics of subliminal perception. Behav Brain Sci 9: 38–39. [Google Scholar]
- Marzi CA, Girelli M, Miniussi C, Smania N, Maravita A ( 2000): Electrophysiological correlates of conscious vision: evidence from unilateral extinction. J Cogn Neurosci 12: 869–877. [DOI] [PubMed] [Google Scholar]
- Meng X, Rosenthal R, Rubin DR ( 1992): Comparing correlated correlations. Psychol Bull 111: 172–175. [Google Scholar]
- Mikhailova EG, Bogomolova IV ( 1999): The evoked cortical activity of the cerebral hemispheres in man during the active and passive perception of facial expression. Zhurnal Vysshei Nervnoi Deiatelnosti Imeni IP Pavlova 49: 566–575. [PubMed] [Google Scholar]
- Molholm S, Ritter W, Murray MM, Javitt DC, Schroeder CE, Foxe J ( 2002): Multisensory auditory‐visual interactions during early sensory processing in humans: a high‐density electrical mapping study. Brain Res Cogn Brain Res 14: 115–128. [DOI] [PubMed] [Google Scholar]
- Morris JS, DeGelder B, Weiskrantz L, Dolan RJ ( 2001): Differential extrageniculostriate and amygdala responses to presentation of emotional faces in a cortically blind field. Brain 124: 1241–1252. [DOI] [PubMed] [Google Scholar]
- Morris JS, Öhman A, Dolan RJ ( 1998): Conscious and unconscious emotional learning in the human amygdala. Nature 393: 467–470. [DOI] [PubMed] [Google Scholar]
- Morris JS, Ohman A, Dolan RJ ( 1999): A subcortical pathway to the right amygdala mediating “unseen” fear. Proc Nat Acad Sci USA 96: 1680–1685. [DOI] [PMC free article] [PubMed] [Google Scholar]
- Öhman A, Soares JJ ( 1998): Emotional conditioning to masked stimuli: expectancies for aversive outcomes following nonrecognized fear‐relevant stimuli. J Exp Psychol Gen 127: 69–82. [DOI] [PubMed] [Google Scholar]
- Phillips ML, Young AW, Senior C, Brammer M, Andrew C, Calder AJ, Rowland D, Brammer M., Bullmore ET, Andrew C, Williams SCR, Gray JA, David AS ( 1997): A specific neural substrate for perceiving facial expressions of disgust. Nature 389: 495–498. [DOI] [PubMed] [Google Scholar]
- Pizzagalli DA, Lehmann D, Hendrick AM, Regard M, Pascual‐Marqui RD, Davidson RJ ( 2002): Affective judgments of faces modulate early activity (approximately 160 msec) within the fusiform gyri. Neuroimage 16: 663–677. [DOI] [PubMed] [Google Scholar]
- Rolls ET, Tovee MJ, Panzeri S ( 1999): The neurophysiology of backward visual masking: information analysis. J Cogn Neurosci 11: 300–311. [DOI] [PubMed] [Google Scholar]
- Schweinberger SR, Burton AM ( 2003): Covert recognition and the neural system for face processing. Cortex 39: 9–30. [DOI] [PubMed] [Google Scholar]
- Shevrin H ( 2001): Event‐related markers of unconscious processes. Int J Psychophysiol 42: 209–218. [DOI] [PubMed] [Google Scholar]
- Snodgrass M, Shevrin H, Kopka M ( 1993): The mediation of intentional judgments by unconscious perceptions: the influences of task strategy, task preference, word meaning, and motivation. Conscious Cogn 2: 169–193. [Google Scholar]
- Sokolov EN, Boucsein W ( 2000): A psychophysiological model of emotional space. Integr Physiol Behav Sci 35: 81–119. [DOI] [PubMed] [Google Scholar]
- Streit M, Ioannides AA, Liu L, Wolwer W, Dammers J, Gross J, Gaebel W, Muller‐Gartner HW ( 1999): Neurophysiological correlates of the recognition of facial expressions of emotion as revealed by magnetoencephalography. Brain Res Cogn Brain Res 7: 481–491. [DOI] [PubMed] [Google Scholar]
- Tabachnick BG, Fiddell LS ( 1989): Using multivariate statistics. New York: Harper & Row. [Google Scholar]
- Taylor SF, Phan KL, Decker LR, Liberzon I ( 2003): Subjective rating of emotionally salient stimuli modulates neural activity. Neuroimage 18: 650–659. [DOI] [PubMed] [Google Scholar]
- Venables PH, Gartshore SA, O'Riordan PW ( 1980): The function of skin conductance response recovery and rise time. Biol Psychol 10: 1–6. [DOI] [PubMed] [Google Scholar]
- Whalen PJ, Rauch SL, Etcoff NL, McInerney SC, Lee MB, Jenike MA ( 1998): Masked presentations of emotional facial expressions modulate amygdala activity without explicit knowledge. J Neurosci 18: 411–418. [DOI] [PMC free article] [PubMed] [Google Scholar]
- Williams LM, Gordon E, Bahramali H, Wright J, Meares R ( 2000): Late component ERPs are associated with distinct schizophrenic syndromes. Int Neurosci 105: 37–52. [DOI] [PubMed] [Google Scholar]
- Williams LM, Phillips ML, Brammer MJ, Skerrett D, Lagopoulos J, Rennie C, Bahramali H, Oliveri G, David AS, Peduto A, Gordon E ( 2001): Arousal dissociates amygdala and hippocampal fear responses: evidence from simultaneous fMRI and skin conductance recordings. Neuroimage 14: 1070–1079. [DOI] [PubMed] [Google Scholar]
- Wong PS, Shevrin H, Williams WJ ( 1994): Conscious and nonconscious processes: an ERP index of an anticipatory response in a conditioning paradigm using visually masked stimuli. Psychophysiology 35: 87–101. [DOI] [PubMed] [Google Scholar]