

Abstract
Intracranial EEG was analyzed from 16 pharmaco‐resistant epilepsy patients. Subjects participated in memory tasks for faces and/or words. Face‐selective coherence increases were found between the fusiform gyrus and temporal, parietal, and frontal cortices at 160–230 ms poststimulus onset. Word stimuli elicited weak or negligible response at the same latency. Phase lag increased monotonically with distance from the fusiform region. The slope was consistent with conduction velocities of myelinated cortico‐cortical pathways. These results suggest that the contribution of the fusiform gyrus to face processing at around 200 ms poststimulus onset is rapidly projected to widespread cortical regions. Hum. Brain Mapping 11:286–293, 2000. © 2000 Wiley‐Liss, Inc.
Keywords: intracranial EEG, humans, prefrontal cortex, temporal lobe, supramarginal gyrus, gamma rhythm, alpha rhythm, binding
INTRODUCTION
Coherent neural activity has been hypothesized as a mechanism by which elements of a stimulus and its context are bound into a perceptual or cognitive event [Gray et al., 1989; Llinas and Ribary, 1993; Usher and Donnelly, 1998]. This may happen within a small cortical region [Menon et al., 1996] or span across distant parts of the brain [Rodriguez, et al., 1999]. However, these theories have proven difficult to test with scalp EEG recordings in humans because of spatial blurring caused by signal superposition and intervening tissues, especially the skull [Srinivasan et al., 1998]. Moreover, scalp EEG recordings have particular difficulty sampling deep cortical regions such as the ventral occipitotemporal cortex.
Lesions of a small region in the fusiform gyrus, located bilaterally at the junction of the ventral temporal and occipital lobes, can produce profound and specific deficits in face processing [Damasio et al., 1990]. This region is anterior to the retinotopic visual areas, and posterior to the memory‐related regions of the ventral temporal lobe [Halgren et al., 1999]. It is specifically activated by faces, according to PET and fMRI [Kanwisher et al., 1997; Halgren et al., 1999; Haxby et al., 2000], with a peak response about 180 ms after face onset seen with MEG [Halgren et al., 2000] and intracranial EEG (iEEG) [Allison et al., 1994; Halgren et al., 1994a]. This peak immediately follows processing in retinotopic cortex and immediately precedes more cognitive processing in ventral temporal and frontal areas that occurs from 240–600 ms [Allison et al., 1994; Halgren et al., 1994a, 1994b; Klopp et al., 1999; Marinkovic et al., 2000]. The fusiform peak at about 180 ms to faces is associated with a focal increase in event‐related spectral power lasting about 60 ms [Klopp et al., 1999]. This response, selective for faces as compared to words, has not been seen in other cortical sites sampled including frontal, Rolandic, and parietal areas.
Thus, the cognitive correlates, timing, and location of the fusiform response to faces at about 180 ms all suggest that it may specifically encode face stimuli for subsequent processing in more cognitive association areas. If so, then the models cited above might predict that this transfer of information from the fusiform gyrus to association areas is reflected in an increase in coherence between their locally recorded EEGs. This prediction was tested in this study using direct intracerebral recordings.
MATERIALS AND METHODS
Participants
All 16 subjects (6 females and 10 males, 1 left‐handed) suffered from pharmaco‐resistant complex partial epilepsy and were candidates for surgical therapy [Chauvel et al., 1996]. Depth electrodes were recommended only if noninvasive measures were inadequate to identify the seizure focus. The decision to implant electrodes, the location of electrodes, and the duration of implantation were based exclusively on clinical considerations independent of the current study. Subjects gave fully informed consent and were monitored by institutional review boards. These recordings have previously been analyzed with respect to ERPs [Halgren et al., 1994a, 1994b] and spectral power [Klopp et al., 1999].
Behavioral Tasks
The delayed recognition task required pressing a key to repeated stimuli, which occurred on 50% of the trials. Subjects responded with their dominant hand. This was the right hand in all but one subject. Either faces or words were presented in separate blocks (140–280 trials per condition). Six subjects performed both face and word tasks while six performed only the face task and four completed only the word task.
During the delayed recognition tasks, the subject reclined on a bed with his or her back elevated and maintained fixation on a target in front of him or her. Stimulus presentation was controlled and behavioral responses were monitored for latency and accuracy by a microcomputer. Faces were shown as color slides on a back projection screen and words on a video monitor. Stimuli were presented every 3 sec for a duration of 300 ms. The face stimuli were photographs of previously unfamiliar young adults of European descent who lacked beards or mustaches and subtended a visual angle of 5.5° horizontal by 8.3° vertical. Words subtended a visual angle of 1.3 to 1.5° horizontal by 0.4° vertical. They were sampled from both low‐ and high‐lexical frequency lists.
Electrodes and Localization
EEG was analyzed from 957 iEEG depth contacts (47–86 per subject) located in right temporal, parietal, Rolandic, and frontal regions (Fig. 1). Depth probes were 0.8 mm in diameter, blunt‐tipped, and had 5, 10, or 15 recording contacts. Recording contacts were 2.0 mm in length, and adjacent contacts were separated by 1.5 mm. Waveforms were bandpass filtered from 0.1 to 80 Hz and digitized every 6 ms at 12‐bit resolution for 1,200 ms beginning 120 ms before stimulus onset and referenced to the tip of the nose. Localization of electrode placement was based upon stereotactic MRI and stereoscopic stereotactic arteriography [Talairach and Tournoux 1988; Musolino et al., 1990].
Figure 1.
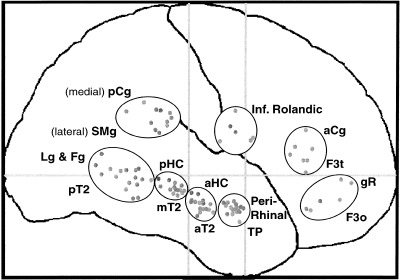
Lateral view of electrode locations after transformation to Talairach coordinates [Talairach and Tournoux, 1988]. All probes project perpendicular to the midline (aCg = anterior cingulate gyrus; pCg = posterior cingulate gyrus; F3o = inferior frontal gyrus pars orbitalis; F3t = inferior frontal gyrus pars triangularis; Fg = fusiform gyrus; aHC = anterior hippocampus; pHC = posterior HC; Lg = lingual gyrus; gR = gyrus rectus; SMg = supra marginal gyrus; aT2 = anterior level of the middle temporal gyrus; mT2 = middle T2; pT2 = posterior T2; TP = temporal pole). Please note that the peri‐rhinal probes often did pass through the amygdala but, because amygdalar cells are multipolar and not aligned, it was considered unlikely that they generated significant EEG signals. The middle temporal gyrus probes sampled cortex in the superior temporal sulcus as they passed inferior to it for 10–15 mm. Similarly, probes with the supramarginal g. label may have sampled the anterior part of the intraparietal sulcus, as they may run inferior to it (see Halgren et al., 1995a, 1995b for discussion).
Analysis
Trials contaminated by epileptiform EEG spikes, eye movements, or other large transients were excluded on amplitude criteria set individually for each patient. The effectiveness of these artifact rejection routines was carefully monitored by visual inspection of the graphics display. On average, 16% of the trials were rejected, and an additional 6% of the electrode contacts were rejected due to their location within epileptogenic areas.
Coherence and phase were calculated in 192 ms epochs of raw EEG data, within a range of 5–45 Hz between all possible combinations of electrode pairs. A sliding window was used in order to attain a higher temporal resolution of changing coherence patterns. That is, coherence values were recalculated after shifting the window by an increment of 24 ms (12.5%) from the preceding window. Raw coherence estimates on individual trials and electrode pairs ranged widely (0.02–0.99). Mean coherence across trials, frequencies, and electrode pairs was 0.6 ± 0.1 SD. Baseline coherence was subtracted on an individual trial basis and the resulting coherence time course was averaged across individual trials and then divided by the coherence standard deviation (calculated across trials) to yield a z‐score.
To determine the phase between electrode pairs, the absolute phase angle was averaged across trials to yield a value from 0 to 2π radians. Radian values were converted into milliseconds by multiplying the percentage of a complete cycle (phase angle/2π) by the duration of a single cycle (i.e., 25 ms for gamma and 100 ms for alpha). In order to isolate stimulus‐evoked changes in phase coupling, baseline phase values were subtracted from the phase in poststimulus windows. A linear least‐squares regression was used to estimate the relation between the phase angle and distance between sites.
Statistics
Analytic statistical measures were corrected for multiple measures by multiplying probability levels by the number of tests performed for each iEEG contact × the percentage by which adjacent iEEG epochs overlapped [Keppel and Zedeck, 1998]. Given that successive probability measures are not independent this correction is expected to underestimate statistical significance. Across‐subject z‐score averages were obtained by multiplying the average z‐score by the square root of the number of subjects included in the average. P < 0.05 was taken as a minimal threshold for significance.
RESULTS AND DISCUSSION
Spectral analysis was applied to iEEG that was collected from 16 human subjects. Each subject participated in memory tasks for faces and/or words. IEEG recordings were grouped into 15 commonly implanted areas in the temporal, parietal, Rolandic, and prefrontal regions (Fig. 1). A striking increase in coherence was seen between the fusiform gyrus and each of these other sites in individual subjects (Fig. 2), as well as in across‐subject averages (Fig. 3). The average period of coherence increase was centered from 160–230 ms poststimulus onset (P < 0.025 for the alpha band at 200 ms in 9 of 10 subjects). The remaining subject had similar coherence activation in response to face stimuli but at a greater latency of 350–400 ms. The coherence increase was highly selective for faces in five of the six subjects with recordings in both conditions; word stimuli elicited weak or no response around 200 ms except in one subject who displayed a similar coherence increase to both words and faces.
Figure 2.
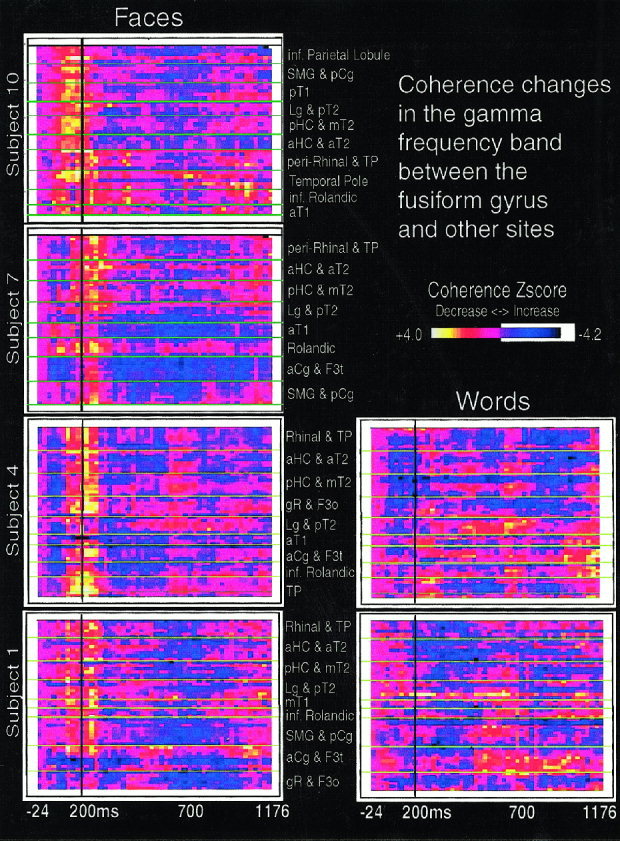
Individual subject gamma‐band coherence maps. A face‐selective widespread and transient coherence increase is observed between the fusiform gyrus and other areas centered at 200 ms poststimulus onset (vertical line). Coherence values are normalized to baseline coherence and expressed as z‐scores. Subjects 1 and 4 show results from both face and word stimuli. Subjects 7 and 10 performed only the face task. Maps are organized vertically by regions, with horizontal lines in the coherence map dividing different depth probes. For example, the top box from subject 1 displays coherence time series between iEEG recorded in the fusiform gyrus and that recorded by 8 electrode contacts on a probe passing from peri‐rhinal cortex to the temporal pole. The box just below this displays coherence time series between the fusiform gyrus and a probe passing from anterior hippocampus to the anterior middle temporal gyrus. Within each box, electrode contacts are arranged from medial (bottom) to lateral (top), as they were located on the depth electrode probe. Abbreviations as in Figure 1.
Figure 3.
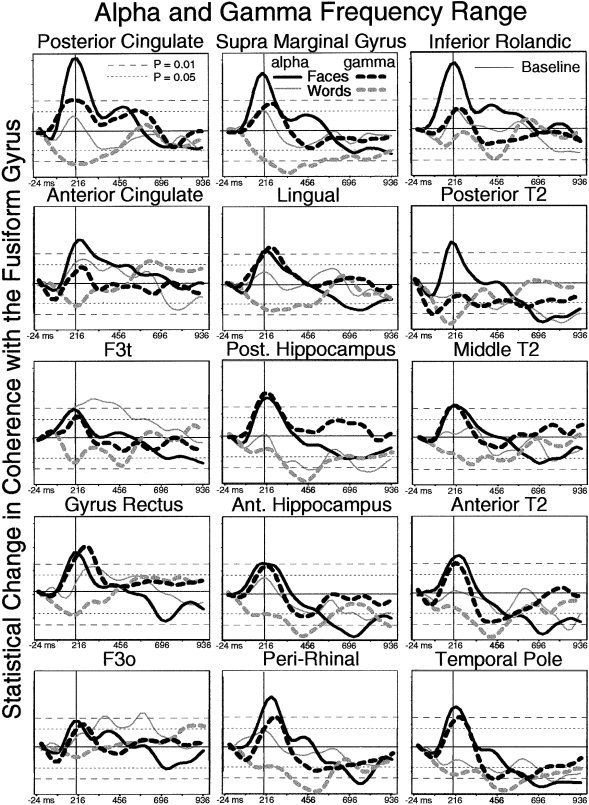
Across‐subject averages of alpha and gamma‐band coherence between the fusiform gyrus and 15 other areas. A sharp transient face‐selective increase in coherence centered at 200 ms is seen in all sites for alpha activity and a majority of sites in the gamma band. Abbreviations as in Figure 1.
Significant increases in coherence with similar time‐courses were seen in all frequency bands examined (from 5 to 45 Hz), with the highest and most regular increases in the alpha and gamma bands. In the alpha band, regions that were most coherent with the fusiform region included the posterior cingulate gyrus, supramarginal gyrus, inferior Rolandic cortex, posterior hippocampus, middle and anterior levels of the middle temporal gyrus, gyrus rectus, peri‐rhinal cortex, and temporal pole. Regions that showed a prominent increase in gamma band coherence included the posterior level of the middle temporal gyrus, anterior cingulate gyrus, inferior Rolandic cortex, and inferior frontal gyrus pars triangularis (Fig. 3).
The above results were based on coherence measures that were generated using the fusiform gyrus as the target area compared with all other cortical sites. In order to examine if the early coherence increase was limited to this target site we used a selection of other recording sites as targets, including peri‐rhinal cortex, middle temporal gyrus, hippocampus, inferior frontal gyrus, gyrus rectus, posterior cingulate gyrus, and Heschl's gyrus from a subset of six subjects. Coherence estimates were calculated in the same manner using these alternative targets with respect to all other cortical recording sites. This sample of target regions failed to reveal a pattern of wide spread coherence increases around 200 ms as were observed when using the fusiform gyrus as the target region (Fig. 4).
Figure 4.
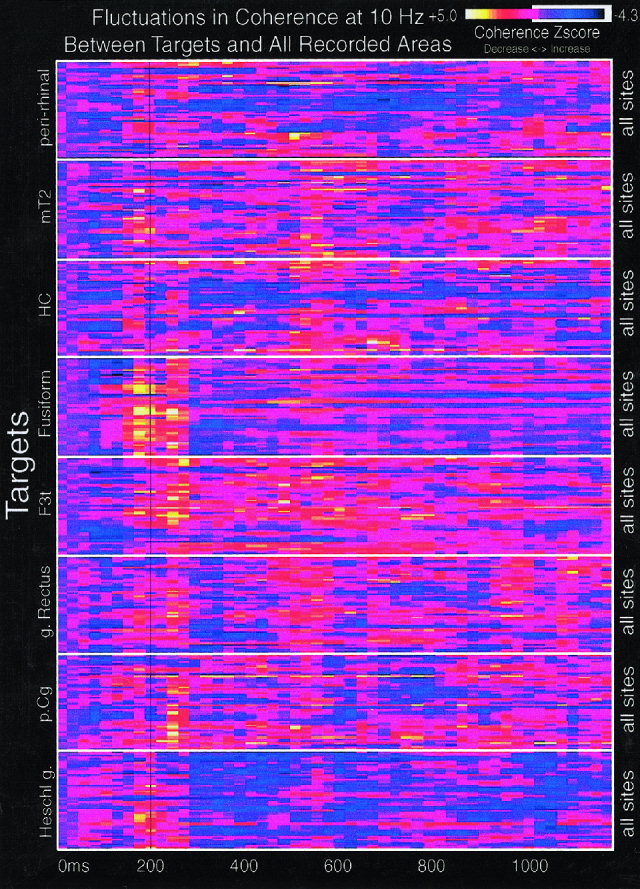
Coherence maps for an individual subject, in the alpha‐band, between multiple targets and all recorded sites. The coherence maps in the previous figures show coherence between only one target (the fusiform gyrus) and other cortical regions. This figure shows coherence between eight targets (Heschl's gyrus, posterior cingulate gyrus, gyrus rectus, inferior frontal gyrus pars triangularis, fusiform gyrus, hippocampus, middle temporal gyrus, and peri‐rhinal cortex) and the full set of 55 cortical recording sites from subject 1. The vertical black line marks 200 ms poststimulus onset. Horizontal lines divide each target region. For example, the top box shows a single peri‐rhinal EEG contact compared to all other EEG contacts and the box below this shows a single mT2 contact compared to all other EEG contacts, etc. The fusiform gyrus produces a large, widespread increase in coherence centered at about 200 ms whereas other target regions fail to produce similar results.
A transient phase locking between the fusiform gyrus and other sites occurred at around 200 ms, simultaneously with the peak in coherence. Phase lag was quantified during this peak response using a large time window of 120–500 ms in order to yield a more stable measurement. The resulting phase lag values were directly related to the distance from the fusiform region (Fig. 5). In the gamma band, electrode contacts closest to the fusiform produced the lowest phase angles of an average 1 ms while electrode contacts furthest from the fusiform had the highest phase angles at an average of 4.2 ms. Signal conduction velocities were then estimated between recording sites. The resulting slope of phase versus distance, estimated by a linear least‐squares fit, yielded conduction velocities of 23.5 m/s in the gamma band and 8.7 m/s in the alpha frequency range. These values appear to fall within realistic conduction velocities of myelinated axons in the human brain [Waxman, 1980].
Figure 5.
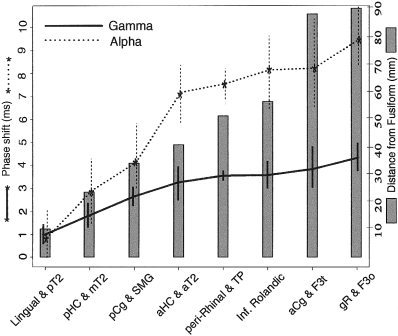
The phase lag and standard deviation (measured from individual trials from 120 to 500 ms poststimulus onset and averaged across subjects) between the fusiform gyrus and other cortical regions increased with the distance separating them.
The correlation between phase angle and distance from the fusiform gyrus was highest for face stimuli measured in the gamma frequency range (r = 0.83). Other frequencies showed similar tendencies. For example, in response to face stimuli the alpha band also produced a high correlation between phase angle and distance from the fusiform gyrus (r = 0.80); P < 0. 0001 for both gamma and alpha correlation values based on bootstrap resampling simulation statistics [Efron and Tibshirani, 1991]. The phase angle versus distance correlation values were lower during word stimuli (r = 0.59 for gamma, r = 0.58 for alpha) but remained significant at P < 0.01.
There are two major findings in this study: 1) Widespread and wide‐band coherence between the fusiform gyrus and other cortical sites transiently increases at 200 ms poststimulus onset in response to face, but not word, stimuli; 2) The phase lag between the fusiform gyrus and other structures increases with distance.
Previous studies (see Introduction) indicate that the fusiform gyrus makes a specific contribution to face processing at around 200 ms poststimulus onset. The coherence measures presented in this study show that during this critical period of face encoding, the neural activity in many regions of the brain display a transient entrainment to the fusiform region. These areas are thought to encode diverse aspects of faces, including their identity (temporal pole [Damasio et al., 1990] and hippocampus [Heit et al., 1988]), familiarity (hippocampus [Halgren et al., 1994a] and rhinal cortex [Murray and Bussey, 1999]), gaze direction (posterior middle temporal gyrus [Puce et al., 1998; Haxby et al., 2000]), emotional expression (ventrolateral prefrontal cortex [Marinkovic et al., 2000]), and attention (anterior and posterior cingulate, supramarginal gyrus, gyrus rectus [Mesulam, 1990; Baudena et al., 1995; Halgren et al., 1995a; Corbetta et al., 2000; Haxby et al., 2000]). Indeed, given that all areas examined showed this phasic coherence increase, and that the areas were not selected for involvement in face processing, it seems likely that other cortical areas also show increases in coherence with the fusiform gyrus.
In conclusion, previous studies have shown an activation of the human fusiform gyrus at about 200 ms that is presumed to mediate face‐specific encoding [Allison et al., 1994; Halgren et al., 1994a]. The current results suggest that this information is projected quickly and widely to other cortical sites that may encode other dimensions of the stimulus, and/or may direct the resulting cortical processing.
Acknowledgements
Data was collected at the Neurosurgical Service, Sainte Anne's Hospital, Paris, and the Van Gogh Center, Pontchaillou Hospital, Rennes, France. We thank P. Baudena, J. Clarke, J.P. Vignal, S. Trottier, B. Devaux, J. Chodkiewicz, and J.M. Scarabin.
REFERENCES
- Allison T, Ginter H, McCarthy G, Nobre A, Puce A, Luby M, Spencer D (1994): Face recognition in human extrastriate cortex. J Neurophysiol 71: 821–825. [DOI] [PubMed] [Google Scholar]
- Baudena P, Halgren E, Heit G, Clarke JM (1995): Intracerebral potentials to rare target and distractor auditory and visual stimuli. III. Frontal cortex. Electroencephalogr Clin Neurophysiol 94: 251–264. [DOI] [PubMed] [Google Scholar]
- Chauvel P, Vignal J, Biraben A, Badier J, Scarabin J (1996): Stereoelectroencephalography. Multimethodological assessment of the localization‐related epilepsy. In: Pawlik G, Stefan H, editors. New York: Springer‐Verlag, pp 135–163. [Google Scholar]
- Corbetta M, Kincade JM, Ollinger JM, McAvoy MP, Shulman GL (2000): Voluntary orienting is dissociated from target detection in human posterior parietal cortex. Nat Neurosci 33: 292–297. [DOI] [PubMed] [Google Scholar]
- Damasio AR, Tranel D, Damasio H (1990): Face agnosia and the neural substrates of memory. Annu Rev Neurosci 13: 89–109. [DOI] [PubMed] [Google Scholar]
- Efron B, Tibshirani R (1991): Statistical data analysis in the computer age. Science 253: 390–395. [DOI] [PubMed] [Google Scholar]
- Gray C, Konig P, Engel A, Singer W (1989): Oscillatory responses in cat visual cortex exhibit inter‐columnar synchronization which reflects global stimulus properties. Nature 338: 334–337. [DOI] [PubMed] [Google Scholar]
- Halgren E, Baudena P, Clarke JM, Heit G, Liegeois C, Chauvel P, Musolino A (1995a): Intracerebral potentials to rare target and distractor auditory and visual stimuli. I. Superior temporal plane and parietal lobe. Electroencephalogr Clin Neurophysiol 94: 191–220. [DOI] [PubMed] [Google Scholar]
- Halgren E, Baudena P, Clarke JM, Heit G, Marinkovic K, Devaux B, Vignal JP, Biraben A (1995b): Intracerebral potentials to rare target and distractor auditory and visual stimuli: 2. Medial, lateral and posterior temporal lobe. Electroenceph Clin Neurophys 94: 229–250. [DOI] [PubMed] [Google Scholar]
- Halgren E, Baudena P, Heit G, Clarke JM, Marinkovic K (1994a): Spatio‐temporal stages in face and word processing. 1. Depth‐recorded potentials in the human occipital, temporal and parietal lobes. J Physiol (Paris) 88: 1–50. [DOI] [PubMed] [Google Scholar]
- Halgren E, Baudena P, Heit G, Clarke JM, Marinkovic K, Chauvel P (1994b): Spatio‐temporal stages in face and word processing. 2. Depth‐recorded potentials in the human frontal and Rolandic cortices. J Physiol (Paris) 88: 51–80. [DOI] [PubMed] [Google Scholar]
- Halgren E, Dale AM, Sereno MI, Tootell RB, Marinkovic K, Rosen BR (1999): Location of human face‐selective cortex with respect to retinotopic areas. Hum Brain Mapp 7: 29–37. [DOI] [PMC free article] [PubMed] [Google Scholar]
- Halgren E, Raij T, Marinkovic K, Jousmäki V, Hari R (2000): Cognitive response profile of the human fusiform face area as determined by MEG. Cereb Cortex 10: 69–81. [DOI] [PubMed] [Google Scholar]
- Haxby JV, Hoffman EA, Gobbini MI (2000): The distributed human neural system for face perception. Trends Cogn Sci 4: 223–233. [DOI] [PubMed] [Google Scholar]
- Heit G, Smith ME, Halgren E (1988): Neural encoding of individual words and faces by the human hippocampus and amygdala. Nature 333: 773–775. [DOI] [PubMed] [Google Scholar]
- Kanwisher N, McDermott J, Chun M (1997): The fusiform face area: a module in human extrastriate cortex specialized for face perception. J Neurosci 17: 4302–4311. [DOI] [PMC free article] [PubMed] [Google Scholar]
- Keppel G, Zedeck S (1998): Data analysis for fesearch designs. New York: W.H. Freeman and Co. [Google Scholar]
- Klopp J, Halgren E, Marinkovic K, Nenov V (1999): Face‐selective event‐related spectral changes in the human fusiform gyrus. Clin Neurophysiol 110: 677–683. [DOI] [PubMed] [Google Scholar]
- Llinas R, Ribary U (1993): Coherent 40‐Hz oscillation characterizes dream state in humans. Proc Natl Acad Sci U S A 90: 2078–2081. [DOI] [PMC free article] [PubMed] [Google Scholar]
- Marinkovic K, Trebon P, Chauvel P, Halgren E (2000): Localized face‐processing by the human prefrontal cortex: Face‐selective intracerebral potentials and post‐lesion deficits. Cogn Neuropsychol 17: 187–199. [DOI] [PubMed] [Google Scholar]
- Menon V, Freeman W, Cutillo B, Desmond J, Ward M, Bressler S, Laxer K, Barbaro N, Gevins A (1996): Spatio‐temporal correlations in human gamma band electrocorticograms. Electroencephalogr Clin Neurophysiol 98: 89–102. [DOI] [PubMed] [Google Scholar]
- Mesulam M (1990): Large‐scale neurocognitive networks and distributed processing for attention, language, and memory. Ann Neurol 28: 597–613. [DOI] [PubMed] [Google Scholar]
- Murray E, Bussey T (1999): Perceptual‐mnemonic functions of the perirhinal cortex. Trends Cogn Sci 3: 142–151. [DOI] [PubMed] [Google Scholar]
- Musolino A, Tournoux P, Missir O, Talairach J (1990): Methodology of “in vivo” anatomical study and stereo‐electroencephalographic exploration in brain surgery for epilepsy. J Neuroradiol 17: 67–102. [PubMed] [Google Scholar]
- Puce A, Allison T, Bentin S, Gore JC, McCarthy G (1998): Temporal cortex activation in humans viewing eye and mouth movements. J Neurosci 18: 2188–2199. [DOI] [PMC free article] [PubMed] [Google Scholar]
- Rodriguez E, George N, Lachaux J, Martinerie J, Renault B, Varela F (1999): Perception's shadow: long‐distance synchronization of human brain activity. Nature 397: 430–433. [DOI] [PubMed] [Google Scholar]
- Srinivasan R, Nunez P, Silberstein R (1998): Spatial filtering and neocortical dynamics: estimates of EEG coherence. IEEE Trans Biomed Eng 45: 814–826. [DOI] [PubMed] [Google Scholar]
- Talairach J, Tournoux P (1988): Co‐planar stereotaxic atlas of the human brain. New York: Thieme. [Google Scholar]
- Usher M, Donnelly N (1998): Visual synchrony affects binding and segmentation in perception. Nature 394: 179–182. [DOI] [PubMed] [Google Scholar]
- Waxman S (1980): Determinants of conduction velocity in myelinated nerve fibers. Muscle nerve 3: 141–150. [DOI] [PubMed] [Google Scholar]