Abstract
Our objective was to develop a novel factor‐based analysis of the morphology of the corpus callosum and assess its applicability to the study of normal development, intelligence, and other subject characteristics. The contour of the corpus callosum was defined in the midsagittal planes of the MRI scans of 325 subjects, 6 to 88 years of age. The contours were coregistered, rescaled, and resampled to 50 points that were then entered into a principal components analysis with varimax rotation. The analysis yielded 8 factors for the contours of 138 healthy subjects. A second analysis of contours from 187 subjects in a patient group extracted 8 similar factors. Correlations of factor scores with conventional measures of callosum shape supported the construct validity of the assignment of morphological features to each of the factors. Correlations of factor scores with age, sex, handedness, ventricular volume, and IQ demonstrated the predictive validity of the factor structure and helped to define the neural correlates of these subject characteristics. We conclude that factor‐based measures capture latent morphological features of the corpus callosum that are reliable and valid. Future studies will determine whether these novel measures are more closely related to neurobiologically important features of the corpus than are conventional measures of callosum size and shape. Hum. Brain Mapping 12:232–245, 2001. © 2001 Wiley‐Liss, Inc.
Keywords: corpus callosum, magnetic resonance imaging, principal components, statistics, development, aging, intelligence, morphometry
INTRODUCTION
The corpus callosum (CC) is by far the largest fiber tract and interhemispheric commissure in the human brain. Its integrity is required for the integration and efficient lateralization of function within the cerebral hemispheres [Engel et al., 1991]. The topographical ordering of transcallosal axons along the anterior‐posterior axis [de Lacoste‐Utamsing et al., 1985; Pandya and Seltzer, 1986] has motivated the study of the size and shape of CC subdivisions in imaging‐based investigations of hemispheric connectivity and the anatomical correlates of various neurological and neuropsychiatric disorders. In order to characterize the size and shape of the CC, many investigators have devised geometric measures thought to be indicative of important individual and group differences. The size and shape of the posterior portions of the CC, for example, have been reported to be sexually dimorphic and to relate to cerebral dominance for speech and handedness [de Lacoste‐Utamsing and Holloway, 1982; Witelson, 1985, 1989; O'Kusky et al., 1988; Allen et al., 1991]. In general, the results of imaging‐based studies of the CC have been remarkably inconsistent, which may be due in part to the tremendous variability in the size and shape of the human CC and to the variability in the methods used to create and measure CC subdivisions. The CC, moreover, is a structure without internal landmarks that would permit subdivision according to the projection topographies of its constituent axons.
We propose an alternative to these conventional geometric measures of the CC. By employing a principal components analysis of the CC contour, we allow the natural individual variability of the contour of the CC to determine the features that are measured. Principle components in fact can be regarded as representing underlying, latent functions—or intrinsic morphological features—of the points that comprise the CC contour [Kleinbaum et al., 1988; Hair et al., 1992]. The components should characterize basic features of CC size and shape without recourse to the construction of arbitrary landmarks for CC subdivision. A factor‐based approach has been applied previously to the analysis of CC widths to help with CC subdivision along the centerline axis [Denenberg et al., 1991], but it has not been applied to an analysis of the CC contour itself. We have found a subset of 8 components that together account for more than 90% of the variance of CC shape in 325 subjects across the life span. The factors are highly reproducible and are readily interpretable geometrically. Their validity is supported by their correlations with conventional measures of CC shape and with subject characteristics such as age, sex, socioeconomic status, handedness, and IQ. The factors in fact exhibit associations with subject characteristics that complement and may to some extent supplant those of the corresponding conventional measures.
METHODS
Subjects
We recruited 138 normal controls from community households randomly selected from a telemarketing database [Peterson et al., 2000]. We recruited another 187 subjects with chronic tic disorder (CTD), obsessive‐compulsive disorder (OCD), or attention‐deficit/hyperactivity disorder (ADHD) from the outpatient clinics of the Yale Child Study Center. Subjects were 6 to 88 years old (mean 25.5 ± 22.2), with 195 (133 boys, 62 girls) below and 130 (70 men, 60 women) above the age of 18. The age distributions of the normal and patient populations were similar. Eighty‐six percent were consistently right‐handed according to a standardized assessment [Oldfield, 1971]. Exclusionary criteria included a history of concussion, substance abuse, or seizure disorder. Neuropsychiatric diagnoses were established through clinical evaluation and administration of the child and adult versions of the Schedule for Affective Disorders and Schizophrenia Epidemiologic Version [Ambrosini et al., 1989]. In 80 of the adult subjects, IQ was estimated by prorating two performance (block design and object assembly) and 3 verbal (information, digit span, and vocabulary) subscales of the Revised Wechsler Adult Intelligence Scale (WAIS‐R) [Wechsler, 1981]. Written informed consent was obtained for all participants.
Image acquisition
High‐resolution T1‐weighted magnetic resonance images were acquired and processed to provide corpus callosum contours as well as isolated cerebrums and ventricular subdivisions for all subjects. Head positioning was standardized using cantho‐meatal landmarks. Brain images were acquired using a sagittal 3D volume spoiled gradient echo (SPGR) sequence with TR = 24 msec, TE = 5 msec, 45° flip, 256 × 192 matrix, FOV = 30 cm, 2 excitations, slice thickness = 1.2 mm, 124 contiguous slices.
Image analysis
Image analyses were performed on Sun Ultra 1 workstations using ANALYZE 7.5 software (Rochester, MN) while blind to subject characteristics. The 3D MR images were resliced obliquely to the midline slice based on visualization of midline landmarks that included the callosal sulcus, the cerebral aqueduct, the pineal stalk, the peaked roof of the 4th ventricle, and minimal cortical gray matter within the interhemispheric fissure. This slice was magnified 8‐fold in each in‐plane dimension and filtered using anisotropic diffusion (kappa = 10, iterations = 15). It was then thresholded using an isointensity contour function. The contour was edited manually to isolate the CC cross section, which was converted into a binary image and a trace of the CC outline.
CC endpoints were defined at the end of the splenium and at the tip of the rostrum using local curvature maxima. We first calculated Fourier decompositions of the periodic coordinate functions and truncated them to K = 16 terms [Staib and Duncan, 1992]:
 |
This method of curve smoothing eliminates the problem of curve shrinkage that can be caused by direct filtering methods. Second derivatives of the contour were calculated and used to compute curvature magnitudes:
Local curvature maxima of the CC were then selected. Because the curves had already been smoothed to remove noise in the contour, these local maxima typically defined the callosum endpoints uniquely, although they could be manually overridden if necessary. The original CC contour was smoothed and divided into two segments based on these endpoints, and both were evenly sampled to 100 points.
The cerebrum was defined with an isointensity contour function that thresholded cortical gray matter from overlying cerebrospinal fluid. Connecting dura and fat were removed manually. The brainstem was transected at the pontomedullary junction. The cerebral ventricles were also defined using an isointensity contour function and then subdivided into the 3rd, 4th, and lateral ventricles. The lateral ventricles were further subdivided into frontal, midbody, occipital, and temporal regions using three transecting planes—one coronal plane through the anterior commissure, another coronal plane through the posterior commissure, and an axial plane passing through both the anterior and posterior commissures (Fig. 1). Interrater intraclass correlation coefficients (ICC's) for these measures were >0.98.
Figure 1.
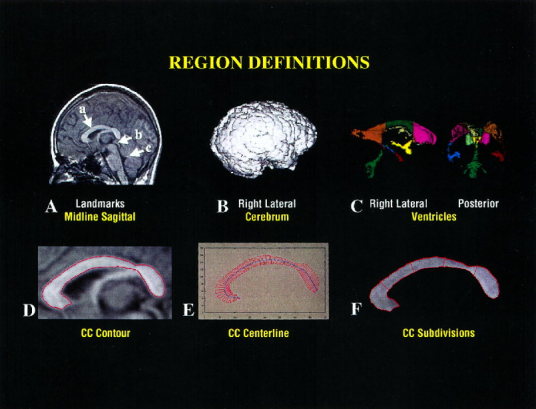
A. 3D volume images are first resliced to true midline. Among the midline landmarks are a) a well‐defined callosal sulcus, b) the cerebral aqueduct, and c) a peaked 4th ventricle. B. The cerebrum is isolated to provide a covariate for linear regression analyses. C. The cerebral ventricles are parcellated into the frontal, mid, and occipital portions of the bodies of the lateral ventricles, the temporal horns, and the 3rd and 4th ventricles. The right lateral and posterior volume rendered images are displayed. D–F. CC definition involves image filtering to remove high‐frequency irregularities in the CC contour and then contour definition using an isointensity contour function. The centerline and perpendicular chords are constructed, and from these the five CC subdivisions are constructed.
The conventional measures of CC size and shape included total cross‐sectional area, average and local widths, curvilinear (centerline) length, bending angle, bending energy, and splenial bulbosity. In 20 scans measured blindly twice, the ICC's for all conventional measures were >0.85. A centerline was constructed from the upper and lower segments of the curve by first connecting each pair of points on the two segments (sampled at each percentile along each curve) and taking the midpoint [Sheehan et al., 1986]. These midpoints defined the centerline curve. The length and the bending angle of the centerline were then calculated. The bending angle was defined as the angle from midpoint to the endpoints of the centerline and measured how flat or arched was the overall shape of the CC. The total bending energy of the centerline was calculated as the integral along the curve of the squared curvature magnitude:
 |
The average bending energy equals the total bending energy divided by the length of the centerline:
 |
Bending energy measures the degree of curvature of the centerline. The centerline was divided into fifths, and then four perpendicular chords were constructed as a measure of regional width (Fig.1). Bulbosity was calculated as the ratio of the cross‐sectional areas of the splenium and isthmus (i.e., the two most caudal of the five subregions).
Factor analyses
The CC contours of the normal controls were coregistered and rescaled using the generalized Procrustes algorithm [Gower, 1975]. Procrustes rescaling allows an analysis of CC shape without the possible confounding effect of overall CC size. The method determines for each subject's contour the transformation parameters that will minimize the total residual squared distance between each contour data point and the corresponding centroids in the subject population. For 2D data, these transformations include two translation parameters (x and y), one rotation parameter, and one scaling factor. This registration process transforms the data points representing each contour into a coordinate system that is common to all data sets in the analysis, enabling comparison of the locations of corresponding points.
We resampled the rescaled contours by a factor of 4, reducing the number of (x, y) contour points from 200 to 50 to ensure that the correlation matrix of the point coordinates would be full rank while still adequately representing the contour shape. The point coordinates were individually normalized by subtracting the centroid of each point set computed across subjects and then dividing by the standard deviation of each variable [Horst, 1965].
We then entered into a principal components analysis the correlation matrix of the normalized coordinates of each contour point, following the approach for the Point Distribution Models of Cootes [Cootes et al., 1992]. The correlation matrix of the normalized variables was first computed. The eigenvectors and eigenvalues for the correlation matrix were then calculated using a standard eigenanalysis routine [Matlab]. The number of factors retained was determined based on the size of the eigenvalues, the differences in size of successive eigenvalues and the percentage of the total variance explained by the retained factors. Using these criteria, we extracted eight factors from each CC contour data set. Subsequent factors would each have accounted for <2% of the total variance. Once this selection of factors was made, the initial (unrotated) factor loading matrix (F) was computed from the eigenvector matrix (V), and the diagonal matrix of eigenvalues (L) according to F = V(L0.5).
The factor loadings were then rotated using a varimax method. We considered the use of either the successive factors or the simultaneous factors varimax algorithms to rotate the factor loadings [Horst, 1965]. We selected the latter because it produced a better approximation of the desired simple structure. After rotating the factor loadings, factor score coefficients were computed from the data correlation matrix (R) and the rotated factor loadings according to B = (R‐1)F. The factor scores (S) were computed from the normalized data (Z) and the factor score coefficients using S = ZB [Tabachnik and Fidell, 1989]. The software to perform these calculations was written in Matlab (version 5.1, Natick, MA).
Alternatively, factor scores can be computed using a least squares estimation procedure, S = ZF(F′F)‐1 [Cliff, 1987; Johnson and Wichern, 1988]. Additionally, the eigenanalysis of the data correlation matrix can be replaced by a singular value decomposition of the data matrix [Basilevsky, 1994]. We found the computation of factor scores and loadings using the methods described above to be adequate for the data from our pool of 325 subjects. We confirmed the results by replicating the factor analysis using the commercial statistical software package, SPSS version 9.0 (SPSS Inc, Chicago, IL).
The initial eight factors underwent a varimax rotation with the goal of achieving a simple structure [Horst, 1965]. The effects of each factor on CC morphology were assessed by plotting the CC contour as a multiple of an individual eigenvector‐eigenvalue product (Fig. 2). A given contour was represented in terms of the mean contour and the eigenvectors of the correlation matrix: X = Xav + Pb, where Xav was the mean contour, P was the eigenvector matrix, and b was a set of weighting coefficients for a particular contour. Because the eigenvectors were determined from a correlation matrix of deviations from the mean, we added to Xav some multiple of the desired eigenvector to depict the effect of a given mode. Here we let the multiplier range between ‐3 and +3 × the square root of the respective eigenvalue to portray the reasonable range of values that a given bi was likely to take.
Figure 2.
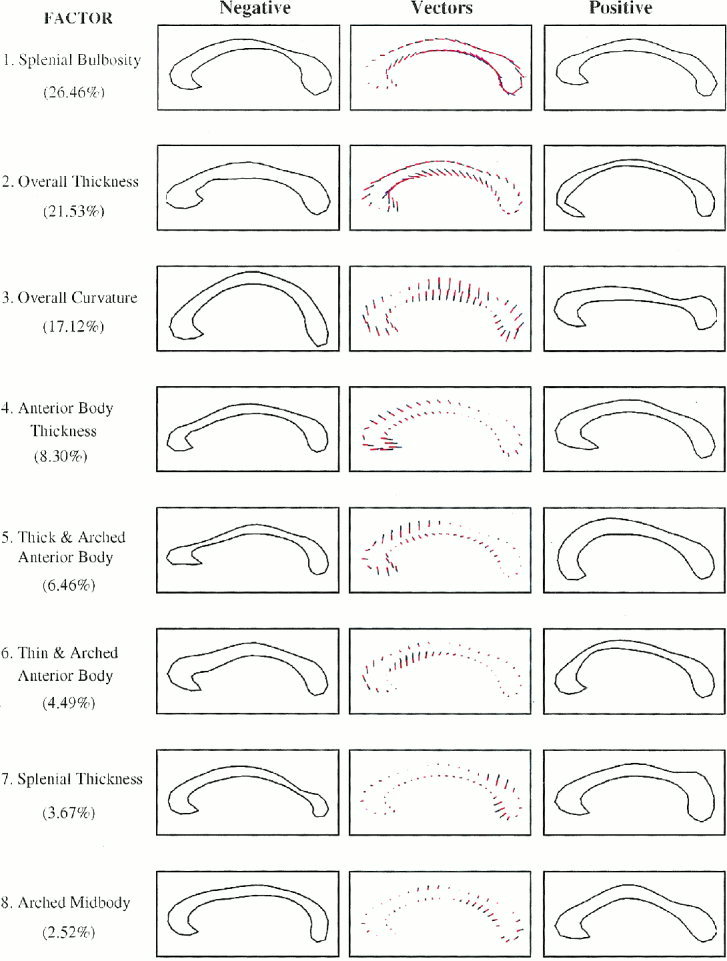
Normal subject factor structure. From top to bottom are the eight factors presented in order of percentage variance explained. The assignments of shape characteristics to each of the factors are noted to the left of the respective contour. In parentheses are numbers indicating the percent variance of CC shape that is explained by each factor. References to the factors in the text denote the ordered rank of the factors. In the middle column of figures are the mean CC contours and the vector plots that represent the effects of systematic changes in factor loadings as small colored lines extending from the mean contour. The blue portions of the lines represent additions and the red portions represent subtractions from the mean contour. The left and right columns then depict the effects of those vector additions to the mean contour. We simply add to the mean CC contour multiples of the desired eigenvector to depict the effect of a given mode in the normal subjects. Here we let the multiplier range between ‐3 and +3 × the square root of the respective eigenvalue to portray the reasonable range of values that an individual contour is likely to take. These plots indicate the directionality of effects in correlation analyses, in that more positive factor scores will produce effects on the CC contour that are like those in the right‐hand column, and more negative scores will approximate effects represented in the left‐hand column.
Replication
The factor structure was independently replicated in the patient sample (Fig. 3). The reliability of the factor structure was quantified by multiplying the factor coefficients for the normal controls by the normalized point coordinates of the patients to provide an additional set of factor scores for the patient group. These factor scores were then correlated with the factor scores originally calculated for the patient group. An analogous assessment of reliability was performed using the factor coefficients derived from the patient group, which were multiplied by the normalized point coordinates of the normal control contours. The correlations of these factor scores with the scores originally calculated for the normal controls were then computed.
Figure 3.
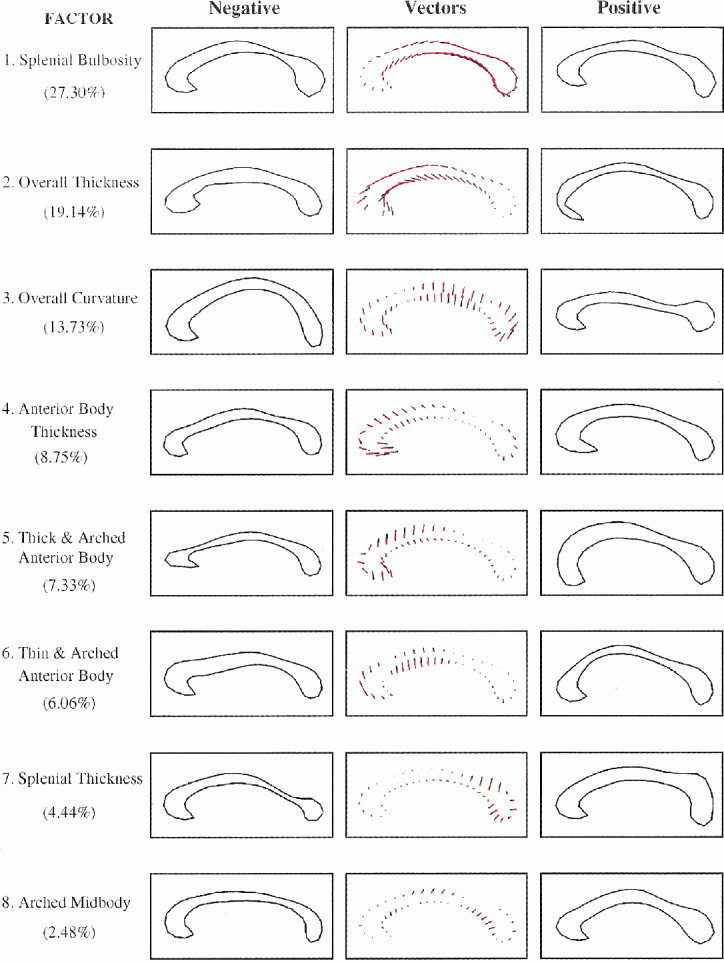
Patient factor structure. The contours and numbers are as described for Figure 2, though pertaining to the factor analysis of the patient data set.
Validation
Having demonstrated the reliability of the measures, we calculated the factor structure for the entire sample of 325 subjects. The corresponding factor scores were then used in correlation analyses for validation studies. We elected to include all normal subjects and patients when calculating the factor structure and scores for these validation studies, for several reasons. First, the morphological features captured by each of the factors were clearly the same in the normal and patient groups (Figs. 2 and 3), demonstrating the face validity of the measures. Second, the high reliability of the factor scores across the normal and patient groups (see above) suggested that the two groups could be combined without altering the factor scores. Third, combining the two groups doubled the ratio of number of subjects to the number of data points in the CC contour, thereby substantially enhancing the statistical stability of the resulting factor structure. Finally, including the CC contours of patients and normal controls increased the generalizability of the final factor structure to both normal and patient populations.
We assessed the construct validity of our factor assignments by correlating the factor scores derived from the 325 subjects with more conventional measures of CC size and shape. The strengths of these associations were calculated using a Pearson Product Moment correlation coefficient.
We also assessed the predictive validity of the factor assignments by correlating our factor scores with subject age, sex, socioeconomic status, handedness, and IQ. The magnitudes of these correlation coefficients were compared with the magnitudes of the corresponding coefficients calculated in analyses that correlated conventional CC measures with subject characteristics.
Analyses of predictive validity were conducted using multiple linear regression. In regression models that predicted factor scores in normal subjects only, age, sex, handedness, socioeconomic status, and cerebral volume were entered as independent variables. Using similar modeling techniques, we correlated the Procrustes scaling factor with cerebral volume, hypothesizing that general scaling effects within the cerebrum would produce significant correlations between these measures. In regression equations that predicted IQ as the dependent variable in the 80 normal and patient subjects for whom IQ data were available, age, sex, handedness, socioeconomic status, diagnosis (TS, OCD, ADHD, or normal control coded with three dummy variables), cerebral volume, and factor scores were entered as independent variables. In all regression equations, first and second order interactions were assessed; if not statistically significant, the interactions were not included in the final models.
We also wanted to assess the associations of CC factor scores with the volume of ventricular subdivisions, hypothesizing that the cerebral ventricles adjacent to the CC would likely correlate strongly with measures of CC shape. Because ventricular subregions were highly intercorrelated (r's >0.80), however, they would have destabilized the regression equations if more than one were entered into the equations simultaneously. When predicting individual factor scores, we therefore forced into the equations age, sex, handedness, socioeconomic status, and cerebral volume before ventricular subregions were allowed to compete for entry in a forward stepwise variable selection procedure.
RESULTS
Together, eight factors accounted for 91% of the total variance in CC shape. The morphological features captured by the factor structure seemed to include, in order of variance explained, factors representing 1) bulbosity of the splenium, 2) generalized thickness, 3) overall curvature, 4) thickness of the anterior body, 5) thickness and upward arching of the anterior body, 6) thinness and upward arching of the anterior body, 7) thickness of the splenium, and 8) curvature of the midbody of the CC (Fig. 2).
Face validity and reproducibility
Graphical representation demonstrated that the initial factor structure was clearly replicated in the independent patient sample (Fig. 3). The order of factor extraction based on percent variance explained was identical to the order of extraction in the normal control group. The correlations between pairs of factors obtained from the normal and patient groups ranged from 0.85 to 0.99 for the eight factors, with a mean of .94 ± .05, confirming the reproducibility of the factor structure (Fig. 4). A final analysis was then performed to calculate the factor structure and factor scores in the entire sample of 325 subjects. The factor structure was the same as the structure calculated independently using the normal control and patient groups. It accounted for 89.5% of the variance in CC shape.
Figure 4.
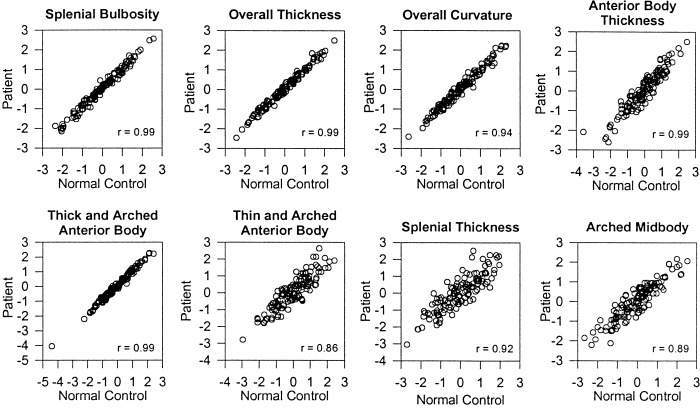
Reliability of the factor structures. The scatterplots represent the relationship between 1) the factor scores calculated from the normal subject data (x axis) and 2) the factor scores calculated by multiplying the factor coefficients derived from the patient data with the normalized point coordinates of the normal subject data (y axis). The Pearson correlation coefficients are provided in the lower right corner of each plot. The corresponding plots for the factor scores calculated from the patient data are not presented because they are similar to these plots.
Construct validity
As predicted, the Procrustes scaling factor correlated significantly with measures of CC size, including centerline length (r = 0.54, P < 0. 0001), average CC thickness (0.29, P < 0. 0001), and cerebral volume (r = 0.27, P < 0. 0001). Bending angle correlated with the factor representing overall curvature (factor 3, r = 0.63, P < 0. 0001), and the conventional measure of bulbosity predicted the corresponding measure derived from our factor analyses (factor 1, 0.58, P < 0. 0001). The width of the CC averaged over the four measured chord lengths correlated significantly with the overall CC thickness factor (factor 2, r = 0.35, P < 0. 0001). The factor representing the thickness of the anterior body of the CC (factor 4) predicted the width of the CC in that region (r = 0.67, P < 0. 0001), the factor representing splenium thickness (factor 7) correlated strongly with thickness of the CC at that point (r = 0.71, P < 0. 0001), and the factor representing a thick and arched anterior body (positive scores on factor 5) correlated with CC thickness in that region (r = 0.25, P < 0. 0001).
Predictive validity
The intent of these analyses was in general to validate the factor‐based measures against conventional measures, not to test a priori hypotheses about their associations with subject demographics. Therefore, P values were not corrected for multiple comparisons. Nevertheless, P values < 0.001 would have survived strict Bonferroni correction and can be considered statistically significant findings in their own right.
Developmental correlates
Factor scores representing overall CC curvature indicated the presence of a complex developmental trajectory in which the CC first progressively flattens in childhood (factor 3, β = 0.32, t = 2.43, P < 0.02) and then increasingly bends in adulthood, although the individual variability in curvature at any age is considerable (Fig. 5). Conventional measures of CC curvature, in contrast, did not correlate significantly with age in any developmental epoch.
Figure 5.
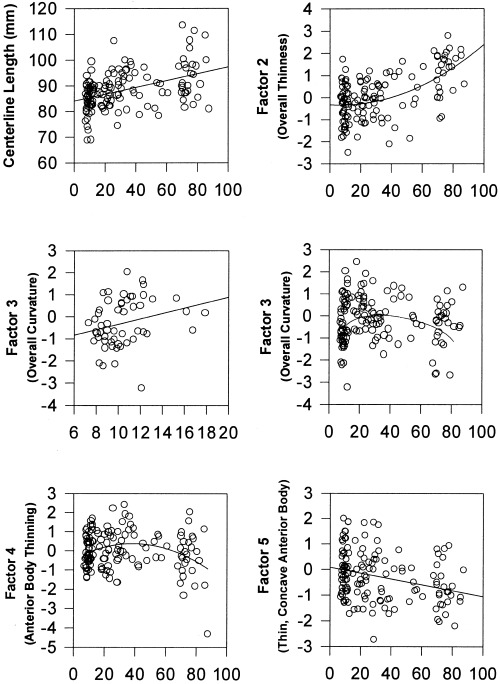
Age‐related changes in CC measures. The plots represent correlations of factor scores with age in only the normal subjects of the sample (N = 138). The factor numbers on the y axis correspond with the factor numbers in Figure 2. Upper left: the length of the centerline increases progressively with age. Changes are evident by early adulthood. Upper right: overall thinness of the CC (factor 2) increases with age2. Middle left: the CC progressively flattens with age during childhood and adolescence (the positive correlation with factor 3 reflects decreasing curvature). The scatterplot is presented only through late adolescence so that the association with age in this period of development can be more readily appreciated than it can, for instance, in the scatterplot for all subjects (middle right). Middle right: although the CC flattens in the first and second decades of life (factor 3, middle left figure), curvature then progressively increases with age in adulthood. Lower left: the anterior body of the CC increases in thickness and arches (factor 4) during childhood before thinning and becoming more concave in adulthood. Lower right: the anterior body becomes progressively thinner and more concave with age (factor 5).
In linear regressions for the normal subjects only, age2 correlated with the factor representing overall CC thinness (factor 2, β = 0.57, t = 6.93, P < 0. 0001), indicating that the corpus thins throughout its length progressively faster after the age of 40 (Fig. 5). The association of age or age2 with the conventional measure of CC width was not nearly as robust (age2 β = ‐0.22, t = ‐2.38, P < 0.02). Correlations of age with factor‐based measures of local CC width indicated additional thinning of anterior CC segments with age. Factor scores representing anterior body thickness increased through childhood and then decreased in adulthood (factor 4 correlation with age2: β = ‐0.24, t = ‐2.65, P < 0.02). A progressively thinner and more concave anterior body was also associated with increasing age (correlation of factor 5 with age: β = ‐0.26, t = ‐2.68, P = 0.008) (Fig. 5). Because these factor‐based measures are by definition mutually orthogonal, the significant correlations with age suggest that one biological process is responsible for global thinning of the corpus, while two largely independent processes are responsible for local thinning in the anterior body.
Conventional measures of the cross‐sectional area of CC subdivisions represent the combined regional effects of both length and width. Cross‐sectional area of the two most anterior and the one posterior‐most CC subdivisions increased until mid‐adulthood and thereafter progressively decreased with age (correlation with age2: β's = ‐0.19 to ‐0.24, Ps < 0.02). Area measurements of the CC midbody did not correlate with age in any developmental epoch. These correlations of conventional measures with age support the factor‐based findings, although the factor‐based measures were more straightforward to interpret than the conventional measures because factors 4 and 5 clearly represented anterior thinning and, unlike conventional area measurements, their effects were not confounded by CC length.
Factor‐based measures therefore detected the same developmental correlates of CC morphology that conventional measures did, and they did so more robustly. The one conventional measure that correlated with age and that seemed not to have a factor‐based counterpart was centerline length, which indicated that the CC progressively lengthens with age begin‐ ning in early adulthood (centerline length β = 0.58, t = 6.81, P < 0. 0001) (Fig. 5).
Demographic correlates
Cerebral volume was associated positively with Procrustes scaling (β = 0.21, t = 2.02, P < 0.05), a thicker anterior body (factor 4, β = 0.28, t = 2.61, P < 0.01), and a thicker and concave anterior body (factor 6, β = ‐0.25, t = ‐2.31, P = 0.02). Males had significantly thinner and more arched anterior bodies (factor 6, β = 0.29, t = 3.03, P < 0.003). Left‐handedness was associated with less bulbosity (factor 1, β = 0.13, t = 2.26, P = 0.02) and greater splenium thickness (factor 7, β = 0.13, t = 2.30, P = 0.02). Higher socioeconomic status was associated with smaller Procrustes scaling (β = ‐0.28, t = ‐3.44, P < 0.001) and less overall CC curvature (factor 3, β = 0.17, t = 1.97, P < 0.05). These demographic variables did not correlate significantly with conventional measures of CC size and shape, except that the size of the splenium was significantly larger in males (β = 0.25, t = 2.65, P < 0.01).
IQ correlates
Additional regression analyses demonstrated that the factor representing a thinner and more concave anterior body of the CC (negative scores on factor 5) predicted higher performance IQ (β = ‐0.28, t = ‐2.50, P < 0.01), verbal IQ (β = ‐0.26, t = ‐2.27, P < 0.03), and full‐scale IQ scores (β = ‐0.31, t = ‐2.81, P < 0.007) (Fig. 6) that were independent of the associations of factor 5 with age. The magnitudes of these correlations were similar to those for socioeconomic status and cerebral volume, which were the only other variables that independently correlated consistently with IQ measures. In contrast, none of the conventional measures correlated significantly with IQ.
Figure 6.
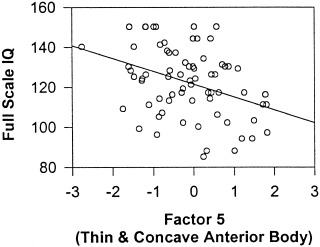
IQ correlations. Higher full‐scale IQ scores are associated with more negative scores for factor 5 (β = ‐0.31, P < 0.007), which represents a thinner and more concave anterior body of the CC.
Correlations with adjacent ventricular volumes
Finally, regression analyses demonstrated that the volume of ventricular subdivisions correlated significantly with factor analytic measures of CC shape. The combined volumes of the lateral ventricles correlated significantly with the overall thinness of the CC (factor 2, β = 0.60, t = 6.02, P < 0. 0001) (Fig. 7). Larger midbodies of the lateral ventricles were associated with greater overall CC curvature (factor 3, β = ‐0.61, t = ‐5.17, P < 0. 0001) (Fig. 7). Larger occipital horns of the ventricles correlated with a flatter, less arched midbody and greater arching of the posterior body of the CC (factor 8, β = ‐0.52, t = ‐4.34, P < 0. 0001). Larger ventricular subregions correlated significantly with all factors that represented an upward arching of the anterior body (factor 4 and the occipital horns: β = ‐0.34, t = ‐2.87, P < 0.005; factor 5 and the midbody of the ventricles: β = 0.27, t = 2.21, P < 0.02; factor 6 and the frontal horns: β = 0.24, t = 2.05, P < 0.04). These correlations suggest that individual variations in CC size and shape were determined in part by individual variability in the volume of the adjacent ventricular subdivisions.
Figure 7.
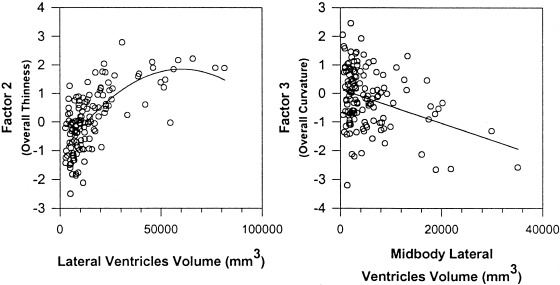
Correlations of ventricular volumes and CC factors. Larger bodies of the lateral ventricles correlated significantly with the factor‐based measure of overall thinness of the CC (factor 2), and the volume of the midbody of the lateral ventricles correlated with the factor representing overall CC curvature (factor 3).
DISCUSSION
These findings indicate that the human CC has latent morphological features that can be accurately characterized and quantified. This conclusion is supported by the high degree of reproducibility of the factor structure in independent samples, the face validity of the assignments of shape characteristics to each of the factors, the validation of the factor assignments using conventional measures of callosum shape, and the predictive validity of the factor scores in correlating with important subject characteristics such as age, sex, handedness, and IQ.
A considerable advantage of this factor‐based approach to the analysis of callosum morphology is that it obviates the need for placement of subdivision landmarks, which are defined arbitrarily and with poor reproducibility. Another related potential advantage of this approach is that it captures morphological features intrinsic to the CC that are not captured by more conventional measures of CC size and shape. By defining the latent morphological features of the CC, these measures may thereby relate more closely to underlying structural determinants and functional correlates, such as CC fiber composition, myelination, aging, and cerebral lateralization.
Possible structural determinants
Correlation analyses demonstrate that the CC thins with age, both globally and more locally within the rostrum, anterior body, and splenium of the CC. The structure also lengthens with age (Fig. 5), which probably accounts for the concurrent increase in Procrustes scaling. These changes are progressive, and they are seen in healthy subjects who have no neuropsychiatric diagnoses. Regressive changes are apparent even in early adulthood and so are unlikely to be caused solely by the previously documented decreases in water content of the brain that accompany aging [Chang et al., 1996]. The changes could, however, be due to alterations in neuronal myelination or glial cell number, or to age‐related pruning of transcallosal axons. The thinning and lengthening could also be due to age‐related changes in surrounding white matter, gray matter, or cerebrospinal fluid. Ventricular enlargement, for instance, accompanies normal aging and could induce, by simple mechanical force, the stretching, thinning, and anterior arching of the CC. The correlations of ventricular size with the thinning and curvature of the CC supports this possibility. Of course, these are findings of association and do not prove that increasing ventricular size causes the thinning and bowing of the CC as individuals age.
Functional correlates
The functional consequences of individual variability in CC morphology are still unknown. The number of small diameter fibers, the most abundant in the CC, are believed to account for most of the variance in CC shape [Aboitiz et al., 1992a]. Their density is greatest in the genu, the anterior body, and the anterior and midportions of the splenium—the CC areas where age‐related changes in size and shape are most prominent. The small diameter fibers are hypothesized to transmit a tonic (as opposed to phasic) influence from one hemisphere to the other [Lamantia and Rakic, 1990]. The neurotransmitters of most transcallosal axons are excitatory, although whether the behavioral effects of CC axons are excitatory or inhibitory (via the action of inhibitory interneurons) is still controversial. Greater regional asymmetries in some brain structures may be associated with fewer transcallosal axons in specific CC subregions [Aboitiz et al., 1992b], and similar reciprocal associations have been reported between CC size and behavioral measures of lateralization [O'Kusky, et al., 1988; Hines et al., 1992; Yazgan et al., 1995]. The greater structural and functional lateralization associated with reduced CC size may therefore suggest that the small diameter fibers are in large part excitatory in their behavioral effects.
Sex differences
Sex differences in callosal morphology included thinner and more arched anterior bodies of the CC in males. Transcallosal axons of the prefrontal, premotor, and anterior cingulate cortices traverse the anterior body of the CC [Pandya and Seltzer, 1986]. If the small‐diameter transcallosal axons really are excitatory in function, then the regionally thinner CC's would indicate that lateralization of the prefrontal cortex is likely to be greater in males than in females. This is consistent with previous neuropsychological and neuroimaging studies that have reported greater lateralization of structure and function in the frontal cortices of men [Cowell et al., 1994; Goldberg et al., 1994; Shaywitz et al., 1995; Murphy et al., 1996].
Handedness
Similar reasoning applies to interpreting the greater splenium thickness and reduced bulbosity associated with left‐handedness. Larger posterior segments of the CC, including the isthmus and splenium, have been reported previously for left‐handed subjects, and left‐handers are thought to have greater bihemispheric representation of function than right‐handed subjects [Witelson, 1989; Witelson and Goldsmith, 1991]. Therefore, the thicker splenium and relatively thicker isthmus that probably produced the smaller bulbosity in left‐handers in this study is consistent with the hypothesis that a larger callosum mediates the transfer of relatively greater interhemispheric excitation.
IQ
Higher verbal, performance, and full‐scale IQ measures in adults were associated with a reduced thickness of the anterior portion of the CC, which carries transcallosal axons from prefrontal, premotor, and anterior cingulate cortices. This association was seen only in the absence of upward arching in the anterior body; our correlations of ventricular size with CC curvature (including curvature of the anterior body) would in turn indicate that thinning of the anterior body is associated positively with IQ when the adjacent ventricles are relatively small. Because ventricular size probably reflects the integrity of surrounding cerebral tissue, the association of IQ with thinness and concavity of the anterior CC body may also suggest that localized CC thinning is associated with higher IQ scores only in the absence of localized tissue abnormalities in the frontal cortex.
The inverse correlations of IQ subscales with thickness of the anterior body of the CC would then imply that, in the absence of frontal abnormalities, higher IQ is associated with an increase in hemispheric specialization of the frontal cortex. Although these findings are preliminary and require replication, their implications for our understanding of prefrontal organization are consistent with the phylogenetic expansion and specialization of the frontal cortices. The findings are also consistent with the hypothesized role of these cortical regions in mediating, among other things, the cross‐temporal contingencies that are components of the working memory, language, and attentional demands of intelligence tests [Fuster, 1997; Peterson et al., 1999].
CONCLUSIONS
Automated factor‐based measures of CC morphology are highly reliable, and they have considerable face, construct, and predictive validity. Their usefulness in discriminating groups of patients from one another and from normal controls (their discriminant validity) will be assessed in future studies. Their correlations with subject variables were in general more robust and more readily interpretable than were those for conventional measures, and they more often correlated with subject characteristics than did conventional measures. Because the factors by definition represent intrinsic underlying (latent) features of CC size and shape, they also should capture individual variability in morphology that is determined by discrete biological causes. The correlations of factor‐based measures with subject characteristics reported here are preliminary and require replication in view of the multiple statistical comparisons performed. Those correlations, however, were calculated primarily for the purpose of comparison with conventional measures, rather than as tests of a priori hypotheses. The comparisons suggested that factor scores are more sensitive indices of biologically based variability than are conventional measures of CC morphology and that automated factor‐based measures offer promise for advancing future neurobiological investigations of the human corpus callosum. To aid in those investigations, the software programs to calculate CC factor scores based on the factor loadings derived here will be made available upon request.
Acknowledgements
ANALYZE Software was developed by the Biomedical Imaging Resource, Mayo Foundation (Rochester, MN), Richard A. Robb, Ph.D., Director. We thank Chris Van Dyck for graciously providing a subset of the normal elderly scans; James Duncan and Joel Klein for their assistance with developing the morphometric procedures; James Leckman and Lawrence Scahill for their help with subject recruitment and characterization; and Mireille Donkervoot for the IQ testing.
REFERENCES
- Aboitiz F, Scheibel AB, Fisher RS, Zaidel E (1992a): Fiber composition of the human corpus callosum. Brain Res 598: 143–153. [DOI] [PubMed] [Google Scholar]
- Aboitiz F, Scheibel AB, Fisher RS, Zaidel E (1992b): Individual differences in brain asymmetries and fiber composition in the human corpus callosum. Brain Res 598: 154–161. [DOI] [PubMed] [Google Scholar]
- Allen LS, Richey MF, Chai YM, Gorski RA (1991): Sex differences in the corpus callosum of the living human being. J Neurosci 11: 933–942. [DOI] [PMC free article] [PubMed] [Google Scholar]
- Ambrosini P, Metch C, Prabucki K (1989): Videotape reliability of the third revised edition of the K‐SADS. J Am Acad Child Adolesc Psychiatry 28: 723. [DOI] [PubMed] [Google Scholar]
- Basilevsky A (1994): Statistical factor analysis and related methods: theory and applications. New York: John Wiley & Sons. [Google Scholar]
- Chang L, Ernst T, Poland RE, Jenden DJ (1996): In vivo proton magnetic resonance spectroscopy of the normal aging human brain. Life Sci 58: 2049–2056. [DOI] [PubMed] [Google Scholar]
- Cliff N (1987): Analyzing multivariate data. San Diego, CA: Harcourt Brace Jovanovich. [Google Scholar]
- Cootes TF, Taylor CJ, Cooper DH, Graham J (1992): Training models of shape from sets of examples. Proceedings of British Machine Vision Conference. Springer‐Verlag: Berlin: p 9–18. [Google Scholar]
- Cowell PE, Turetsky BI, Gur RC, Grossman RI, Shtasel DL, Gur RE (1994): Sex differences in aging of the human frontal and temporal lobes. J Neurosci 14: 4748–4755. [DOI] [PMC free article] [PubMed] [Google Scholar]
- de Lacoste‐Utamsing C, Holloway RL (1982): Sexual dimorphism in the human corpus callosum. Science 216: 1431–1432. [DOI] [PubMed] [Google Scholar]
- de Lacoste‐Utamsing MC, Kirkpatrick JB, Ross ED (1985): Topography of the human corpus callosum. J Neurophysiol Exp Neurol 44: 578–591. [DOI] [PubMed] [Google Scholar]
- Denenberg VH, Kertesz A, Cowell PE (1991): A factor analysis of the human's corpus callosum. Brain Res 548: 126–132. [DOI] [PubMed] [Google Scholar]
- Engel AK, König P, Kreiter AK, Singer W (1991): Interhemispheric synchronization of oscillatory neuronal responses in cat visual cortex. Science 252: 1177–1179. [DOI] [PubMed] [Google Scholar]
- Fuster JM (1997): The prefrontal cortex: anatomy, physiology, and neuropsychology of the frontal lobe, 3rd ed Philadelphia: Lippincott‐Raven. [Google Scholar]
- Goldberg E, Podell K, Harner R, Lovell M, Riggioi S (1994): Cognitive bias, functional cortical geometry, and the frontal lobes: laterality, sex, and handedness. J Cogn Neurosci 6: 274–294. [DOI] [PubMed] [Google Scholar]
- Gower JC (1975): Generalized procrustes analysis. Psychometrika 40: 33–51. [Google Scholar]
- Hair JFJ, Anderson RE, Tatham RL, Black WC (1992): Factor analysis In: Easter F, editor. Multivariate data analysis. New York: Macmillan; p 223–264. [Google Scholar]
- Hines M, Chiu L, McAdams L, Bentler PM, Lipcamon J (1992): Cognition and the corpus callosum: verbal fluency, visuospatial ability, and language lateralization related to the midsagittal surface areas of callosal subregions. Behav Neurosci 106: 3–14. [DOI] [PubMed] [Google Scholar]
- Horst P (1965): Factor analysis of data matrices. New York: Holt, Rinehart, & Winston, Inc. [Google Scholar]
- Johnson RA, Wichern DW (1988): Applied multivariate statistical analysis. Englewood Cliffs, NJ: Prentice Hall. [Google Scholar]
- Kleinbaum DG, Kupper LL, Muller KE (1988): Variable reduction and factor analysis, 2nd ed In: Payne M, editor. Applied regression analysis and other multivariable methods. Belmont, CA: Duxbury Press; p 595–641. [Google Scholar]
- Lamantia A‐S, Rakic P (1990): Cytological and quantitative characteristics of four cerebral commissures in the rhesus monkey. J Comp Neurol 291: 520–537. [DOI] [PubMed] [Google Scholar]
- Matlab. Version 5.1 for Unix Systems. Natick, MA.
- Murphy DGM, DeCarli C, McIntosh AR, Daly E, Mentis MJ, Pietrini P, Szczepanik J, Schapiro MB, Grady CL, Horwitz B, Rapoport SI (1996): Sex differences in human brain morphometry and metabolism: an in vivo quantitative magnetic resonance imaging and positron emission tomography study on the effect of aging. Arch Gen Psychiatry 53: 585–594. [DOI] [PubMed] [Google Scholar]
- O'Kusky J, Strauss E, Kosaka B, Wada J, Li D, Druhan M, Petrie J (1988): The corpus callosum is larger with right‐hemisphere cerebral speech dominance. Ann Neurol 24: 379–383. [DOI] [PubMed] [Google Scholar]
- Oldfield RC (1971): The assessment and analysis of handedness: The Edinburgh Inventory. Neuropsychologia 9: 97–113. [DOI] [PubMed] [Google Scholar]
- Pandya D, Seltzer B (1986): The topography of commissural fibers In: Lepore F, Petito M, Jasper H, editors. Two hemispheres—one brain: functions of the corpus callosum. New York: Alan R. Liss, Inc; p 47–73. [Google Scholar]
- Peterson BS, Leckman JF, Tucker D, Scahill L, Staib L, Zhang H, King R, Cohen DJ, Gore JC, Lombroso P (2000): Preliminary findings of antistreptococcal antibody titers and basal ganglia volumes in chronic tic, obsessive‐compulsive, and attention deficit‐hyperactivity disorder. Arch Gen Psychiatry 57: 364–372. [DOI] [PubMed] [Google Scholar]
- Peterson BS, Skudlarski P, Zhang H, Gatenby JC, Anderson AW, Gore JC (1999): An fMRI study of Stroop word‐color interference: evidence for cingulate subregions subserving multiple distributed attentional systems. Biol Psychiatry 45: 1237–1258. [DOI] [PubMed] [Google Scholar]
- Shaywitz BA, Shaywitz SE, Pugh KR, Constable RT, Skudlarski P, Fulbright RK, Bronen RA, Fletcher JM, Shankweiler DP, Katz L, Gore JC (1995): Sex differences in the functional organization of the brain for language. Nature 373: 607–609. [DOI] [PubMed] [Google Scholar]
- Sheehan FH, Bolson EL, Dodge HT, Mathey DG, Schofer J, Woo HW (1986): Advantages and applications of the centerline method for characterizing regional ventricular function. Circulation 74: 293–305. [DOI] [PubMed] [Google Scholar]
- Staib LH, Duncan JS (1992): Boundary finding with parametrically deformable models. IEEE Trans Pattern Anal Machine Intell 14: 1061–1075. [Google Scholar]
- Tabachnik BG, Fidell LS (1989): Multivariate statistics New York: Harper Collins. [Google Scholar]
- Wechsler D (1981): WAIS‐R Manual. Wechsler Adult Intelligence Scale‐revised. San Antonio, TX: Psychological Corporation, Harcourt Brace Jovanovich. [Google Scholar]
- Witelson SF (1985): The brain connection: the corpus callosum is larger in left‐handers. Science 229: 665–668. [DOI] [PubMed] [Google Scholar]
- Witelson SF (1989): Hand and sex differences in the isthmus and genu of the human corpus callosum. Brain 112: 799–835. [DOI] [PubMed] [Google Scholar]
- Witelson SF, Goldsmith CH (1991): The relationship of hand preference to anatomy of the corpus callosum in men. Brain Res 545: 175–182. [DOI] [PubMed] [Google Scholar]
- Yazgan MY, Wexler BE, Kinsbourne M, Peterson B, Leckman JF (1995): Functional significance of individual variations in callosal area. Neuropsychologia 33: 769–779. [DOI] [PubMed] [Google Scholar]


