

Abstract
We evaluated left and right motor cortex involvement during verbal and non‐verbal lip and tongue movements in seven healthy subjects using whole‐head magnetoencephalography. The movements were paced by tone pips. The non‐verbal tasks included a kissing movement and touching the teeth with the tongue. The verbal tasks comprised silent articulation of the Finnish vowel /o/, which requires mouth movement similar to that in the kissing task, pronouncing the same self‐selected word repeatedly, and producing a new word for every tone pip. Motor cortex involvement was quantified by task‐related suppression and subsequent rebound of the 20‐Hz activity. The modulation concentrated to two sites along the central sulcus, identified as the motor face and hand representations. The 20‐Hz suppression in the face area was relatively similar during all tasks. The post‐movement rebound, however, was significantly left‐lateralized during word production. In the non‐verbal tasks, hand areas showed pronounced suppression of 20‐Hz activity that was significantly diminished for the verbal tasks. The latencies of the 20‐Hz suppression in the left and right face representations were correlated across subjects during verbal mouth movements. Increasing linguistic content of lip and tongue movements was thus manifested in spatially more focal motor cortex involvement, left‐hemisphere lateralization of face area activation, and correlated timing across hemispheres. Hum. Brain Mapping 16:81–91, 2002. © 2002 Wiley‐Liss, Inc.
Keywords: human, magnetoencephalography, language, speech production, mouth movement, 20‐Hz rhythm
INTRODUCTION
Left‐hemisphere dominance for language in most right‐handed individuals has been unequivocally demonstrated by lesion data and the invasive Wada test [Penfield and Roberts, 1959; Rasmussen and Milner, 1977]. More recently, specific language paradigms have shown hemispheric lateralization non‐invasively, using positron emission tomography (PET) [Hunter et al., 1999], functional magnetic resonance imaging (fMRI) [Binder et al., 1996; Desmond et al., 1995], and magnetoencephalography (MEG) [Breier et al., 1999; Gootjes et al., 1999]. These paradigms have addressed receptive language.
Lateralization in language production is less obvious. Cortical control of facial muscles is strongly bilateral, unlike that of, e.g., hand and foot muscles [Kuypers, 1958]. After damage to the face motor cortex in one hemisphere, articulatory movements can evidently be controlled by the motor area of the other hemisphere [Penfield and Roberts, 1959]. Bilateral activation of the sensorimotor cortices during language production has been reported in functional imaging studies of reading words aloud [Fiez and Petersen, 1998; Price, 1998; Salmelin et al., 2000], naming pictures [Martin et al., 1996; Murtha et al., 1999; Salmelin et al., 1994], and generating words to a cue [Herholz et al., 1996; Müller et al., 1997; Petersen et al., 1989]. Systematic lateralization was found only in the left inferior frontal cortex that comprises the classical Broca area and is generally assumed to orchestrate the articulation.
The motor/premotor cortex, however, may play a role in articulatory planning complementary to or even surpassing that of Broca area. In PET studies focusing on cerebral areas associated with motor control of self‐initiated speech, activation was found in the lateral sensorimotor cortex in both hemispheres, but not in the classical Broca area [Larsen et al., 1978; Murphy et al., 1997]. In these studies, the linguistic component of the task was minimized by making the subjects perform ‘automatic’ language production, like repeating a meaningless sentence [Murphy et al., 1997] or reciting the days of the week [Larsen et al., 1978]. In a PET investigation of listening to and repeating heard nouns, it was concluded that the articulatory plan was formulated in the left lateral premotor cortex and left anterior insula, not in Broca area [Wise et al., 1999].
Lateralization at the level of the primary motor cortex was reported in an fMRI study, where left‐hemisphere dominance was found for continuous silent recitation of the names of the months and right‐hemisphere dominance for singing silently [Wildgruber et al., 1996]. In a recent study using transcranial magnetic stimulation (TMS), overt production of propositional speech was interrupted when TMS was applied to the face area of the left motor cortex, but not when it was applied to Broca area or the face motor cortex in the right hemisphere [Epstein et al., 1999].
Task‐related modulation of electromagnetic cortical oscillations in the 20‐Hz range provides a convenient tool for assessing motor cortex involvement. The human sensorimotor cortex displays oscillatory activity known as mu rhythm, which is composed of activity in the 10‐Hz and 20‐Hz ranges [Chatrian et al., 1959; Gastaut, 1952]. Recent MEG and EEG studies have demonstrated that the 10‐Hz rhythm is generated largely in the postcentral primary somatosensory cortex, in and around the hand area [Pfurtscheller et al., 1997; Salmelin and Hari, 1994b; Salmelin et al., 1995; Tiihonen et al., 1989]. The 20‐Hz activity, on the other hand, appears to originate predominantly in the precentral primary motor cortex and its modulation with body movements shows somatotopic organization [Hari and Salmelin, 1997; Neuper and Pfurtscheller, 1996; Pfurtscheller and Lopes da Silva, 1999; Pfurtscheller et al., 1997; Salenius et al., 1997; Salmelin et al., 1994, 1995]. The suppression associated with movements is generally taken to indicate that the sensorimotor cortex is involved in task performance, and the possible rebound above base level may reflect immobilization or deactivation when returning to rest [Pfurtscheller, 1992; Pfurtscheller and Lopes da Silva, 1999; Salmelin and Hari, 1994b; Salmelin et al., 1995]. Studies using transcranial magnetic stimulation (TMS) support the view that the 20‐Hz rebound is associated with reduced motor cortex excitability [Chen et al., 1998, 1999]. Simple finger and toe movements are followed by a transient increase of 20‐Hz activity around the cortical representations of finger and toe, respectively, particularly over the hemisphere contralateral to the moving body part, whereas mouth movement is associated with bilateral 20‐Hz modulation around the face representation [Salmelin et al., 1995].
In the present MEG study, we utilized the task‐related modulation of the 20‐Hz activity to evaluate the involvement of the primary motor cortex in production of verbal vs. non‐verbal mouth movements, ranging from kissing and tongue movements to overt word production.
MATERIALS AND METHODS
Subjects and tasks
Seven healthy right‐handed, Finnish‐speaking subjects (six men, 22–38 years, and one woman, 26 years) gave their informed consent to participate in this study.
Paced by short tone pips (1 kHz, 50 msec, with 15‐msec rise and decay times), delivered at 3–5 sec intervals to the right ear, the subjects: 1) touched the upper teeth with the tip of the tongue, with lips closed (henceforth TONGUE, six subjects); 2) protruded the lips, as if preparing to kiss someone (KISS); 3) articulated silently the Finnish vowel /o/ (OOO), with a similar movement as in KISS; 4) pronounced the same self‐selected noun repeatedly (ONEWORD); and 5) pronounced a new noun at each tone pip (WORDS). The subjects were asked to respond as soon as possible. The order of the tasks was randomized across subjects. Responses to tones presented alone (TONE, six subjects) were recorded in the beginning and at the end of the experiment. In this control task, the subjects were asked to listen to the tones attentively, as if they might need to respond to them. The measurement time was kept reasonable by including only a limited selection of tasks. OOO was performed silently to facilitate direct comparison with KISS (no sound). Overt speech production was assessed in the directly comparable tasks ONEWORD and WORDS.
The correct type of lip movement for KISS (‘imagine a nice person in front of you whom you kiss on the cheek’) and OOO were practiced before the experiment. For the ONEWORD condition, the subjects were allowed to select any bisyllabic word. In the WORDS condition, an efficient strategy was to suggest an environment for the subject (e.g. a forest) where s/he could imagine walking and describing the view, in response to the tones.
The tasks were performed one at a time. Before each recording, the subject was instructed which task he/she should perform in response to the tone pips. To keep the subjects alert and active, we limited the number of trials to 40–50, which is adequate for evaluating the modulation of 20‐Hz activity. This way, each task lasted for 3–4 min, and the entire experiment for 30–45 min, including the 2–3 min rest periods between tasks.
Data acquisition
Cortical electromagnetic activity was recorded with a Neuromag‐122™ whole‐head MEG system (Neuromag Ltd., Helsinki, Finland), which is composed of 122 sensors arranged in a helmet‐shaped array. At each location, there are two orthogonally oriented planar gradiometers. This device records maximum signal directly above the active cortical area.
The subject was seated on a chair, with his/her head resting against the measurement helmet. Mouth movement onset was detected by recording electromyogram (EMG) from electrodes placed in the upper left and lower right corners of the mouth (orbicularis oris muscle), and speech onset with a microphone. Vertical electro‐oculogram (EOG) was employed for detecting epochs contaminated by excessive eye or eyelid movements.
MEG signals were low‐pass filtered at 90 Hz and digitized at 0.3 kHz. The signals were averaged on‐line at −100…+1,000 msec with respect to tone onset for immediate evaluation of the quality of the data. The continuous MEG, EMG, EOG, and microphone signals were stored on magneto‐optical disk for off‐line analysis.
Data analysis
Reaction times
Mouth movement and speech reaction times were determined from the burst onsets in the lip EMG and microphone records. Even for the tongue movements, where no active mouth movement was made, it was possible to record an identifiable burst in lip EMG at least in 70% of the trials. Estimates for the EMG peak latency and offset latency (duration) were obtained from the mean shape of the EMG burst calculated by averaging the rectified EMG signal with respect to EMG onset. As the exact endpoint of the slowly waning EMG signal is difficult to identify, the offset latency was defined as the point on the descending slope where the magnitude was 50% of the maximum.
Modulation of 20‐Hz activity
First, amplitude spectra were calculated for each subject in all tasks, by advancing a 3.4‐sec window in 1.7‐sec steps through the entire non‐averaged data set and averaging the resulting spectra. In all subjects, it was possible to identify four distinct spectral ranges across all cortical regions, approximately 8–11 Hz (low 10 Hz), 11–15 Hz (high 10 Hz), 15–21 Hz (low 20 Hz), and 21–28 Hz (high 20 Hz), with the borders varying by 1–3 Hz across individuals. The mean amplitude of rhythmic activity as a function of time was evaluated with the Temporal Spectral Evolution (TSE) approach: The MEG signals were filtered through the four individually determined passbands listed above, rectified (absolute value), and averaged with respect to stimulus onset [Salmelin and Hari, 1994b]. For quantification of the 20‐Hz modulation, the TSEs were calculated in the fixed passband of 16–28 Hz for all subjects. At these high frequencies, mouth movement artefacts are negligible.
Cortical sources of 20‐Hz activity
In the 20‐Hz range, the modulation concentrated over the central sulcus. The spatial distribution of both the spectra and the TSE curves spoke for more than one source area for rhythmic activity in both hemispheres (Fig. 1). Based on the TSE curves, we selected in each subject two tasks that showed the strongest overall levels of rhythmic activity or the strongest post‐movement bursts of activity, for identifying sources of the oscillatory signals. The tasks used for localization varied across subjects. The sources were searched every 10 msec from 30‐sec intervals selected from the continuous MEG data sets, using a subset of 22 sensors over the left rolandic area and a corresponding subset of 22 sensors over the right rolandic area [Salmelin et al., 1995, 2000]. The source areas were modelled as equivalent current dipoles [Hämäläinen et al., 1993]. The parameters of each ECD represent the center of the active cortical patch, and the direction and mean strength of current flow therein. The ECDs formed two distinguishable clusters in the sensorimotor cortex of each hemisphere (Fig. 2). The more lateral cluster was best identified from 20‐Hz oscillations, whereas ECDs in the medial cluster were often better determined from signals filtered through the high 10‐Hz range.
Figure 1.
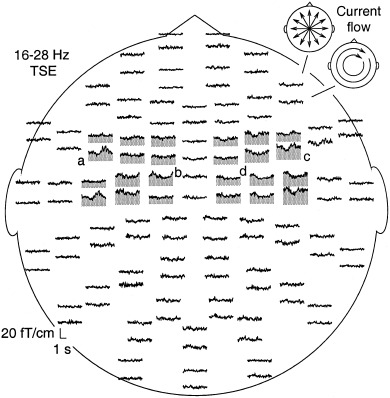
Whole‐head view of the mean amplitude of 16–28 Hz activity (Temporal Spectral Evolution, TSE) in one subject during the kissing task (KISS) over a 4‐sec interval, including a 1‐sec prestimulus baseline. The measurement helmet is viewed from above, and flattened to the plane, with the nose pointing upwards. Time flows along the horizontal axis and the magnetic field changes along the vertical axis. Neuromag‐122™ records maximum signal directly above an active cortical area. The 122 sensors are arranged in 61 locations. In each location, there are two sensors that are most sensitive to orthogonally oriented currents (see schematic views in the upper right corner). The TSE level in the sensors showing clear task‐related modulation of 20‐Hz activity is high‐lighted by grey shading. The letters a–d indicate groups of sensors displaying distinct time behaviors.
Figure 2.
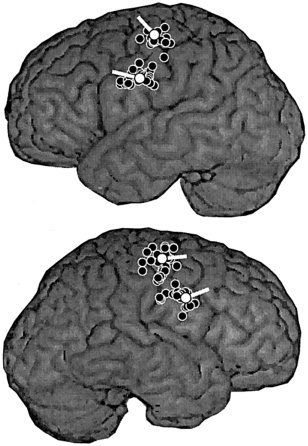
Clusters of sources of rhythmic activity along the left and right central sulcus (black circles), and the representative source location and orientation of current flow for each cluster (white circles and tails) in one subject (task ONEWORD), presented on the surface rendition of his MRI. The dipolar sources included in this image had a goodness‐of‐fit exceeding 85% and their 95% confidence volume was less than 125 mm3, corresponding to a cube with a side length of 5 mm.
A single ECD from each cluster, with parameters best matching the mean location and orientation of current flow of all ECDs forming the cluster, was selected to represent the active region. A 4‐dipole model was then formed from these selected ECDs and applied to the continuous MEG data, filtered at 16–28 Hz. The obtained continuous source waveforms were then rectified and averaged with respect to tone onset (i.e., task onset) and EMG onset (i.e., onset of motor performance), resulting in TSE curves of 20‐Hz activity in the lateral and medial sensorimotor cortices [Salmelin et al., 1995, 2000]. Source waveforms were not averaged with respect to the microphone signal (speech sound) onset. A forward calculation was performed to predict the whole‐head sensor TSE curves resulting from this 4‐dipole model. Visual comparison of the predicted sensor TSE curves with TSE curves of the measured MEG signals showed that the medial and lateral sources accounted well for the measured modulation of 20‐Hz rhythm along the central sulcus in all subjects and in all conditions. A goodness‐of‐fit value g for the TSE model was further estimated as g = 1 − Σ (p i − m i)2/Σm i 2, where m i is the measured and p i the predicted signal at sensor i, and Σ represents a summation across sensors extending from the left to the right rolandic area over the vertex (52 sensors). The g‐value typically varied from 70–85%.
The source TSE amplitudes were normalized with respect to the individual base levels of rhythmic activity (−1,000 to −500 msec before tone onset, and −1,500 to −1,000 msec before EMG onset) in the lateral and medial source areas. The suppression and rebound onset and peak latencies and peak amplitudes were determined. If the amplitude did not exceed twice the standard deviation of the baseline (SD) at any time point, the peak amplitudes were set to 0 and no latency estimates were obtained. When the amplitude exceeded 2 SD for less than 100 msec, the peak amplitude was set to 2 SD, with no latency estimates. Statistical tests were performed using ANOVA (task × hemisphere × lateral/medial area).
Presenting MEG data on MRI
Anatomical magnetic resonance images (MRIs) were available for all subjects. For presenting the functional MEG results on the MRIs, the two coordinate systems were aligned with the help of three small coils placed on the subject's head before the measurement. Using a 3D digitizer (Isotrak 3S1002, Polhemus Navigation Sciences, Colchester, VT), the positions of these coils were determined with respect to three landmarks on the head, i.e., nasion and points just anterior to the ear canals, which are readily identified on the MRIs. The locations of the coils with respect to the MEG helmet were determined by briefly energizing the coils and calculating their locations from the magnetic field patterns.
RESULTS
Reaction times
Table I depicts the reaction times in the different tasks. Mouth movement started on average at 200 msec after the tone pip for KISS and OOO, at 230 msec for ONEWORD, and at 270 msec for WORDS. TONGUE movement onset, as recorded from the corners of the mouth, was delayed by about 50 msec with respect to KISS and OOO. The EMG signals reached the maximum within 20–180 msec, now earliest for TONGUE and latest for ONEWORD and WORDS. The EMG duration varied from 360 to 720 msec, shortest again for TONGUE and longest for ONEWORD and WORDS. For both vocalized tasks, ONEWORD and WORDS, microphone signals appeared about 250 msec after EMG onset.
Table I.
Mean ± SEM timing of the mouth EMG signal for the different tasks*
| Task | Onset latency (ms) | Peak latency (ms) | Duration (ms) |
|---|---|---|---|
| Tongue | 248 ± 27 | 19 ± 5 | 365 ± 67 |
| Kiss | 193 ± 15 | 124 ± 32 | 361 ± 40 |
| Ooo | 203 ± 18 | 76 ± 20 | 415 ± 55 |
| Oneword | 229 ± 32 | 183 ± 56 | 528 ± 92 |
| Words | 265 ± 18 | 166 ± 34 | 715 ± 100 |
Onset is measured from the tone prompt and peak latency and duration from the EMG onset.
The task effect in EMG onsets was statistically significant (F[4,20] = 5.5, P < 0.005, ANOVA). Paired t‐tests showed that reaction times were significantly shorter for KISS and OOO than for WORDS (P < 0.005) and shorter for KISS than TONGUE (P < 0.04).
The EMG onset latencies were correlated across subjects for KISS and OOO, OOO and ONEWORD, TONGUE and ONEWORD, and ONEWORD and WORDS (Pearson's r = 0.620–0.866, P < 0.05). Both the speed of tongue movements and the speed of mouth movements for producing /o/ were thus independently correlated with the speed for repeating a complete word, and reaction time for ONEWORD further covaried with the reaction time for WORDS. The reaction time of the non‐verbal kissing movement only correlated with that of the similar mouth movement for articulating /o/.
Modulation of 20‐Hz activity
Figure 1 illustrates the modulation of 20‐Hz activity in one subject in the KISS task, with respect to tone onset. As is usual for the cortical rhythmic activity, the suppression and the subsequent rebound occurred over a period of a few seconds. The modulation concentrated on the sensors covering the central sulcus, in both hemispheres. The most lateral sensors of the left hemisphere (marked with a) showed a clear suppression followed by a rebound above base level, whereas the more medial sensors (b) displayed a persistent suppression. In the right hemisphere, the lateral (c) and medial (d) sensors showed a similar dissociation into two distinct patterns of 20‐Hz modulation.
As illustrated in Figure 2 for one subject, localization of sources of rhythmic activity resulted in two clear clusters along the central sulcus, similarly in the left and right hemisphere. The source best corresponding to the mean location and orientation of current flow was selected from each cluster. Figure 3 shows the location and orientation of the medial sources in all individuals, on axial MRI slices that allow spatial comparison with the readily identifiable hand knob [Yousry et al., 1997]. The medial sources were located within 6 ± 2 mm of the centre of the hand knob, thus approximately in the sensorimotor representation of the hand and arm.
Figure 3.
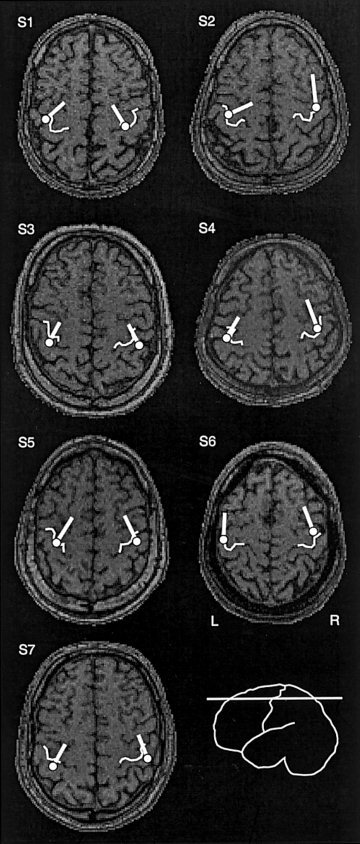
Axial MRI slices of all subjects (S1–S7) at the level of the hand area. The hand knobs are high‐lighted with white curves. The representative sources of the medial clusters and the orientations of current flow in each subject are indicated with white circles and tails. The medial clusters were typically localized in the TONGUE or ONEWORD conditions.
Figure 4 displays a sagittal view of the mean ± SEM locations of the medial and lateral sources with respect to the hand knob at the origin. The lateral sources were located in the central sulcus, 21 ± 3 mm inferior to the hand knob, in agreement with the known relative positions of hand and face representations along the central sulcus [Hari et al., 1993; Nakamura et al., 1998; Penfield and Rasmussen, 1957; Salmelin et al., 1995; Woolsey et al., 1979].
Figure 4.
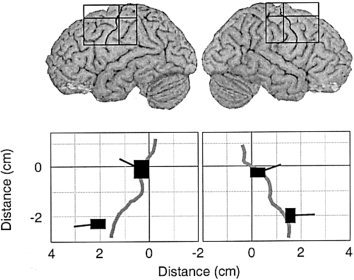
The mean ± SEM locations of the dipoles representing the two source clusters of 20‐Hz activity in each hemisphere, averaged across subjects. The tails represent the mean orientations of current flow (SEM = 6 deg). The origin of the rectangles was set at the hand knob in the left and right hemispheres, as indicated by the positioning of the rectangles on the MRI surface images. The medial cluster was best found in the TONGUE and ONEWORD conditions, and the lateral cluster in the WORDS and ONEWORD conditions.
Figure 5 illustrates the mean ± SEM modulation of 16–28 Hz activity, averaged with respect to tone onset (solid curves) and EMG onset (dashed curves) across all subjects, in the left and right face and hand motor cortices during the different tasks. The duration of the EMG signal is indicated by the rectangles. The TSE curves of the source waveforms are displayed as percent of base level. The base levels did not differ significantly between tasks, hemispheres, or cortical areas (6 × 2 × 2 ANOVA). As the reaction times are short (200–300 msec) compared to the time scale of the 20‐Hz modulation (1–2 sec), the TSE waveforms aligned with respect to tone onset and EMG onset were indistinguishable in all individuals.
Figure 5.
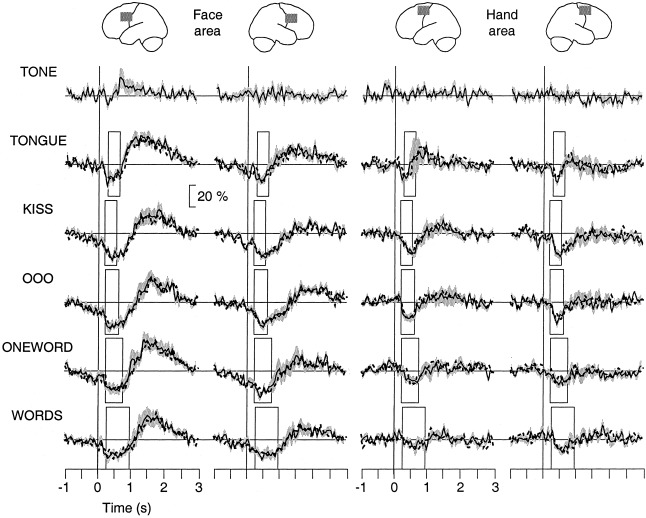
Task‐related modulation of 20‐Hz activity in the left and right face and hand areas (columns) as percent of local base level, averaged across subjects (SEM = grey shading). The different tasks are displayed as rows. The time window extends from 1 sec before tone prompt to 3 sec after it. The rectangles indicate the EMG durations in the different tasks. TSE waveforms averaged with respect to tone and EMG onset are plotted as solid and dashed curves, respectively, and overlaid.
The TSE waveforms in the face and hand areas showed a fundamentally different behavior. The 20‐Hz activity in the face areas was suppressed at tone onset. The maximum suppression occurred at 300–500 msec after tone onset, significantly after EMG onset in the verbal tasks (P < 0.03, paired t‐test). The suppression ended at 700–800 msec for tongue movements and at 1,000–1,400 msec in the other tasks, significantly after EMG offset in TONGUE, KISS, and OOO (P < 0.01, paired t‐test). In the word production tasks, the end of suppression coincided with the EMG offset. The subsequent rebound reached its maximum at 1,200–1,400 msec after tone onset for tongue movements and at 1,600–1,900 msec in the other tasks. In the hand areas, however, the onset of the 20‐Hz suppression coincided with the onset of the tongue and lip movement, as indicated by the timing of the EMG signal. Unlike in the face area, no prominent rebound was seen in the hand area. As expected, there was essentially no modulation during TONE, where no response was required.
Correlations between left‐ and right‐hemisphere face areas in timing of the 20‐Hz modulation emerged in the verbal tasks, for the latency of maximum suppression (OOO, r = 0.814, P < 0.05 and ONEWORD, r = 0.930, P < 0.03) and for the end of suppression (ONEWORD, r = 0.777, P < 0.04 and WORDS, r = 0.785, P < 0.04). No interhemispheric correlations were found for the non‐verbal tasks. The time behavior of the cortical 20‐Hz modulation did not show systematic correlations with the EMG measures.
The mean ± SEM maximum suppression and rebound amplitudes in the different areas and tasks are compiled in Figure 6. The suppression in the face areas remained essentially constant for all tasks, but the hand area suppression was diminished with increasing linguistic content of the mouth movements (Fig. 6a). This interpretation is supported by a 5 × 2 × 2 ANOVA (task × area × hemisphere) that showed both a significant task effect (F[4,20] = 5.6, P < 0.004) and task‐by‐area interaction (F[4,20] = 4.9, P < 0.007). All other movements except TONGUE included mouth movements. When TONGUE was excluded, the hand areas still showed a highly significant task effect (F[3,18] = 8.5, P < 0.001) whereas no task effect was detected in the face areas.
Figure 6.
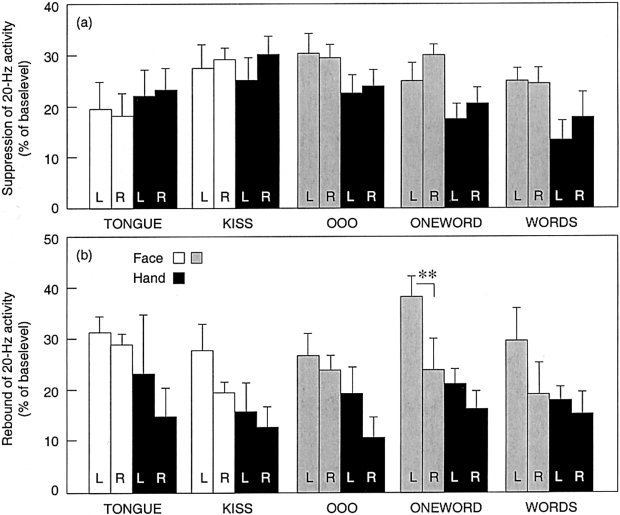
Mean ± SEM suppression (a) and rebound (b) of 20‐Hz activity as percent of base level in the left (L) and right (R) face and hand areas during the different tasks. The hand area modulation is plotted with black bars and face area modulation with white bars for the non‐verbal tasks and with grey bars for the verbal tasks (**P < 0.01).
The 20‐Hz rebound (Fig. 6b) was stronger in the face than hand areas (F[1,5] = 11.5, P < 0.02). Moreover, the rebound was stronger in the left than right face area but similar in the left and right hand areas (area‐by‐hemisphere interaction [F(1,5) = 8.4, P < 0.04). In planned comparisons, the difference between left vs. right face area rebounds reached significance only in the ONEWORD condition (P < 0.01), where six of seven subjects had stronger rebound in the left than right hemisphere and the remaining one subject equally strong rebounds.
DISCUSSION
Task‐related modulation of the motor cortical 20‐Hz rhythm in the face area demonstrated significant left‐hemisphere dominance in the ONEWORD condition. In the WORDS condition, the different word lengths may have resulted in more inter‐trial variability in the timing of suppression and rebound than the repeated production of a single word in ONEWORD, thus reducing the overall signal strength and masking potential lateralization. The timing of 20‐Hz suppression in the left and right face representations was correlated during word production. There were no significant correlations, however, between the timing of the EMG signal and cortical latencies. Interestingly, 20‐Hz activity was also strongly suppressed around the bilateral hand representations during non‐verbal mouth movements but significantly less in the verbal tasks. It should be noted that 20‐Hz activity, and its modulation, are only detected along the motor strip. Therefore, activity in other areas, e.g., classical language regions can not be assessed directly using this method.
Face area involvement in mouth movements
In all tasks, 20‐Hz activity in the face areas showed a clear suppression for about 1 sec and a subsequent rebound, which lasted for about 2 sec. The rebound was particularly pronounced in the left hemisphere. When only lip movement was required, during KISS and OOO, the suppression outlasted the peripheral muscle activity. When tongue movement was required, during TONGUE, ONEWORD, and WORDS, the suppression coincided with the duration of the muscle activity. For word production, however, the timing of the suppression may also have been determined by a similar mechanism as in KISS and OOO, rather than by the duration of the tongue movement only.
In the face area, post‐movement rebound may well serve as a better quantitative marker of (preceding) neuronal activation than the suppression. As discussed in the Introduction, during the resting state no rhythmic activity can normally be recorded from the face area but only from the more medial hand representation. In the present study, the transient mouth movements were followed by bursts of 20‐Hz activity in the face area. This small increase of rhythmic activity was readily suppressed during the mouth movements, so that the suppression in the face area probably approached the floor level in all tasks.
Modulation of 20‐Hz activity in the bilateral face areas has been reported during jaw movements [Salmelin et al., 1995] and while reading aloud single words [Salmelin et al., 2000]. In the latter study, suppression lasted for more than 2 sec and was followed by little or no rebound, similarly in both hemispheres. In the present study, however, there was a strong rebound that even showed significant lateralization in ONEWORD. The balance between the duration of the suppression and the amount of rebound may apparently vary with the linguistic or visuomotor demands of the task.
The left‐hemisphere lateralization of the 20‐Hz rebound after word production, and the emergence of correlated time behavior between the left and right face representations during verbal tasks suggest that, during speech production, the left face area may act as the primary control center for mouth movements while the right face area assumes a subordinate role.
Functional imaging studies of speech production usually demonstrate bilateral involvement of the face sensorimotor cortex, but left‐hemisphere dominance has not always been found or reported. In an MEG study of word production in Japanese subjects, sources were found in both left and right face areas but their activation strengths were not compared [Sasaki et al., 1995]. In a PET investigation of the cerebral control of speech and breathing, where the subjects produced ‘automatic’ speech with the language processing minimized, no motor cortical lateralization was reported [Murphy et al., 1997]. Reading words aloud [Fiez and Petersen, 1998; Price, 1998] or repeating heard words [Petersen et al., 1989; Price et al., 1996] is associated with bilateral activation of the face sensorimotor cortex, or of the left sensorimotor cortex unilaterally [Price et al., 1996]. fMRI findings have suggested left‐hemisphere dominance for self‐initiated silent speech production, as opposed to bilateral activation of the face motor cortex during non‐verbal tongue protrusions [Wildgruber et al., 1996].
Recent TMS results may account for some of the apparent variation in motor cortex lateralization during different speech tasks [Epstein et al., 1999]. Spontaneous speech and reading aloud were seriously disturbed by TMS applied to the left face area, whereas writing, comprehension, repetition, picture naming, oral praxis, or singing were not affected. Some level of lateralization would thus seem feasible in the present study where speech production was paced by a tone prompt that did not provide instructions about the linguistic content of the utterance.
Hand area involvement in mouth movements
In the non‐verbal tasks and during silent production of the phoneme /o/, where the movement was quite short‐lasting, also the hand sensorimotor areas were active, as measured by suppression of 20‐Hz activity. The suppression was significantly diminished for the verbal conditions. The tasks did not require actual or imagined hand movements, and hand EMG was not recorded in the present study. No overt movements were detected, nor did the subjects report an urge to move the hands. Therefore, we feel that although the hand area involvement may be a rather surprising finding it is potentially interesting and must be given some consideration. Further studies with EMG recordings from both the hands and the mouth will obviously be needed to clarify the possible role of hand areas in movements of the mouth or other body parts.
Hand areas show spontaneous 20‐Hz activity that can be recorded also when the subject is resting [Chatrian et al., 1959; Gastaut, 1952; Salmelin and Hari, 1994a; Tiihonen et al., 1989]. In contrast, 20‐Hz activity from the face or foot area can generally be detected only when the subject performs transient movements of these body parts [Salmelin et al., 1995]. This dissociation may be related to the exceptional importance of skillful hand movements in human behavior. The 20‐Hz suppression in the hand areas during mouth movements may thus reflect a minor epiphenomenal modulation of the ever‐present oscillatory activity.
It is also plausible that the hands are constantly ready to participate in any movement. Accordingly, hand areas could be active also during movements of other body parts unless this activity is specifically suppressed. At the premotor level, representations of hand and mouth are largely overlapping [for a review see Rizzolatti and Luppino, 2001]. The reduction of hand area involvement from non‐verbal to verbal tasks is almost counter‐intuitive, given the intimate connection between hand gestures and speech [Armstrong et al., 1995; Iverson and Goldin‐Meadow, 1998]. The complex interwoven motor and linguistic aspects of speech production may require that all irrelevant motor networks are inhibited. The lack of 20‐Hz modulation in the hand area during speech production may thus reflect restriction of hand movements that are independent of the linguistic mouth movements.
Suppression of 20‐Hz activity in the hand areas was also found when reading words aloud [Salmelin et al., 2000]. Both in that study and in the present data set, suppression of 20‐Hz activity was evident in the hand areas, but no prominent rebound. Hand movements are normally associated with strong post‐movement bursts of 20‐Hz activity [Pfurtscheller, 1992; Pfurtscheller and Lopes da Silva, 1999; Salmelin and Hari, 1994b; Salmelin et al., 1995]. Furthermore, while the suppression of 20‐Hz activity in the face areas preceded the EMG onset both in the present study and during word reading [Salmelin et al., 2000], no such preparatory activation was seen in the hand areas. These observations speak for rather unusual, possibly subliminal hand movements, or some process that only occurs at the cortical level.
The diminished involvement of the hand areas with increasing linguistic content of mouth movements is particularly interesting in light of recent findings in developmental stutterers. When reading words aloud, stutterers display equally strong suppression of 20‐Hz activity in the face and hand areas, as opposed to the clear face‐area dominance in fluent speakers [Salmelin et al., 2000]. Fluent speech may thus require clear segregation between the adjacent hand and face representations in the motor cortex. The results of the present study raise the possibility that stutterers rely more on non‐verbal motor control when producing speech than fluent speakers do. These questions remain to be answered by further studies.
Acknowledgements
We are grateful to R. Hari, P. Helenius, K. Kiviniemi, A. Tarkiainen, and M. Vihla for comments on the manuscript.
REFERENCES
- Armstrong DF, Stokoe WC, Wilcox SE (1995): Gesture and the nature of language. Cambridge: Cambridge University Press. [Google Scholar]
- Binder JR, Swanson SJ, Hammeke TA, Morris GL, Mueller WM, Fischer M, Benbadis S, Frost JA, Rao SM, Haughton VM (1996): Determination of language dominance using functional MRI: a comparison with the Wada test. Neurology 46: 978–984. [DOI] [PubMed] [Google Scholar]
- Breier JI, Simos PG, Zouridakis G, Wheless JW, Willmore LJ, Constantinou JEC, Maggio WW, Papanicolaou AC (1999): Language dominance determined by magnetic source imaging: a comparison with the Wada procedure. Neurology 53: 938–945. [DOI] [PubMed] [Google Scholar]
- Chatrian GE, Petersen MC, Lazarte JA (1959): The blocking of the rolandic wicket rhythm and some central changes related to movement. Electroenceph Clin Neurophysiol 11: 497–510. [DOI] [PubMed] [Google Scholar]
- Chen R, Corwell B, Hallett M (1999): Modulation of motor cortex excitability by median nerve and digit stimulation. Exp Brain Res 129: 77–86. [DOI] [PubMed] [Google Scholar]
- Chen R, Yaseen Z, Cohen LG, Hallett M (1998): Time course of corticospinal excitability in reaction time and self‐paced movements. Ann Neurol 44: 317–325. [DOI] [PubMed] [Google Scholar]
- Desmond J, Sum J, Wagner A, Demb J, Shear P, Glover G, Gabrieli J, Morrell M (1995): Functional MRI measurement of language lateralization in Wada‐tested patients. Brain 118: 1411–1419. [DOI] [PubMed] [Google Scholar]
- Epstein CM, Meador KJ, Loring DW, Wright RJ, Weissman JD, Sheppard S, Lah JJ, Puhalovich F, Gaitan L, Davey KR (1999): Localization and characterization of speech arrest during transcranial magnetic stimulation. Clin Neurophysiol 110: 1073–1079. [DOI] [PubMed] [Google Scholar]
- Fiez JA, Petersen SE (1998): Neuroimaging studies of word reading. Proc Natl Acad Sci USA 95: 914–921. [DOI] [PMC free article] [PubMed] [Google Scholar]
- Gastaut H (1952): Etude électrocorticographique de la réactivité des rythmes rolandiques. Rev Neurol (Paris) 87: 176–182. [PubMed] [Google Scholar]
- Gootjes L, Raij T, Salmelin R, Hari R (1999): Left‐hemisphere dominance for processing of vowels: a whole‐scalp neuromagnetic study. Neuroreport 10: 2987–2991. [DOI] [PubMed] [Google Scholar]
- Hämäläinen M, Hari R, Ilmoniemi RJ, Knuutila J, Lounasmaa OV (1993): Magnetoencephalography—theory, instrumentation, and applications to noninvasive studies of the working human brain. Rev Mod Phys 65: 413–497. [Google Scholar]
- Hari R, Karhu J, Hämäläinen M, Knuutila J, Salonen O, Sams M, Vilkman V (1993): Functional organization of the human first and second somatosensory cortices: a neuromagnetic study. Eur J Neurosci 5: 724–734. [DOI] [PubMed] [Google Scholar]
- Hari R, Salmelin R (1997): Human cortical oscillations: a neuromagnetic view through the skull. Trends Neurosci 20: 44–49. [DOI] [PubMed] [Google Scholar]
- Herholz K, Thiel A, Wienhard K, Pietrzyk U, von Stockhausen H‐M, Karbe H, Kessler J, Bruckbauer T, Halber M, Heiss W‐D (1996): Individual functional anatomy of verb generation. Neuroimage 3: 185–194. [DOI] [PubMed] [Google Scholar]
- Hunter KE, Blaxton TA, Bookheimer SY, Figlozzi C, Gaillard WD, Grandin C, Anyanwu A, Theodore WH (1999): O‐15 water positron emission tomography in language localization: a study comparing positron emission tomography visual and computerized region of interest analysis with the Wada Test. Ann Neurol 45: 662–665. [DOI] [PubMed] [Google Scholar]
- Iverson JM, Goldin‐Meadow S (1998): Why people gesture when they speak. Nature 396: 228. [DOI] [PubMed] [Google Scholar]
- Kuypers H (1958): Corticobulbar connexions to the pons and lower brain stem in man. Brain 81: 364–388. [DOI] [PubMed] [Google Scholar]
- Larsen B, Skinhøj E, Lassen NA (1978): Variations in regional cortical blood flow in the right and left hemispheres during automatic speech. Brain 101: 193–209. [DOI] [PubMed] [Google Scholar]
- Martin A, Wiggs CL, Ungerleider LG, Haxby JV (1996): Neural correlates of category‐specific knowledge. Nature 379: 649–652. [DOI] [PubMed] [Google Scholar]
- Müller RA, Rothermel RD, Behen ME, Muzik O, Mangner TJ, Chugani HT (1997): Receptive and expressive language activations for sentences: a PET study. Neuroreport 8: 3767–3770. [DOI] [PubMed] [Google Scholar]
- Murphy K, Corfield DR, Guz A, Fink GR, Wise RJS, Harrison J, Adams L (1997): Cerebral areas associated with motor control of speech in humans. J Appl Physiol 83: 1438–1447. [DOI] [PubMed] [Google Scholar]
- Murtha S, Chertkow H, Beauregard M, Evans A (1999): The neural substrate of picture naming. J Cognit Neurosci 11: 399–423. [DOI] [PubMed] [Google Scholar]
- Nakamura A, Yamada T, Goto A, Kato T, Ito K, Abe Y, Kachi T, Kakigi R (1998): Somatosensory homunculus as drawn by MEG. Neuroimage 7: 377–386. [DOI] [PubMed] [Google Scholar]
- Neuper C, Pfurtscheller G (1996): Post‐movement synchronization of beta rhythms in the EEG over cortical foot area in man. Neurosci Lett 216: 17–20. [DOI] [PubMed] [Google Scholar]
- Penfield W, Rasmussen T (1957): Cerebral cortex of man, 4th ed New York: Macmillan. [Google Scholar]
- Penfield W, Roberts L (1959): Speech and brain mechanisms. Princeton: Princeton University Press. [Google Scholar]
- Petersen SE, Fox PT, Posner MI, Mintun M, Raichle ME (1989): Positron emission tomographic studies of the processing of single words. J Cogn Neurosci 1: 153–170. [DOI] [PubMed] [Google Scholar]
- Pfurtscheller G (1992): Event‐related synchronization (ERS): an electrophysiological correlate of cortical areas at rest. Electroenceph Clin Neurophysiol 83: 62–69. [DOI] [PubMed] [Google Scholar]
- Pfurtscheller G, Lopes da Silva FH (1999): Event‐related EEG/MEG synchronization and desynchronization: basic principles. Clin Neurophysiol 110: 1842–1857. [DOI] [PubMed] [Google Scholar]
- Pfurtscheller G, Neuper C, Andrew C, Edlinger G (1997): Foot and hand area mu rhythms. Int J Psychophysiol 26: 121–135. [DOI] [PubMed] [Google Scholar]
- Price CJ (1998): The functional anatomy of word comprehension and production. Trends Cogn Sci 2: 281–287. [DOI] [PubMed] [Google Scholar]
- Price CJ, Wise RJS, Warburton EA, Moore CJ, Howard D, Patterson K, Frackowiak RSJ, Friston KJ (1996): Hearing and saying—the functional neuro‐anatomy of auditory word processing. Brain 119: 919–931. [DOI] [PubMed] [Google Scholar]
- Rasmussen T, Milner B (1977): The role of early left brain injury in determining lateralization of cerebral speech functions. Ann NY Acad Sci 299: 355–369. [DOI] [PubMed] [Google Scholar]
- Rizzolatti G, Luppino G (2001): The cortical motor system. Neuron 31: 889–901. [DOI] [PubMed] [Google Scholar]
- Salenius S, Portin K, Kajola M, Salmelin R, Hari R (1997): Cortical control of human motoneuron firing during isometric contraction. J Neurophysiol 77: 3401–3405. [DOI] [PubMed] [Google Scholar]
- Salmelin R, Hämäläinen M, Kajola M, Hari R (1995): Functional segregation of movement‐related rhythmic activity in the human brain. Neuroimage 2: 237–243. [DOI] [PubMed] [Google Scholar]
- Salmelin R, Hari R (1994a): Characterization of spontaneous MEG rhythms in healthy adults. Electroenceph Clin Neurophysiol 91: 237–248. [DOI] [PubMed] [Google Scholar]
- Salmelin R, Hari R (1994b): Spatiotemporal characteristics of sensorimotor MEG rhythms related to thumb movement. Neuroscience 60: 537–550. [DOI] [PubMed] [Google Scholar]
- Salmelin R, Hari R, Lounasmaa O, Sams M (1994): Dynamics of brain activation during picture naming. Nature 368: 463–465. [DOI] [PubMed] [Google Scholar]
- Salmelin R, Schnitzler A, Schmitz F, Freund H‐J (2000): Single word reading in developmental stutterers and fluent speakers. Brain 123: 1184–1202. [DOI] [PubMed] [Google Scholar]
- Sasaki K, Kyuhou S, Nambu A, Matsuzaki R, Tsujimoto T, Gemba H (1995): Motor speech centres in the frontal cortex. Neurosci Res 22: 245–248. [DOI] [PubMed] [Google Scholar]
- Tiihonen J, Kajola M, Hari R (1989): Magnetic mu rhythm in man. Neuroscience 32: 793–800. [DOI] [PubMed] [Google Scholar]
- Wildgruber D, Ackermann H, Klose U, Kardatzki B, Grodd W (1996): Functional lateralization of speech production at primary motor cortex: a fMRI study. Neuroreport 7: 2791–2795. [DOI] [PubMed] [Google Scholar]
- Wise RJS, Greene J, Büchel C, Scott SK (1999): Brain regions involved in articulation. Lancet 353: 1057–1061. [DOI] [PubMed] [Google Scholar]
- Woolsey CN, Erickson TC, Gilson WE (1979): Localization in somatic sensory and motor areas of human cerebral cortex as determined by direct recording of evoked potentials and electrical stimulation. J Neurosurg 51: 476–506. [DOI] [PubMed] [Google Scholar]
- Yousry TA, Schmid UD, Alkadhi H, Schmidt D, Peraud A, Buettner A, Winkler P (1997): Localization of the motor hand area to a knob on the precentral gyrus. Brain 120: 141–157. [DOI] [PubMed] [Google Scholar]