

Abstract
No human fMRI studies have examined ketamine effects on the BOLD signal change associated with cognitive task performance. We wished to distinguish between effects on 1) cerebral blood flow, with resultant change in BOLD signal; and 2) cognition and neural mechanisms underlying BOLD signal change associated with task performance. Eight right‐handed men (mean age 28.75 years) received ketamine or saline i.v. in a randomized, double‐blind manner (bolus 0.23 mg/kg; 0.5 mg/kg over 45 min to a maximum 1 hr). Subjects viewed 10 alternating 30‐sec blocks of faces with neutral expressions and a fixation cross and discriminated gender of faces. Gradient echo echoplanar images were acquired on a GE Signa 1.5 T Neurovascular system. One hundred T2‐weighted images depicting BOLD contrast were acquired over 5 min (for each task) at each of 14 near‐axial noncontiguous 7‐mm thick planes. Ketamine significantly increased dissociative phenomena and negative symptoms, but did not affect performance of the gender discrimination task. Significant BOLD signal change was demonstrated predominantly in occipitotemporal cortex with both ketamine and placebo. Only two clusters in middle occipital gyrus (BA 18) and precentral gyrus (BA 4) showed significantly decreased BOLD signal change during ketamine compared to placebo. BOLD signal change was not significantly greater in any region during ketamine. Our findings demonstrate subtle rather than major differences between the effects of ketamine and placebo upon the BOLD signal change during perception of face–non face contrast. We suggest that they represent task‐dependent effects of the drug/placebo, rather than task‐independent effects of the drug per se, and indicate that the effects of ketamine on cerebral blood flow are predominantly focal and task‐dependent, rather than global and task‐independent. Hum. Brain Mapping 18:135–145, 2003. © 2002 Wiley‐Liss, Inc.
Keywords: psychopharmacology, NMDA receptors, neuroimaging, glutamate, cerebral circulation
INTRODUCTION
Image acquisition in functional magnetic resonance imaging (fMRI) employs the blood oxygen level dependent or BOLD effect, which is an indirect measure of cerebral blood flow (CBF). The success of this technique must depend on the BOLD signal being an accurate descriptor of underlying neuronal activity. Typically, fMRI time series are collected during the systematic variation of a stimulus or cognitive task. In this case, the BOLD signal change is assumed to reflect a change in neuronal activity as it is widely accepted that a close regional coupling exists between neuronal activity and CBF [Golanov et al., 1994; Golanov and Reis, 1996]. In an fMRI paradigm using a pharmacological probe, however, this assumption requires closer scrutiny. A distinction must be made between any effect of the drug upon blood flow per se and the BOLD signal change associated with cognitive state‐ and performance‐related changes produced by the drug.
So called 'vascular confounds' may alter the BOLD signal in at least three ways: 1) a drug may alter systemic blood pressure and cardiac output and thereby change CBF globally by altering the resting perfusion of the whole brain; 2) it may alter CBF locally in the brain by affecting vascular perfusion in particular areas; and 3) it may act on CBF locally by changing the vascular response to any performance‐related change in neuronal activity. Depending on the size of the confound, the BOLD signal change might become a poor indicator of neuronal activity during task performance.
We have a particular interest in potential vascular confounds in pharmacological fMRI because, as part of another study, we wished to administer the noncompetitive N‐methyl‐d‐aspartate (NMDA) antagonist, ketamine, to healthy volunteers. In subanesthetic doses, ketamine produces depersonalization; it also induces a schizophrenic‐like psychosis and has well‐described effects on cognition [Adler et al., 1998; Krystal et al., 1994; Malhotra et al., 1996]. Its behavioral effects remit soon after administration [Moretti et al., 1984; Pandit et al., 1980] and clinically it is very safe to use, producing little respiratory effect and transient cardiovascular effects.
The pressor effects of NMDA antagonists are likely to be due to centrally mediated increases in sympathetic nerve activity [Lewis et al., 1989]. Ketamine interferes with excitatory amino acid (EAA) neurotransmission by noncompetitively binding within the lumen of the NMDA receptor ion channel. Ketamine blocks NMDA receptors throughout the brain, although these receptors are most densely located in the cerebral and hippocampal cortices. NMDA receptors have not been identified on cerebral blood vessels [Beart et al., 1988] and NMDA does not appear to induce vasodilatation in isolated cerebral blood vessels in the rat [Faraci and Breese, 1993; Takayasu and Dacey, 1989]. Glutamate, via the NMDA receptor, is thought to be involved in the modulation of resting dilatory tone and to produce an enhancement of local blood flow after neuronal stimulation. This effect is probably dependent on neuronal discharge activity and the subsequent production of neuronal nitric oxide [Fergus and Lee, 1997]. Compared to a placebo infusion, therefore, an NMDA antagonist such as ketamine, might be expected to produce either no change or decreased regional blood flow and a relatively smaller change in the BOLD signal during performance of a given task.
Animal data that attempt to assess the effect of ketamine on global CBF are inconsistent. Ketamine has been reported to cause from a 50% decrease to an 80% increase in global CBF [Dawson et al., 1971; Fukuda et al., 1983; Kreuscher and Grote, 1967] or no effect [Schwedler et al., 1982]. In humans, studies of global changes in CBF with ketamine are also inconsistent: Hougaard et al. [1974] reported no effect on global CBF; Takeshita et al. [1972] reported an increase in CBF, whereas Herrschaft and Schmidt [1973] reported that ketamine decreased CBF. Takeshita suggested that the increases in global cerebral perfusion were in part secondary to hypercapnia in anesthetized patients, although some animal studies have reported increased CBF with ketamine in normocapnic preparations [Artru, 1990].
All the studies considered here have used ketamine in anesthetic doses, which are an order of magnitude higher than that used in this study and, therefore, comparison with effects of subanesthetic doses in awake human subjects is difficult. There is only one previous report of the cerebral blood flow effects of ketamine in human neuroimaging and none in healthy volunteers using fMRI. Lahti et al. [1995] assessed the impact of 0.1–3 mg/kg intravenous (i.v.) ketamine on regional cerebral blood flow in five patients with schizophrenia using PET and H2 15O. During the infusions subjects experienced a worsening of previous psychotic symptoms and ketamine was reported to induce areas of increased flow in the anterior cingulate cortex, which extended inferiorly on the medial wall of the prefrontal cortex. Areas of reduced blood flow were reported in the visual cortex (lingual and fusiform gyri) and the hippocampus.
Two other groups have examined ketamine effects on cerebral activation in healthy volunteers using FDG PET [Breier et al., 1997; Vollenweider et al., 1997a]. Vollenweider et al. [1997a] described effects of 1.2 mg/kg ketamine infusion in 10 healthy subjects during an uncontrolled 'resting state.' They found increases in metabolic activity in anterior cingulate, frontal cortex, and to a lesser extent in insula, parietal, temporal and occipitomedial cortex, but reported no decreases. These data are difficult to interpret, given the lack of control for 'mental activity.' Breier et al. [1997] administered 0.12 mg/kg ketamine as a bolus followed by an infusion of 0.65 mg/kg for 1 hr to 17 healthy volunteers. They asked subjects to perform an auditory continuous performance task to standardize mental activity during scans. They reported bilateral increases in metabolic activity in the prefrontal cortex, but no significant change in other areas. There was a small area of deactivation in the right cerebellum.
There is only one previous fMRI study using ketamine in animals. Burdett et al. [1995] employed fMRI using deoxyhemoglobin contrast in rats to visualize changes in rCBF with ketamine. They reported a lack of significant changes in signal intensity in the bulk of the brain and muscle, which suggested that any changes were associated with increases in local CBF, rather than secondary to systemic hemodynamic changes caused by ketamine. They concluded that ketamine did not disrupt the normal close relationship between cerebral metabolism and blood flow. This suggests that ketamine does not interfere with vascular mechanisms independent of its effect on neuronal activation.
However, extrapolation of these rat data to studies employing ketamine and tasks in humans is problematic, because ketamine may have an effect upon the cognitive state and task performance, in addition to neuronal activation or cerebral blood flow, as described earlier. To our knowledge, no study has employed fMRI in healthy individuals to attempt to distinguish between the direct effect of ketamine upon cerebral blood flow, and its indirect effect upon changes in the BOLD signal resulting from an alteration in cognitive state and task performance. We decided to compare performance in an individual during a specific, but very simple cognitive task, with and without ketamine. We chose a face–non‐face perceptual task as a baseline condition for a further study of the effects of ketamine on emotion perception. This is a task for which the neural correlates or changes in BOLD signal have been identified previously in several studies, and are known to involve predominantly occipitotemporal cortex [e.g., Haxby et al., 1996; Puce et al., 1996].
We have demonstrated previously that administration of ketamine at low doses does not affect scores on Mini Mental State Examination. We therefore predicted that if low‐dose ketamine did produce any changes in cognitive state, these would be extremely subtle, and would be associated neither with reduced accuracy of performance of a simple gender discrimination task during presentation of the facial stimuli, nor with a significant alteration of the pattern of BOLD signal change to the face‐fixation cross contrast. We could therefore predict that a demonstration of a major difference in BOLD signal change to the face‐fixation cross contrast with ketamine compared to that with placebo would be attributed to stimulus‐ or task‐independent effects of the drug on cerebral blood flow (i.e., a pharmacological vascular confound of the BOLD signal change by ketamine, and not to cognitive state‐ and task‐dependent effects). If ketamine produces a large task‐independent effect, the BOLD signal change reflecting the contrast between task and non task would be minimal because the task‐independent effect of ketamine would be similar for both task and non‐task conditions and therefore the net effect of the contrast would be zero or minimal.
SUBJECTS AND METHODS
Subjects
Eight right‐handed, healthy male subjects were recruited by local advertisement (mean age 28.75 years; range 23–42; mean education, 16 years). They were screened for psychiatric or medical illness by a psychiatrist (KMA). None was using any prescribed or non‐prescribed medication. All were naïve to ketamine. Local ethical approval was obtained from the Research Ethics Committee of the Institute of Psychiatry and Maudsley Hospital. The procedures and possible side effects were fully explained to subjects by a psychiatrist or physician (KMA or MA). Subjects received information sheets several days before testing and were given opportunities to ask questions before and on the day of testing. Written and witnessed informed consent was signed. No ill effects were reported after the ketamine infusion and subjects were provided with transport home afterwards.
Ketamine and placebo administration
One hour before the scan subjects were cannulated in a forearm vein. Systolic and diastolic blood pressure and pulse were monitored from −2–0, +5, +10, +15, +30, +45 min throughout the 45–60 min of the infusion. Ketamine or normal saline placebo was infused into this cannula in a randomized, double‐blind manner: a bolus dose of 0.23 mg/kg over 0–5 min, followed by an infusion (controlled by an I‐Med pump system) of 0.5 mg/kg from +5–+45 min (maximum 1 hr). These doses affect behavior without producing anesthesia [Corssen and Domino, 1966]. Subjects entered the scanner at approximately +10 min, and underwent structural scans between +10–+20 min, with cognitive tasks thereafter. The whole procedure took between 45–60 min.
Drug administration was initially double blind, but the psychotropic effects of ketamine meant that subjects and investigators were usually able to distinguish placebo from the active drug. Test days were separated by at least 1 week and on each occasion, in order keep the second test day blinded, subjects were told that they had a one‐in‐three chance of receiving ketamine or placebo at each visit.
Cognitive and neurobehavioral measures
Subjects completed the Clinician Administered Dissociative States Scale (CADSS) [Bremner et al., 1991], the depersonalization scale [Sierra and Berrios, 2000], and the Brief Psychiatric Rating Scale (BPRS) [Overall and Gorham, 1962] starting approximately 5 min after the bolus dose. The change in CADSS, depersonalization scale and total BPRS and BPRS factor scores [Hedlund and Vieweg, 1980] were recorded. On completion of these scales, subjects (who remained lying down throughout) were placed in the scanner and given instructions regarding task completion and emergency withdrawal from the study should they so wish. In the scanner, subjects viewed 10 alternating 30‐sec blocks of mildly (25%) happy faces, employed in previous studies as neutral expressions [e.g., Phillips et al., 1997, 1998], and a fixation cross, presented as a white cross on a black background. Eight identical fixation crosses, and eight different identities were presented in each 30‐sec block, each for a 3‐sec duration with an interstimulus interval of 0.75 sec. Each face stimulus subtended visual angles of 10 degrees horizontally and 8 degrees vertically. Subjects decided upon the gender of the face by pressing one of two buttons with the right thumb, and pressed one button with the right thumb with presentation of each fixation cross. The accuracy of subjects' responses in both test conditions was recorded and analyzed post hoc. This experiment was presented as part of a larger study examining the effect of ketamine upon the neurobiological processes underlying face and emotion perception.
Image acquisition
Gradient echo echoplanar images were acquired on a GE Signa 1.5 T Neurovascular system (General Electric, Milwaukee WI) at the Maudsley Hospital, London. One hundred T2‐weighted images depicting BOLD contrast [Ogawa et al., 1990] were acquired over 5 min (for each task) at each of 14 near‐axial noncontiguous 5‐mm thick planes parallel to the intercommissural (AC–PC) line: TE 40 msec, TR 3 sec, in‐plane resolution 5 mm, interslice gap 0.5 mm. This EPI dataset provided complete coverage of the temporal lobes (including hippocampus and amygdala) and almost complete coverage of frontal, occipital and parietal lobes [Simmons et al., 1999].
STATISTICAL ANALYSES
Behavioural measures
BPRS, CADSS, depersonalization, and accuracy data were analyzed using a one‐way ANOVA (α < 0.05) with drug condition as the between group factor. Correlational analyses were carried out using Spearman's rank order test.
Image analysis
After motion correction [Bullmore et al., 1999a], periodic change in T2‐weighted signal intensity at the (fundamental) experimentally determined frequency of alternation between A and B conditions (= 1/60 Hz in all three experimental conditions) was estimated by an iterated least squares fit of a sinusoidal regression model to the fMRI time series observed at each voxel [Bullmore et al., 1996]. This model included sine and cosine waves at the fundamental AB frequency of the experimental input function, parameterized by coefficients {γ2 + δ2}. The power of periodic response to the input function was estimated by γ2 + δ2; and this fundamental power divided by its standard error yielded a standardized test statistic, the fundamental power quotient (FPQ), at each voxel. Parametric maps representing FPQ observed at each intracerebral voxel were constructed. To sample the distribution of FPQ under the null hypothesis that observed values of FPQ were not determined by experimental design (with few assumptions), the 99 images observed in each anatomical plane were randomly permuted and FPQ was estimated exactly as above in each permuted time series. This process was repeated 10 times, resulting in 10 permuted parametric maps of FPQ at each plane for each subject.
Comparison of GBAMs
To estimate between‐condition (ketamine vs. placebo) differences in mean power of functional activation, we fitted an analysis of covariance model at each intracerebral voxel of the standardized power maps after their coregistration in standard [Talairach and Tournoux, 1988] space. We used a nonparametric mode of inference on spatially‐informed test statistics to identify brain regions that showed significant difference in mean power of response between diagnostic groups [for full details of this method and its validation see Bullmore et al., 1999b]. Fitting an ANCOVA model at each intracerebral voxel generated a map of the estimated coefficient of the factor coding group membership; this coefficient, divided by its SE, was our standardized voxel test statistic b. Equivalent analysis after repeated randomization of the vector coding group generated a distribution under the null‐hypothesis of no between group difference. The critical value at Prob(b) = 0.05 (CV0.05) was calculated and the voxel test statistic map was thresholded such that if |b| > CV0.05, the value was set to b‐CV0.05. Otherwise, it was set to zero. This procedure generated a set of suprathreshold voxel clusters in 3D, each of which can be described in terms of its mass, or the sum of suprathreshold voxel statistics it comprises. The mass of each cluster was tested against a null distribution ascertained by similar thresholding of the voxel test statistic after randomization.
The rationale for this nonparametric mode of inference is that test statistics for image analysis that incorporate spatial information, such as 3D cluster mass, are generally more powerful than other possible test statistics, such as b, which are informed only by data at a single voxel. Besides greater sensitivity to between‐group differences in brain function that are located over a spatial neighborhood of voxels, another advantage of cluster‐level inference compared to voxel‐level testing is that it substantially mitigates the multiple comparisons problem. The search volume or number of clusters to be tested is typically 1–2 orders of magnitude less than the number of voxels, meaning that satisfactory Type 1 error control can be obtained without such severe risk of Type 2 error.
RESULTS
Cardiovascular responses
Figure 1a shows the mean changes in systolic and diastolic blood pressure for ketamine and placebo infusion from −2–0, +5, +10, +15, +30, +45 min throughout testing. There was no difference in baseline systolic and diastolic blood pressures: systolic (mean 130 ± 12 mm Hg placebo; 130 ± 18 mm Hg ketamine); diastolic: (mean 80 ± 6 mm Hg placebo; 79 ± 8 mm Hg ketamine). There was a main effect of time (F[4,16] = 12.9; P < 0.000) and drug condition (F[1,19] = 32.1; P < 0.000) and a drug condition × time interaction (F[4,16] = 3.7; P = 0.02) such that ketamine significantly increased both diastolic and systolic blood pressure. Figure 1b shows the mean changes in heart rate for ketamine and placebo infusion from −2–0, +5, +10, +15, +30, +45 min throughout testing. The increases in heart rate and blood pressure with ketamine were only significant +10 and +15 min, respectively, after the infusion began (P < 0.001–0.01).
Figure 1.
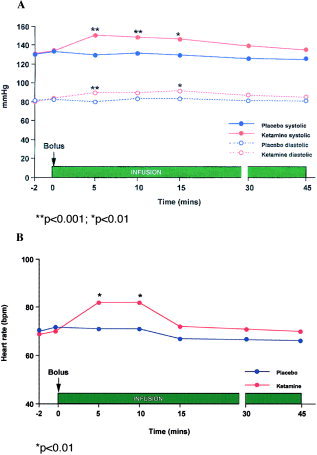
a: Mean systolic and diastolic blood pressures (mmHg) in all subjects in the two experimental conditions: ketamine (▴) vs. placebo (•). Ketamine significantly elevated both systolic (solid line) and diastolic blood (broken line) pressure in the first 15 min after infusion, but returned to baseline levels between 30–45 min. b: Mean change in heart rate in all subjects in the two experimental conditions: ketamine (▴) vs. placebo (•). Ketamine significantly increased heart rate for the first 10 min after infusion.
Clinical rating scales
The results of ketamine effects on the BPRS, CADSS, and depersonalization scales are shown in Table I. These scores were taken just before entering the scanner during steady state ketamine/placebo infusion at +15 min. Because we employed a within‐subject design, these scores were taken on only one occasion on each test day.
Table I.
Effects of ketamine vs. placebo
| Group | Mean | ±SD | n | P |
|---|---|---|---|---|
| CADSS score | ||||
| Placebo | 2.6 | 3.54 | 8 | 0.000 |
| Ketamine | 26.6 | 16.0 | 8 | |
| BPRS total | ||||
| Placebo | 1.1 | 1.1 | 8 | 0.000 |
| Ketamine | 12.1 | 5.9 | 8 | |
| Depersonalization score | ||||
| Placebo | 0.7 | 1.3 | 8 | 0.000 |
| Ketamine | 30.2 | 26.4 | 8 | |
| BPRS factor | ||||
| Tht disorder | ||||
| Placebo | 0 | 0 | 8 | 0.000 |
| Ketamine | 6.1 | 3.4 | 8 | |
| Withdrawal | ||||
| Placebo | 0.12 | 0.4 | 8 | 0.012 |
| Ketamine | 6.6 | 1.9 | 8 | |
| Anxious‐depression | ||||
| Placebo | 1.0 | 1.1 | 8 | 0.149 |
| Ketamine | 3.0 | 3.5 | 8 | |
| Hostility | ||||
| Placebo | 0 | 0 | 8 | 0.033 |
| Ketamine | 1.0 | 1.2 | 8 | |
| Activation | ||||
| Placebo | 0.25 | 0.5 | 8 | 0.016 |
| Ketamine | 2.37 | 2.1 | 8 |
Accuracy data
Accuracy on gender–decision task did not vary significantly between the two conditions (with and without ketamine). Mean percent correct scores: ketamine 96.5 ± 5.95; placebo 94.0 ± 5.9.
Generic brain activation maps
Placebo infusion
Predominant regions of BOLD signal change included occipitotemporal cortical regions, medial and inferior frontal cortex, and the insula (Table II; Fig. 2).
Table II.
Major brain regions with significant BOLD signal change with presentation of neutral faces versus a baseline fixation cross*
| Side | Talairach coordinates | BA | Size | |||
|---|---|---|---|---|---|---|
| x | y | z | ||||
| During infusion of placebo | ||||||
| Occipitotemporal region | ||||||
| Middle occipital gyrus | R | 32 | −69 | −7 | 18 | 337 |
| Lingual gyrus | R | 11 | −82 | −2 | 18 | 249 |
| Superior temporal gyrus | R | 43 | 0 | −7 | 38 | 131 |
| L | −43 | 10 | −7 | 38 | 82 | |
| Cuneus | R | 4 | −76 | 20 | 18 | 110 |
| Fusiform gyrus | R | 40 | −46 | −18 | 37 | 71 |
| Superior occipital gyrus | R | 32 | −63 | 31 | 19 | 61 |
| Middle temporal gyrus | R | 43 | −46 | 9 | 21 | 17 |
| L | −40 | −4 | −24 | 21 | 43 | |
| Frontal/precentral regio | ||||||
| Precentral gyrus | L | −47 | 0 | 37 | 4 | 196 |
| Ventrolateral prefrontal cortex | R | 32 | 10 | −18 | 47 | 64 |
| L | −36 | 17 | −18 | 47 | 76 | |
| Inferior frontal gyrus | R | 43 | 4 | 31 | 44 | 51 |
| L | −36 | 4 | 26 | 44 | 52 | |
| Orbitofrontal cortex | R | 11 | 39 | −13 | 11 | 34 |
| Medial frontal gyrus | L | −21 | 23 | 37 | 32 | 18 |
| Parietal regions | ||||||
| Inferior parietal lobule | R | 43 | −37 | 37 | 40 | 50 |
| L | −40 | −39 | 48 | 40 | 89 | |
| Insula | R | 43 | 7 | 4 | 11 | |
| L | −36 | 13 | 9 | 40 | ||
| Thalamus | L | −4 | −20 | 4 | 24 | |
| Cerebellum | R | 36 | −67 | −24 | 28 | |
| L | −36 | −67 | −13 | 255 | ||
| During infusion of ketamine | ||||||
| Occipitotemporal regions | ||||||
| Precuneus | R | 17 | −60 | 31 | 7 | 22 |
| L | −7 | −67 | 31 | 19 | 11 | |
| Fusiform gyrus | R | 32 | −39 | −18 | 37 | 21 |
| Middle temporal gyrus | R | 32 | −13 | −7 | 21 | 25 |
| Superior temporal gyrus | R | 40 | −46 | 20 | 22 | 15 |
| Posterior cingulate gyrus | R | 7 | −50 | 37 | 31 | 10 |
| Thalamus | R | 7 | −30 | 4 | 53 | |
| Insula | R | 40 | −26 | 4 | 17 | |
| Parahippocampal gyrus | R | 21 | −37 | −13 | 11 | |
Talairach coordinates refer to the voxel with the maximum FPQ (fundamental power quotient) in each cluster. All such voxels were identified by a one‐tailed test of the null hypothesis that median FPQ is not determined by experimental design.
The probability threshold for activation was P ≤ 0.004.
Figure 2.
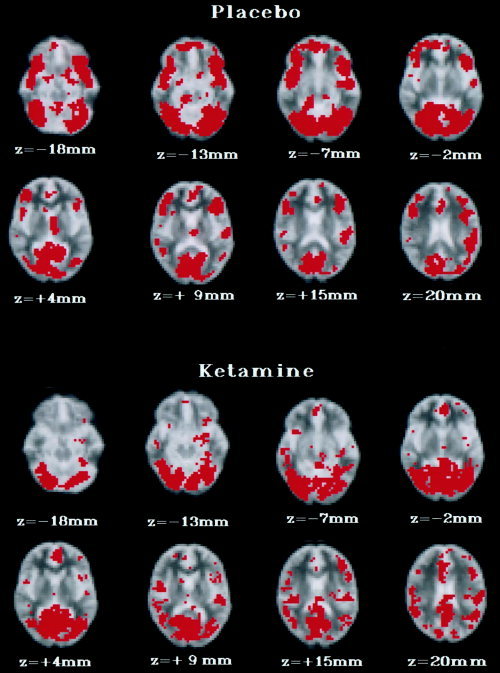
Generic brain activation (GBAM) during placebo and ketamine infusion in response to presentation of alternating blocks of emotionally neutral faces and fixation crosses in eight healthy male volunteers. The left side of the brain is shown on the right side of the image, and vice versa. The probability threshold for activation was P ≤ 0.004. Eight transverse brain slices are shown from 18 mm below to 20 mm above the transcallosal plane. During placebo infusion, significant BOLD signal change was demonstrated predominantly within occipitotemporal (BA 18, 37, 38) and prefrontal regions (BA 11, 47). During ketamine infusion, significant BOLD signal change was demonstrated predominantly within occipitotemporal regions (BA 37, 21, 22).
Ketamine infusion
Major regions of BOLD signal change included occipitotemporal cortical regions, medial and inferior frontal cortex, the insula and hippocampus (Table II; Fig. 2).
Comparison of the GBAMs relating to the two experimental conditions
Regions with significantly greater BOLD signal change (P = 0.01) in the placebo compared to the ketamine condition included two 3D clusters in the middle occipital gyrus (BA 18) and the precentral gyrus (BA 4). There were no regions with significantly greater BOLD signal change in the ketamine condition (Table III).
Table III.
Three‐dimensional clusters with significantly greater BOLD signal change to the contrast of neutral faces and the fixation cross in the placebo compared with the ketamine condition*
| Cerebral region | Side | x | y | z | BA | Size |
|---|---|---|---|---|---|---|
| Middle occipital gyrus | L | −37 | −77 | −6 | 18 | 392 |
| Precentral gyrus | L | −42 | −8 | 43 | 4 | 336 |
Talairach co‐ordinates refer to the voxel with the maximum FPQ (fundamental power quotient) in each cluster. The total number of clusters compared between the two conditions was <200, P = 0.01. The expected number of false positive tests was <1.
DISCUSSION
To our knowledge, this is the first report of a study using ketamine in an fMRI paradigm in healthy volunteers. In our healthy male volunteers exposed to ketamine, we have induced physiological and psychopathological changes consistent with other data using this dose [Abel et al., 2000; Krystal et al., 1994]. We have attempted to address the so‐called 'vascular confounds' that may alter the BOLD signal using a pharmacological challenge in fMRI: 1) global and local task‐independent changes in BOLD signal change e.g., systemic cardiovascular changes that may alter the resting perfusion of the whole brain and local CBF changes in particular regions; and 2) task‐dependent effects e.g., changes in the vascular response to any performance‐related change in neuronal activity. If (1) were true the pattern of BOLD signal change to the task and non‐task conditions would cancel each other out, because the effect on BOLD signal change would occur in both conditions (during task and during non‐task) because it is task‐independent, therefore the contrast to the task and non‐task would be zero or minimal. In (2), BOLD signal change representing task‐dependent effects of ketamine would manifest itself in a significant difference between task and non‐task conditions. We did not demonstrate effects described in (1), rather, a significant difference was found between task and non‐task in ketamine and placebo conditions.
Peak psychotomimetic and cardiovascular effects occurred during the initial bolus and rapidly achieved steady state as found by Vollenweider et al. [1997a, 1997b] using a similar paradigm. The fact that there was no significant difference between cardiovascular measures with placebo and ketamine beyond 15 min into the infusion, also makes the first vascular confound unlikely: that ketamine changes BOLD signal in response to the face‐non‐face contrast because of an impact on global cerebral blood flow via systemic cardiovascular effects.
Ketamine could have changed cerebral blood flow in particular regions, independent of a task. We have described BOLD signal changes in response to the face‐non‐face contrast in very similar regions (predominantly occipitotemporal cortex) in each of two conditions: continuous low dose ketamine infusion or placebo in eight healthy men. These regions have been shown to be activated during face perception in previous studies [Haxby et al., 1996; Puce et al., 1996]. There were no regions showing significantly greater BOLD signal change to the face‐non‐face contrast at this dose of ketamine compared to placebo, and there were only two areas with significantly greater BOLD signal change to the face‐non‐face contrast in the placebo compared to the ketamine condition, one of which was within occipital cortex. These results are consistent with previous findings of a decrease in blood flow and cerebral metabolism with ketamine infusion in visual cortex in PET studies [Lahti et al., 1995; Vollenweider et al., 1997a]. Therefore, in this experiment, low dose ketamine appeared to produce small effects that were probably focal and associated with task performance, rather than either local or global, task‐independent effects on blood flow and the resulting BOLD signal change.
Although our data suggest that ketamine did not directly affect global CBF, or CBF in a particular region (independent of task), we have not been able to test directly whether or not there was a task/stimulus‐independent effect on 'neurovascular coupling.' Previous experiments in rats and humans suggest that rCBF is a good reflection of local neuronal metabolism and that local neuronal metabolism closely mirrors synaptic activity [Jueptner and Weiller, 1995 for review]. These authors suggest that measurement of local cerebral glucose utilization (LCGU) is a good reflection of regional CBF (rCBF) and, in turn, postsynaptic activity. Therefore, the ratio of rCBF/LCGU can be used to assess any blood flow changes locally that are not due to changes in synaptic activity. In the rat, Cavazutti et al. [1987] measured the coupling of rCBF and (LCGU) in anesthetized animals exposed to various doses of ketamine. They reported that LGCU was significantly increased in some limbic structures and decreased in the inferior colliculus. Although hypercapnia occurred in these animals, the pattern of rCBF/LCGU ratios did not change across 36 brain regions examined. They concluded that in the anesthetized rat, no net vasodilatation or vasoconstriction was observed with ketamine and that CBF changes induced by the drug in animals and humans are primarily related to metabolic effects exerted on cerebral structures rather than on cerebral vasculature. As described above, the demonstration of region specific BOLD signal changes to the contrast of face non‐face task, suggests task‐dependent ketamine effects, rather than vascular confounds of the drug.
Our data is not consistent with findings from three previous PET studies showing increases in metabolism and blood flow predominantly in prefrontal cortex and anterior cingulate gyrus during infusion with various low subanesthetic doses of ketamine [Brier et al., 1997; Lahti et al., 1995; Vollenweider et al., 1997a]. Taken together, these data do not allow a distinction to be made between ketamine‐induced (metabolic and) blood flow changes associated with presence of (and attention to) psychotic symptoms, in the absence of cognitive task performance [Lahti et al., 1995; Vollenweider et al., 1997a], and the specific task‐dependent and task‐independent effects of ketamine on blood flow per se [Brier et al., 1997]. It is possible that the increase in frontal metabolism and blood flow with ketamine infusion in these studies is related to the particular characteristics of either the subjects studied or the cognitive task carried out. Thus, Vollenweider et al. [1997a] induced frank psychosis in healthy subjects and tested them 'at rest' without controlling for mental activity. Lahti et al. [1995] studied schizophrenic patients with psychotic symptoms 'at rest,' again without controlling for mental activity. Brier et al. [1997] studied healthy subjects during performance of the auditory continuous performance task with few psychotic symptoms induced by a lower dose of ketamine.
In our study, subjects viewed alternating blocks of faces and non‐faces and carried out a gender discrimination task. Facial viewing and facial gender discrimination are cognitively undemanding tasks, the neural correlates of which have been identified previously as involving predominantly visual cortex and not prefrontal cortex. We found a relative reduction in BOLD signal in only one region of precentral gyrus, and did not demonstrate significant increases in BOLD signal change to the contrast in any frontal regions with ketamine infusion compared to placebo. In fact, the face‐cross contrast was very similar in pattern of BOLD signal change in both placebo and ketamine conditions in predicted face processing regions, i.e., the task‐dependent effect of ketamine, was very small. Our findings suggest that any effect of ketamine on BOLD signal change, and therefore blood flow, to the contrast is dependent on the cognitive task carried out, rather than a large independent effect of ketamine on cerebral blood flow or neurovascular coupling per se. Indeed, consistent with our findings was the demonstration in the Brier et al. [1997] study, using FDG‐PET and a task to control for mental activity (as in our design), of no significant difference in global metabolic activity between ketamine and placebo infusion between drug conditions.
There are several limitations to this study. First, subjects repeated the same task on two separate occasions, and as such there may be repetition effects. We randomized the order of tasks in the scanner and the order of ketamine exposure to control for this. In addition, gender discrimination accuracy did not vary over the conditions in any subjects. Second, plasma ketamine levels were not measured using the continuous infusion paradigm. This study lasted <1 hr using an identical dosing regime to Krystal et al. [1994] and, as they have noted, during a 0.5 mg/kg/hr infusion, plasma ketamine levels are estimated to remain between 0.1–0.25 mg/l. Van Berckel et al. [1998] also found that ketamine levels did not vary significantly during an infusion of 0.3 mg/kg over 2.5 hr. Finally, it may be that some subjects are more sensitive to performance deficit with ketamine compared to others. If this were the case, an increased inter‐subject variability in gender discrimination accuracy in the ketamine compared to the placebo condition would be predicted, but this was not the case.
CONCLUSION
To date this is the only study to attempt to discriminate between task‐dependent and task‐independent effects on the BOLD signal during performance of cognitive tasks with a pharmacological probe. Our findings highlight the need for future pharmacological fMRI paradigms to address this potential confound in a systematic manner.
REFERENCES
- Abel KM, Allin M, Geyer M (2000): Subanesthetic ketamine in healthy male volunteers: effects on sensorimotor gating, cognitive performance and perception. Schizophr Res 41: 236. [Google Scholar]
- Adler CM, Goldberg TE, Malhotra AK, Pickar D, Breier A (1998): Effects of ketamine on thought disorder, working memory, and semantic memory in healthy volunteers. Biol Psychiatry 43: 811–816. [DOI] [PubMed] [Google Scholar]
- Artru AA (1990): Hypocapnia or diazepam reverses, and midazolam or fentanyl attenuates ketamine induced increase of cerebral blood volume and/or CSF pressure In: Domino EF, editor. Status of ketamine in anesthesiology. Ann Arbor: NPP Books. [Google Scholar]
- Beart PM, Sheehan K‐AM, Manallack DT (1988): Absence of N‐methyl‐d‐aspartate receptors on ovine cerebral microvessels. J Cereb Blood Flow Metab 8: 879–882. [DOI] [PubMed] [Google Scholar]
- Breier A, Malhotra AK, Pinals DA, Weisenfeld NI, Pickar D (1997): Association of ketamine‐induced psychosis with focal activation of the prefrontal cortex in healthy volunteers. Am J Psychiatry 154: 805–811. [DOI] [PubMed] [Google Scholar]
- Bremner JD, Krystal JH, Putnam FW, Southwick SM, Marmar C, Charney DS, Mazure CM (1991): Measurement of dissociative states with the Clinician Administered Dissociative States Scale. J Trauma Stress 11: 25–136. [DOI] [PubMed] [Google Scholar]
- Bullmore ET, Brammer MJ, Williams SCR, Rabe‐Hesketh S, Janot N, David AS, Mellers JDC, Howard, R , Sham P (1996): Statistical methods of estimation and inference for functional MR image analysis. Magn Reson Med 35: 261–277. [DOI] [PubMed] [Google Scholar]
- Bullmore ET, Brammer MJ, Rabe‐Hesketh S, Curtis VA, Morris RG, Williams SCR, Sharma T, Murray RM, McGuire PK (1999a): Methods for the diagnosis and treatment of stimulus correlated motion in generic brain activation studies using fMRI. Hum Brain Mapp 7: 38–48. [DOI] [PMC free article] [PubMed] [Google Scholar]
- Bullmore ET, Suckling J, Overmeyer S, Rabe‐Hesketh S, Taylor E, Brammer MJ (1999b): Global, voxel and cluster tests, by theory and permutation, for a difference between two groups of structural MR images of the brain. IEEE Trans Med Imaging 18: 32–42. [DOI] [PubMed] [Google Scholar]
- Burdett NG, Menon DK, Carpenter TA, Jones JG, Hall LD (1995): Visualization of changes in regional cerebral blood flow (rCBF) produced by ketamine using long TE gradient‐echo sequences: preliminary results. Magn Reson Imaging 13: 549–553. [DOI] [PubMed] [Google Scholar]
- Cavazzuti M, Porro CA, Biral GP, Benassi C, Barbieri GC (1987): Ketamine effects on local cerebral blood flow and metabolism in the rat. J Cereb Blood Flow Metab 7: 806–811. [DOI] [PubMed] [Google Scholar]
- Corssen G, Domino EF (1966): Dissociative anesthesia: further pharmacologic studies and first clinical experience with phencyclidine derivative CI‐581. Anesth Analg 45: 29–40. [PubMed] [Google Scholar]
- Dawson B, Michenfelder JB, Theye RA (1971): Effects of ketamine on canine cerebral blood flow and metabolism: modification by prior administration of thiopental. Anesth Analg 50: 443–445. [PubMed] [Google Scholar]
- Faraci FM, Breese KR (1993): Nitric oxide mediates vasodilation in response to activation of N‐methyl‐d‐aspartate receptors in brain. Circ Res 72: 476–480. [DOI] [PubMed] [Google Scholar]
- Fergus A, Lee KS (1997): Regulation of cerebral microvessels by glutamatergic mechanisms. Brain Res 553: 75–83. [DOI] [PubMed] [Google Scholar]
- Fukuda S, Murakawa T, Takeshita H, Toda N (1983): Direct effects of ketamine on isolated canine cerebral and mesenteric arteries. Anesth Analg 62: 533–558. [PubMed] [Google Scholar]
- Golanov EV, Yamamoto S, Reis DJ (1994): Spontaneous waves of cerebral blood flow associated with a pattern of electrocortical activity. Am J Physiol 266: R204–R214. [DOI] [PubMed] [Google Scholar]
- Golanov EV, Reis DJ (1996): Cerebral cortical neurons with activity linked to central neurogenic spontaneous and evoked elevations in cerebral blood flow. Neurosci Lett 209: 101–104. [DOI] [PubMed] [Google Scholar]
- Haxby JV, Ungerleider LG, Horwitz B, Maisog JM, Rappoport SI, Grady, CL (1996): Face encoding and recognition in the human brain. Proc Natl Acad Sci USA 93: 922–927. [DOI] [PMC free article] [PubMed] [Google Scholar]
- Hedlund JL, Vieweg BW (1980): The Brief Psychiatric Rating Scale (BPRS): a comprehensive review. J Operation Psych 11: 48–64. [Google Scholar]
- Herrschaft H, Schmidt H (1973): Der Einflub von Ketaminauf die Hirndurchblutung beim Menshen In: Gemperle M, Kreuscher H, Langrehr D, editor. Ketamin. Berlin: Springer‐Verlag, p 187–208. [Google Scholar]
- Hougaard K. Hansen A. Brodersen P (1974): The effect of ketamine on regional cerebral blood flow in man. Anesthesiology 41: 562–567. [DOI] [PubMed] [Google Scholar]
- Jueptner M, Weiller C (1995): Review: does measurement of regional cerebral blood flow reflect synaptic activity? Implications for PET and fMRI. Neuroimage 2: 148–156. [DOI] [PubMed] [Google Scholar]
- Kreuscher H, Grote J (1967): Die Wirking des Phenylcyclidin‐Derivatives Ketamine (CI581) auf die Durchbkutung und Saures‐Stoffaufnahme des Gihirns bein Hund. Der Anesthetist 16: 304–307. [Google Scholar]
- Krystal JH, Karper LP, Seibyl JP, Freeman GK, Delaney R, Bremner JD, Heninger GR, Bowers MB, Charney DS (1994): Subanesthetic effects of the noncompetitive NMDA antagonist, ketamine, in humans. Arch Gen Psychiatry 51: 199–214. [DOI] [PubMed] [Google Scholar]
- Lewis SJ, Barres C, Jacob HJ, Ohta H, Brody MJ (1989): Cardiovascular effects of the N‐methyl‐d‐aspartate receptor antagonist, MK‐801 in conscious rats. Hypertension 13: 759–765. [DOI] [PubMed] [Google Scholar]
- Lahti AC, Holcolmb HH, Medoff DR, Tamminga CA (1995): Ketamine activates psychosis and alters limbic blood flow in schizophrenia. NeuroReport 6: 869–872. [DOI] [PubMed] [Google Scholar]
- Malhotra AK, Pinals DA, Weingartner H, Sirocco K, Missar CD, Pickar D, Breier A (1996): NMDA receptor function and human cognition: the effects of ketamine in healthy volunteers. Neuropsychopharmacology 14: 301–307. [DOI] [PubMed] [Google Scholar]
- Moretti RJ, Hassan SZ, Goodman LI, Meltzer HY (1984): Comparison of ketamine and thiopental in healthy volunteers: effects on mental status, mood, and personality. Anesth Analg 63: 1087–1096. [PubMed] [Google Scholar]
- Ogawa S, Lee TM, Kay AR, Tank DW (1990): Brain magnetic resonance imaging with contrast dependent blood oxygenation. Proc Natl Acad Sci USA 87: 8868–8872. [DOI] [PMC free article] [PubMed] [Google Scholar]
- Overall JE, Gorham DR (1962): The Brief Psychiatric Rating Scale. Psychol Rep 10: 799–812. [Google Scholar]
- Pandit SK, Kothary SP, Kumar SM (1980): Low dose intravenous infusion technique with ketamine. Amnesic, analgesic and sedative effects in human volunteers. Anesthesia 35: 669–675. [DOI] [PubMed] [Google Scholar]
- Phillips ML, Young AW, Senior C, Brammer M, Andrew C, Calder AJ, Bullmore ET, Perrett DI, Rowland D, Williams SC, Gray JA, David AS (1997): A specific neural substrate for perceiving facial expressions of disgust. Nature 389: 495–498. [DOI] [PubMed] [Google Scholar]
- Phillips ML, Bullmore ET, Howard R, Woodruff PW, Wright IC, Williams SC, Simmons A, Andrew C, Brammer M, David AS (1998): Investigation of facial recognition memory and happy and sad facial expression perception: an fMRI study. Psychiatry Res 83: 127–138. [DOI] [PubMed] [Google Scholar]
- Puce A, Truett A, Asgari M, Gore JC, McCarthy G (1996): Differential sensitivity of human visual cortex to faces, letter strings, and textures: a functional magnetic resonance imaging study. J Neurosci 16: 5205–5215. [DOI] [PMC free article] [PubMed] [Google Scholar]
- Schwedler M, Miletich DJ, Albrecht RF (1982): Cerebral blood flow and metabolism following ketamine administration. Can Anaesth Soc J 29: 223–225. [DOI] [PubMed] [Google Scholar]
- Sierra M, Berrios GE (2000): The Cambridge Depersonalization Scale: a new instrument for the measurement of depersonalization. Psychiatry Res 93: 153–164. [DOI] [PubMed] [Google Scholar]
- Simmons A. Moore E. Williams SC (1999): Quality control for functional magnetic resonance imaging using automated data analysis and Shewhart charting. Magn Reson Med 41: 1274–1278. [DOI] [PubMed] [Google Scholar]
- Takayasu M, Dacey RG (1989): Effects of inhibitory and excitatory amino acid neurotransmitters on isolated cerebral parenchymal arterioles. Brain Res 482: 393–396. [DOI] [PubMed] [Google Scholar]
- Takeshita H, Okuda Y, Sari A (1972): The effects of ketamine on cerebral circulation and metabolism in man. Anesthesiology 36: 69–74. [DOI] [PubMed] [Google Scholar]
- Talairach J, Tournoux P (1988): Co‐planar stereotactic atlas of the human brain. Stuttgart, Germany: Thieme Verlag. [Google Scholar]
- van Berckel BNM, Oranje B, van Ree JM, Verbaten MN, Kahn RS (1998): The effects of low dose ketamine on sensory gating, neuroendocrine secretion and behavior in healthy human subjects. Psychopharmacology 137: 271–281. [DOI] [PubMed] [Google Scholar]
- Vollenweider FX, Leenders KL, Scharfetter C, Antonini A (1997a): Metabolic hyperfrontality and psychopathology in the ketamine model of psychosis using positron emission tomography (PET) and [‐super(18)F]fluorodeoxyglucose (FDG). Eur Neuropsychopharmacol 7: 9–24. [DOI] [PubMed] [Google Scholar]
- Vollenweider FX, Leenders KL, Oye I, Hell D, Angst J (1997b): Differential psychopathology and patterns of cerebral glucose utilization produced by (S)‐ and (R)‐ketamine in healthy volunteers using positron emission tomography (PET). Eur Neuropsychopharmacol 7: 25–38. [DOI] [PubMed] [Google Scholar]