

Abstract
To investigate the effect of sedative agents on visual processing in humans, we analysed the BOLD contrast signal response to a visual stimulation paradigm in 15 healthy, adult volunteers using functional magnetic resonance imaging. The subjects were tested during alert state and under sedation following intravenous administration of pentobarbital. The injection of pentobarbital not only significantly reduced the response signal strength but the reduction in BOLD contrast signal was related to the ratio of amount of sedative administered and the subject's body weight. The three subjects with the highest relative sedative dosage even displayed an inverted (negative) BOLD contrast signal. A significant reduction in the number of positively correlating pixels was found 15 min after administration of pentobarbital. All measured parameters returned to near pre‐sedative levels by the end of the experimental session. The relative dosage dependence of the strength of the BOLD signal the negative BOLD signal in the three subjects with the highest relative sedative dosage indicates that pentobarbital had a more pronounced effect on cerebral blood flow than on cerebral oxidative metabolism. Hum. Brain Mapping 10:132–139, 2000. © 2000 Wiley‐Liss, Inc.
INTRODUCTION
More than 100 years ago, Roy and Sherrington hypothesised that neuronal activity and metabolism is coupled with cerebral blood flow [Roy et al., 1890]. This complex link between neuronal activity and local cerebral blood flow (ICBF), whether it is the response to vasoactive neurotransmitters from the abundant perivascular nerve supply [Lou et al., 1987; Purves, 1978], or rather mediated by various chemical compounds [Kuschinsky, 1990; Raichle et al., 1976] still remains to be untangled. The increase in ICBF associated with activated areas of the cerebral cortex [Fox et al., 1986] results in changes of the blood oxygenation level. Blood oxygenation level dependent (BOLD) contrast forms the basic mechanism underlying functional MRI [Kwong et al., 1992; Ogawa et al., 1990], which has significantly improved our understanding of brain function [Posner and Raichle, 1998].
In a parallel study [Martin et al., 1999] we noted that the immaturity of the vascular system of neonates and infants played a major role in determining the polarity of the BOLD contrast signal observed. This led us to speculate whether the changes in ICBF may be the dominant factor in determining the strength of the BOLD contrast signal. To this end, we investigated the effect of the sedative agent Pentobarbital on the BOLD contrast signal obtained during visual stimulation. Pentobarbital is often used as a sedative in children during clinical MR examinations to avoid movement artefacts and claustrophobia.
In the rat, barbituates have been shown to suppress the CBF and CMRO2 in a dose‐dependent manner [Kety et al., 1947–48; Nilsson and Siesjö, 1975]. Thiopentone has also been shown to lower the amplitude of visually evoked potentials in the rat [Chi et al., 1989] and to reduce the increase in ICBF in response to somatosensory stimulation [Lindauer et al., 1993]. These findings indicate that the administration of a sedative agent may influence any functional measurements made, because of its effect on blood flow, neuronal activity, and neuronal metabolism. The changes in neuronal activity and metabolism observed in the rat were much smaller than the reduction in ICBF. Should this also be the case in humans, it is conceivable that the influence of sedative agents on the BOLD contrast signal will be less marked than expected.
In order to understand the relationship between changes of ICBF and the BOLD contrast signal, we modulated the former by administering pentobarbital intravenously to normal adult volunteers immediate prior to a fMRI measuring session involving a passive, viewing task.
MATERIALS AND METHODS
Fifteen healthy, adult volunteers (nine female, six male; mean age of 29.3 years; range 23–47 years) were tested on two separate occasions. None of the subjects had a history of regular drug use or abuse. During one session, the subject viewed the visual stimulus in an awake condition (protocol 1), in the other (protocol 2) in a sedated condition. The study was approved by the ethical committee and written consent was obtained from all subjects. All measurements were made using a 2 Tesla magnetic resonance system (Tomikon S200A, Bruker‐Medical, Switzerland), using a quadrature head coil. Visual stimulation occurred via a set of LED goggle (Grass Instruments, Quincy, MA, USA) with a flicker rate of 8 Hz. Rubber foam padding was used to bed the subject's head in the head holder.
The functional images were made using a multislice interleaved excitation cycle (MUSIC) sequence [Loenneker et al., 1996]. This is a T2* gradient echo, BOLD contrast sensitive sequence with the following parameters: TE 40 ms, TR 100 ms, flip angle 20°, field of view between 22 and 25 cm and slice thickness 4 mm with a gap of 1 mm between slices. Each slice was recorded with a matrix resolution of 128 × 64 voxels and reconstructed into a 128 × 128 matrix after zero filling.
In order to follow the effect of the sedative agent on the BOLD response, we measured one subject (MN) a second time. During this one session, measurements were made at 10‐min intervals, starting from 10 min before the administration of the sedative agent until 1 h after. During this session, we employed an EPI sequence with the following parameters: TE (effective) = 40 ms, TR = 1000 ms, and flip angle = 90°.
Protocol 1 (Awake)
The subjects were examined in an alert and conscious state. Six axial, oblique slices were placed through the visual cortex and parallel to the calcarine sulcus. Saggital anatomical images were used to position the slices. The paradigm consisted of eight images without stimulation followed by eight images with visual stimulation. This cycle was repeated four times, to produce a time‐series of each slice consisting of 64 images. At the end of the functional session, a set of anatomical images was made of each slice. This enabled us to localise the activity observed in the functional images.
Protocol 2 (Sedated)
Three weeks separated the measurements in protocol 2 from those undertaken in protocol 1. As the subject was to be sedated during this session, we inserted titanium eyelid retractors to ensure that the eyelids remained open during the session. For the comfort of the subject, prior to application of the eyelid retractors a local anaesthetic agent (Novesin, CibaVision) was applied to the eye and the conjunctiva and cornea were protected using a protective eye gel (Viscotears, CibaVision).
At the beginning of this session, we first repeated the measurement made under protocol 1 (re‐test condition) to ensure reproducibility. After having obtained the baseline measurements, the subjects were administered 150 mg of pentobarbital iv. To administer the sedative agent, the subject was always moved out of the scanner, but remained immobilised on the table. This enabled us to verify that the subjects eyes were in a forward looking position and did not settle in a divergent position. Functional measurements were made 15 and 45 min after the administration of pentobarbital. During the whole experiment the ECG, pulse rate, respiration, and oxygen saturation were continuously monitored until the subjects regained consciousness. During the experimental session, we placed our subjects always under video observation.
Postprocessing
To determine the sites of activation we performed a cross‐correlation analysis [Bandettini et al., 1993] using AVS (Advanced Visual Systems Inc., U.S.A.) software. Pixels with a positive correlation coefficient r ≥ 0.4 were labelled from yellow to red and those with a negative correlation coefficient r ≤ −0.35 were labelled light to dark blue. To quantify the extent of the activated areas, a region of interest was defined for every slice around the calcarine sulcus.
The number of positively and negatively correlating pixels were counted separately. We also calculated the power spectrum for each MRI slice in order to determine the percent power at the stimulation frequency in relation to the total signal power. Percent signal change was computed by averaging all pixels containing more that 10% signal power at the stimulation frequency in the ROI. As we did not specify the phase shift in the response function, both pixels with a positive and negative signal change are shown in the image.
RESULTS
Protocol 1 (Awake)
All 15 volunteers showed a positive BOLD contrast signal increase (mean: 2.46%) in the visual cortex during photic stimulation as shown in the example of Figure 1A. The mean number of positively correlated pixels around the calcarine sulcus was 165 compared to a mean of 3.2 for the negatively correlated pixels. The results of the awake condition are summarised in Table I.
Figure 1.
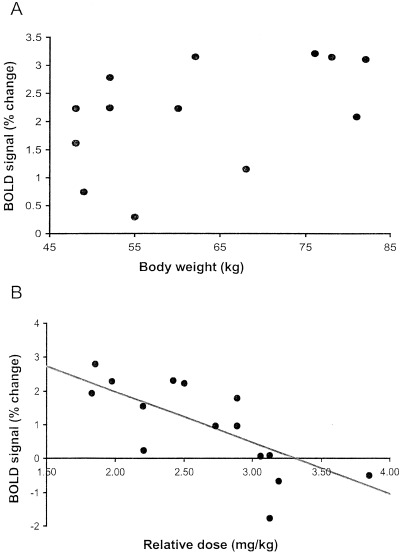
The figure depicts two scatterplots. (A) Scatterplot of the BOLD signal strength against the subjects body weight. The regression analysis revealed no significant correlation between the subject's body weight and the strength of the BOLD signal measured when the subject was in an alert state (r = 0.38; N = 15; df = 14; F = 2.14; p = 0.167). (B) Scatterplot of the BOLD signal strength measured 15 min after sedation and the relative dose. The latter being derived by dividing the amount of sedative agent administered by the subject's body weight. A regression analysis indicated a significant correlation between the two parameters (r = 0.75; N = 15; df = 14; F = 17.4; p = 0.001).
Table I.
The table shows the mean strength of the BOLD signal for each subject before sedation, 15 min after sedation, and 45 min after sedation
| Name | Age | Gender | Weight (kg) | Pentobarbital (mg) | Dose ratio | Change awake (%) | Change sedation (%) 15′ | Change sedation (%) 45′ |
|---|---|---|---|---|---|---|---|---|
| S1 | 27 | m | 82 | 150 | 1.829 | 3.11 | 2.31 | 2.53 |
| S2 | 31 | f | 52 | 150 | 2.885 | 2.25 | 0.96 | 2.69 |
| S3 | 31 | m | 76 | 150 | 1.974 | 3.22 | 2.29 | 2.95 |
| S4 | 26 | f | 49 | 150 | 3.061 | 3.2 | 0.07 | 1.39 |
| S5 | 26 | f | 48 | 150 | 3.125 | 0.75 | 0.09 | — |
| S6 | 24 | f | 47 | 150 | 3.191 | 2.23 | −0.66 | −0.17 |
| S7 | 23 | m | 81 | 150 | 1.852 | 2.09 | 2.25 | 2.8 |
| S8 | 25 | m | 68 | 150 | 2.206 | 1.15 | 0.24 | 1 |
| S9 | 28 | m | 78 | 300 | 3.846 | 3.15 | −0.51 | 1.92 |
| S10 | 47 | f | 52 | 150 | 2.885 | 2.78 | 1.79 | 2.9 |
| S11 | 28 | f | 48 | 150 | 3.125 | 1.61 | −1.76 | −0.55 |
| S12 | 25 | m | 68 | 150 | 2.206 | 2.69 | 1.55 | 3.85 |
| S13 | 30 | f | 55 | 150 | 2.727 | 0.3 | 0.96 | 2.06 |
| S14 | 33 | f | 60 | 150 | 2.5 | 2.23 | 2.33 | 3.09 |
| S15 | 42 | f | 62 | 150 | 2.419 | 3.15 | 1.94 | — |
Protocol 2 (Sedated)
As with protocol 1, all subjects showed a positive BOLD contrast signal change (mean: 2.54%). The mean number of positively correlating pixels in the awake condition of protocol 2 was 143.0 with the mean number of negatively correlating pixels being 2.4. Fifteen minutes after administration of pentobarbital, the mean number of positively correlating pixels had dropped to 51 and the mean strength of the BOLD contrast signal was 0.92%. The mean number of negatively correlating pixels had risen to 7.9.
At the time of the second measurement, 45 min following administration of pentobarbital, the mean number of positively correlating signals was 176 and the signal strength of the BOLD contrast signal had risen to 2.1%. By the time of this second measurement, the mean number of negatively correlating pixels had dropped to 3.8.
Data Analysis
We compared the signal strength and number of positive or negative correlating BOLD contrast signals using a Wilcoxon signed rank test. The comparison of the BOLD signal strength between the awake (re‐test) conditions of protocol 2 and that of protocol 1 revealed no significant differences (T + = 47.5; N = 11; p = 0.120). Following the injection of pentobarbital, we observed a significant decrease in the strength of the BOLD contrast related signal, compared to the awake state (T + = 113.5; N = 15; p = 0.006).
For safety reasons, we were not permitted to administer more than 150 mg of Nembutal to our subjects. This precluded us from adjusting the dosage to the individuals body weight in order to obtain a baseline for the blood flow response. To examine how the blood flow and hence the BOLD contrast signal was effected by the presence of the sedative agent, we performed a regression analysis on the strength of the BOLD contrast signal and the concentration of the sedative. We calculated the concentration by dividing the amount of sedative agent administered (150 mg) by the subject's body weight. The assumption was that the higher the concentration of the sedative the lower the response in blood flow and hence the smaller our measured BOLD signal. The sedative agent was injected directly into the venous blood stream and so we compared the BOLD signal obtained 15 min after administration with the concentration of the sedative agent. Figure 1B shows the scatter plot of BOLD contrast signal at 15 min against the concentration of the sedative agent. The regression analysis shows the two parameters to be significantly linked (r = 0.75, N = 15; df = 14, F = 17.17; p = 0.001). This confirms our hypotheses that the BOLD contrast signal we measured is related to the concentration of the sedative agent.
At the time of the second measurement, 45 min after drug administration, the signal strength had recovered to near pre‐sedative level (T + = 49; N = 13; p = 0.420). Table I shows the results for the percentage change in BOLD contrast signal between the awake and the sedated condition, 15 min and 45 min after injection for each subject.
Comparing the number of positively correlating pixels from protocol 1 and the (re‐test) awake condition of protocol 2, no significant difference in the number of positively correlating pixels (T + = 30; N = 11; p = 0.415) was found.
A comparison of the number of positively correlating pixels during the awake state of protocol 2 and the sedative state 15 min after drug administration, revealed significantly fewer positively correlating pixels in the calcarine sulcus (T + = 113; N = 15; p = 0.006). Table II shows the number of positively and negatively activated pixels during the awake and sedated condition for each subject.
Table II.
The table shows the number of positively and negatively correlating pixels for each subject before sedation, 15 min after sedation, and 45 min after sedation
| Name | Age | Gender | Positively correlated pixels | Positively correlated pixels | Negatively correlated pixels | Negatively correlated pixels |
|---|---|---|---|---|---|---|
| Awake | Sedation 15′ | Awake | Sedation 15′ | |||
| S1 | 27 | m | 163 | 60 | 1 | 0 |
| S2 | 31 | f | 104 | 20 | 4 | 15 |
| S3 | 31 | m | 368 | 184 | 2 | 1 |
| S4 | 26 | f | 305 | 12 | 3 | 6 |
| S5 | 26 | f | 42 | 6 | 0 | 6 |
| S6 | 24 | f | 234 | 0 | 4 | 7 |
| S7 | 23 | m | 226 | 76 | 6 | 0 |
| S8 | 25 | m | 65 | 37 | 0 | 10 |
| S9 | 28 | m | 362 | 0 | 6 | 6 |
| S10 | 47 | f | 100 | 36 | 2 | 2 |
| S11 | 28 | f | 115 | 4 | 3 | 45 |
| S12 | 25 | m | 145 | 10 | 1 | 3 |
| S13 | 30 | f | 34 | 28 | 24 | 8 |
| S14 | 33 | f | 85 | 185 | 0 | 5 |
| S15 | 42 | f | 119 | 107 | 0 | 5 |
In two volunteers, the images of the second fMRI measurement had to be discarded due to movement artefacts. At this second measurement (45 min after drug administration) the number of positively correlating pixel was still slightly lower than was observed in the awake condition (T + = 84; N = 13; p = 0.002). In three out of our 15 volunteers, a small negatively correlated BOLD signal could be observed at 15 min after pentobarbital sedation as shown by the example in Figure 1B. These three subjects showed a clear positive signal during the pre‐sedation period and 45 min after sedation but had the highest relative sedative dosage in relation to their body weight. Two of them had the lowest body weight of 50 kg and, for the third subject (PJ, one of the authors), a double dose (300 mg) of pentobarbital had been administered at his own request.
In general, there were more negatively correlating pixels observed in the calcarine sulcus 15 min after sedation (see Table II), but the numbers just failed to reach significance (T + = 23.5; N = 13; p = 0.06). No significant differences in the number of negatively correlating pixels was observed 45 min after pentobarbital administration compared to the awake state (T + = 44, N = 13, p = 0. 3667). Table II shows the number of positively and negatively activated pixels 15 min and 45 min after injection in all subjects.
DISCUSSION
During both the awake and the sedated state, the subject was presented with a passive visual stimulation task. Clearly, once the sedative agent started to take effect, the subject is no longer able to consciously perceive the stimulus. It is therefore a legitimate question to ask what aspect of perception is most strongly affected by the presence of the sedative agent? Can any stimulation during the awake and the sedated state be considered comparable in any way? The simple answer to these questions is that the answer is not known and we do not wish to engage in speculation. In our investigation, we employed a visual stimulation paradigm in order to examine the responses of the cortical visual area V1. Striate cortex (V1) certainly represents an important cortical area in visual processing leading to conscious perception of a visual stimulus. The processing steps within V1 are not in any way subject to conscious inspection or control. Consequently, it is not unreasonable to presume that the processing occurring in area V1 when the subject is conscious or unconscious is the same.
Our main observations were that 15 min after injection of pentobarbital, we observed both a significant reduction in the signal strength and a reduction in the number of positively correlating pixels in the primary visual area (V1). At 45 min after the administration of pentobarbital, the signal strength had returned to normal but the number of positively correlating pixels was still down compared to the awake state. Whereas Figure 1A shows no correlation between the percent signal change and the subject's body weight, Figure 1B demonstrates a significant correlation between the relative dose of pentobarbital and the percent signal change. Examining Figure 2, we can see that as pentobarbital took effect, the positive BOLD contrast signal became weaker and finally vanished altogether—at the point where the action of the sedative agent was strongest the subject displayed a negative BOLD contrast signal. As the effects of the sedative agent wore off, the positive BOLD contrast signal then reappeared. Interestingly enough, as the BOLD response changed from positive to negative, the locus of the signal shifted from a medial and posterior to a more lateral and anterior location. This shift in locus is very similar to the one we observed between children and infants [Martin et al., 1999]. The locus of the negative BOLD contrast signal no longer falls within the boundary of area V1. Anatomical features references indicate that the stripe of Genari, the distinguishing feature of area V1, is not observed in dorsal sections at such an anterior position. The negative BOLD contrast signal observed with in the three cases with the highest relative dosages therefore originates from beyond area V1.
Figure 2.
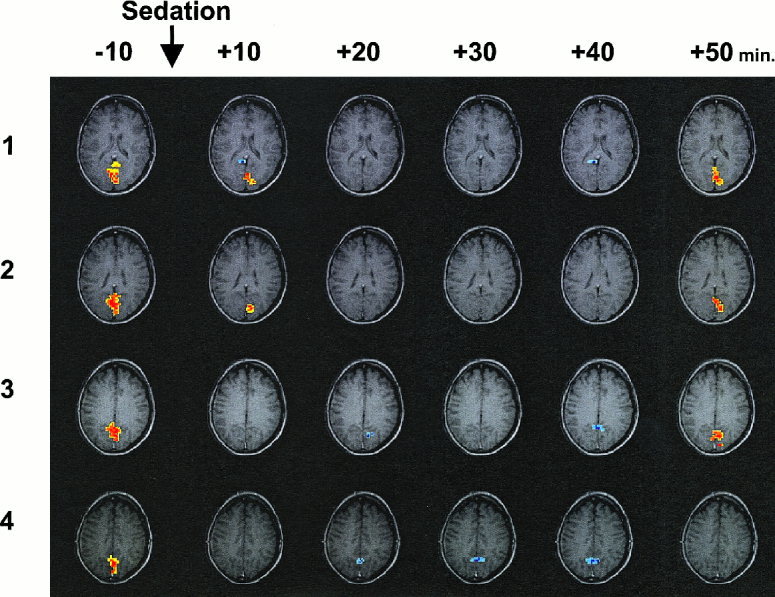
The figure depicts a time series of four slices through the visual cortex of our subject No. 11. The four images arranged in a column represent the activity pattern at the time point specified in minutes on the top of the column. The series shows that the initially positive BOLD signal was lost and gave way to a negative BOLD signal as the pharmacological effect of pentobarbital peaked around 20 min after injection. By the end of the experiment, 50 min after injection, the positive signal once again returned.
Examining a possible effect of gender, we found that the point of intersection on the x‐axis (relative dose) differed for the two sexes; the slopes were identical. This can be accounted for by the fact that the women weighed less than the men and always received a higher relative dosage.
In order to understand our results, a more elaborate discussion on the origin of the BOLD contrast signal, as an indicator of neuronal activity is necessary. The BOLD contrast can be considered as a product of two antagonistic factors, cerebral metabolic rate of oxygen (CMRO2) and ICBF [Sokoloff, 1981]. When neurons become active, they increase their consumption of both glucose and oxygen. Locally, therefore, the concentration of lactate increases due to an increase in CMRGluc [Prichard et al., 1991]. At the same time, the rate of O2 consumption change increased the local ratio of HbOxy/HbDeoxy in favour of HbDeoxy. In a given measurement volume, the ratio HbOxy/HbDeoxy becomes smaller because the concentration of HBDeoxy becomes larger. The higher the concentration of HbDeoxy, the more paramagnetic the local volume becomes, which in turn will lead to a destruction of the magnetic signal in that region. In the absence of any vascular change, this change in the HbOxy/HbDeoxy ratio would manifest itself as a reduction in magnetisation and in turn in a negative BOLD contrast signal change during stimulus presentation.
In the normal course of events, the increase in CMRGluc together with the increase in CMRO2 will result in an increase of local blood flow [Fox and Raichle, 1986; Kuschinsky et al., 1978]. This increase in ICBF will bring more oxygen‐rich blood to the active region. Measurements of ICBF have shown that the increase in ICBF is in excess of the volume required to redress the balance of HbOxy/HbDeoxy back to its resting value. This phenomenon is referred to as “luxury perfusion” [Fox and Raichle, 1986] but may also be a necessary physiological reaction to supply the activated neurons with the oxygen needed [Buxton and Frank, 1997; Kuchinsky, 1991]. The increase in ICBF, therefore, raises the HbOxy/HbDeoxy ratio in favour of HbOxy, because it increases the concentration of oxygen in a given measurement volume. This in turn renders the local blood volume more diamagnetic and so increases our signal from this region, and thus renders a positive BOLD contrast signal change during stimulus presentation.
To summarise our discussion, the presence of a negative BOLD contrast signal under the influence of sedation indicates an insufficient vascular response to cope with a higher oxygen demand. The presence of a positive BOLD contrast signal however indicates a physiological vascular response. In those cases where there is no apparent change in the BOLD contrast signal, we believe that the response of the vascular system may have been sufficient to compensate more or less exactly for the oxygen extracted and so return the ratio HbOxy/HbDeoxy to its resting level.
CONCLUSIONS
We showed that the administration of the sedative agent reduced or abolished the physiological vascular response in all subjects. This reduction in vascular response itself depended on the relative dosage of the sedative. We found a significant reduction in the number of positive correlating pixels following administration of pentobarbital. The suppression of the vascular response was strongest in three subjects, but was present in all subjects to varying degrees. In the majority of cases, the change in ICBF was influenced by the presence of pentobarbital to such an extent that it hid the cortical activity from investigation by fMRI. Only when the dosage becomes sufficiently high to completely inhibit the vascular response and thus abolish the “luxury perfusion” will the neuronal activity again become visible to fMRI investigation as a negative BOLD contrast signal. The presence of three subjects with a negative BOLD contrast signal change, those with the highest relative sedative dosage, implies that pentobarbital affected ICBF more strongly than CMRO2.
ACKNOWLEDGMENTS
We would like to thank Dr. Guido Gerig and Dr. Gabor Szekely from the Swiss Federal Technical University Zurich, Switzerland, for their cooperation in postprocessing.
REFERENCES
- Bandettini PA, Jesmanowicz A, Wong EC, Hyde JS (1993): Processing strategies for time‐course data sets in functional MRI of the human brain. Magn Reson Med 30: 161–173. [DOI] [PubMed] [Google Scholar]
- Buxton RB, Frank LR (1997): A model for the coupling between cerebral blood flow and oxygen metabolism during neural stimulation. J Cereb Blood Flow Metab 17: 64–72. [DOI] [PubMed] [Google Scholar]
- Chi OZ, Ryterband S, Field C (1989): Visual evoked potentials during thiopentone‐fentanyl‐nitrous oxide anaesthesia in humans. Can J Anaesth 36: 637–640. [DOI] [PubMed] [Google Scholar]
- Fox P, Raichle ME (1986): Focal physiological uncoupling of cerebral blood flow and oxidative metabolism during somatosensory stimulation in human subjects. Proc Natl Acad Sci USA 83: 1140–1144. [DOI] [PMC free article] [PubMed] [Google Scholar]
- Fox PT, Mintun MA, Raichle ME, Miezin FM, Allman JM, Van Essen DC (1986): Mapping human visual cortex with positron emission tomography. Nature 323: 806–809. [DOI] [PubMed] [Google Scholar]
- Kety S, Woodford R, Harmel M, Freyhan F, Appel K, Schmidt C (1947): –48): Cerebral blood flow and metabolism in schizophrenia. The effect of barbituratie semi‐narcosis, insulin coma and electroshock. Am J Psychiat 104: 765–770. [DOI] [PubMed] [Google Scholar]
- Kuschinsky W (1990): Coupling of blood flow and metabolism in the brain. Basic Clin Physiol Pharmacol 1: 191–201. [DOI] [PubMed] [Google Scholar]
- Kuschinsky W (1991): Physiology of cerebral blood flow and metabolism. Arzneimittel‐Forschung 41: 284–288. [PubMed] [Google Scholar]
- Kuschinsky W, Wahl M (1978): Local chemical and neurogenic regulation of cerebral vascular resistance. Physiol Rev 58: 656–689. [DOI] [PubMed] [Google Scholar]
- Kwong K, Belliveau J, Chesler D, Goldberg I, Weisskoff R, Poncelet B, Kennedy D, Hoppel B, Cohen M, Turner R, Cheng H, Brady T, Rosen B (1992): Dynamic magnetic resonance imaging of human brain activity during primary sensory stimulation. Proc Natl Acad Sci USA 89: 5675–5679. [DOI] [PMC free article] [PubMed] [Google Scholar]
- Lindauer U, Villringer A, Dirnagl U (1993): Characterization of CBF response to somatosensory stimulation: model and influence of anesthetics. Am J Physiol 264: H1223–H1228. [DOI] [PubMed] [Google Scholar]
- Loenneker T, Hennel F, Hennig J (1996): Multislice interleaved excitation cycles (MUSIC): an efficient gradient‐echo technique for functional MRI. Magn Reson Med 35: 870–874. [DOI] [PubMed] [Google Scholar]
- Lou HC, Edvinsson L, MacKenzie ET (1987): The concept of coupling blood flow to brain function: revision required? Ann Neurol 22: 289–297. [DOI] [PubMed] [Google Scholar]
- Martin E, Joeri P, Loenneker T, Ekatodramis D, Vitacco D, Hennig J, Marcar V (1999): Visual processing in infants and children, using functional magnetic resonance imaging. Ped Res (in press). [DOI] [PubMed] [Google Scholar]
- Nilsson L, Siesjö BK (1975): The effect of pentobarbitone anaesthesia on blood flow and oxygen consumption in the rat brain. Acta Anaesth Scand Suppl. 57: 18–24. [DOI] [PubMed] [Google Scholar]
- Ogawa S, Lee TM, Kay AR, Tank DW (1990): Brain magnetic resonance imaging with contrast dependent on blood oxygenation. Proc Nat Acad Sci USA 87: 9868–9872. [DOI] [PMC free article] [PubMed] [Google Scholar]
- Posner MI, Raichle ME (1998): The neuroimaging of human brain function. Proc Natl Acad Sci USA 95: 763–764. [DOI] [PMC free article] [PubMed] [Google Scholar]
- Prichard J, Rothman D, Novotny E, Petroff O, Kuwabara T, Avison M, Howseman A, Hanstock C, Shulman R (1991): Lactate rise detected by H‐1 NMR in human visual cortex during physiologic stimulation. Proc Natl Acad Sci USA 88: 5829–5831. [DOI] [PMC free article] [PubMed] [Google Scholar]
- Purves MJ (1978): Control of cerebral blood vessels: present state of the art. Ann Neurol 3: 377–383. [DOI] [PubMed] [Google Scholar]
- Raichle ME, Grubb RL, Jr ., Gado MH, Eichling JO, Ter‐Pogossian MM (1976): Correlation between regional cerebral blood flow and oxidative metabolism. In vivo studies in man. Arch Neurol 33: 523–526. [DOI] [PubMed] [Google Scholar]
- Roy C, Sherrington C (1890): On the regulation of blood supply of the brain. J Physiol 11: 85–108. [DOI] [PMC free article] [PubMed] [Google Scholar]
- Sokoloff L (1981): Relationships among local functional activity, energy metabolism, and blood flow in the central nervous system. Fed Proc 40: 2311–2316. [PubMed] [Google Scholar]