

Abstract
Active listening has been reported to elicit a different sensory response from passive listening and is generally observed as an increase in the magnitude of activation. Sensory activation differences may therefore be masked by the effect of attention. The present study measured activation induced by static and modulated tones, while controlling attention by using target‐discrimination and passive listening tasks. The factorial design enabled us to determine whether the stimulus‐induced activation in auditory cortex was independent of the information‐processing demands of the task. Contrasted against a silent baseline, listening to the tones induced widespread activation in the temporal cortex, including Heschl's gyrus (HG), planum temporale, superior temporal gyrus (STG), and superior temporal sulcus. No additional auditory areas were recruited in the response to modulated tones compared to static tones, but there was an increase in the response in the STG, anterior to HG. Relative to passive listening, the active task increased the response in the STG, posterior to HG. The active task also recruited regions in the frontal and parietal cortex and subcortical areas. These findings indicate that preferential responses to the changing spectro‐temporal properties of the stimuli and to the target‐discrimination task involve distinct, non‐overlapping areas of the secondary auditory cortex. Thus, in the present study, differences in sensory activation were not masked by the effects of attention. Hum. Brain Mapping 10:107–119, 2000. © 2000 Wiley‐Liss, Inc.
Keywords: audition, fMRI, modulation, target discrimination, anterior superior temporal gyrus
INTRODUCTION
In developing fMRI as a tool to study central auditory function, it is desirable to quantify the nature of both stimulus‐ and task‐related effects on the response that is being measured, as well as to characterise the degree of interaction between stimulus and task. For example, auditory imaging seeks not only to identify the response selectivity of distinct regions, but also to characterise the nature of the stimulus (or task) manipulations that modulate the cortical response in that region. Because tasks that require selective attention may generate more activation than passive listening tasks, investigations of sensory processing need to vary attention and to document stimulus effects that do and do not vary with attention or other aspects of the task. It is also necessary to control carefully for stimulus aspects such as sound level or bandwidth that influence the magnitude or extent of the response, particularly when differential responses within the same functional region are being measured. Stimulus type and intensity are known to affect the magnitude of the response [e.g., Jäncke et al., 1998; Strainer et al., 1997; see also Binder, 1995], but the extent to which response pattern and magnitude vary with spectro‐temporal modulation are, as yet, unclear.
Stimulus‐related activation
A number of studies suggest that subtle changes in the acoustical stimulus change the pattern of activation at the cortical level suggesting that there is a mapping between function and anatomy. Rauschecker and his colleagues [see Rauschecker, 1998 for review], on the basis of primate neurophysiology and human imaging studies, have proposed a hierarchical model for auditory cortical processing. Rauschecker proposes separate processing streams for information related to the spatial aspects of the stimulus and its spectro‐temporal pattern (“where” and “what” pathways). The spatial pathway is hypothesised to arise in the postero‐medial cortical field on the supratemporal plane and derives its input from the primary auditory field. The pattern pathway arises in the lateral belt (situated antero‐laterally on the supratemporal plane and overlapping onto the STG) and derives its input from the anterior and primary cortical areas. Evidence for the lateral belt involvement in pattern processing comes from primate physiology, which has demonstrated that cells in this area respond more strongly to noise bands than to pure tones and are sensitive to frequency modulation and species‐specific vocalisations [Rauchecker, 1997; Rauschecker et al., 1995, 1997].
Imaging studies of human auditory processing are consistent with the view that areas on the supratemporal plane of the STG participate in hierarchical pattern processing beyond auditory analysis in the primary area. For example, in this hierarchy, static signals elicit responses predominantly in primary auditory regions and modulated signals elicit responses in secondary auditory regions of the STG. Using fMRI, frequency‐glides have been shown to activate bilateral anterior regions of STG [Schlosser et al., 1998]. Preliminary evidence from PET also suggests that bilateral anterior STG shows an increased response to frequency‐modulated (FM) tones compared with static tones, even when both types of stimuli are broadband [Thivard et al., 1998; see also Boddaert et al., 1998]. The PET data also revealed a greater response to FM tones in the left hemisphere. Cerebral asymmetries may be related to left hemisphere specialisation for processing spectral changes required during speech perception [see Johnsrude et al., 1997]. We speculate that the anterior region of the secondary auditory cortex may respond not only to FM but also to different types of modulation, such as amplitude modulation. The anterior area may also respond to sounds whose spectro‐temporal pattern changes over time, without those patterns necessarily having to change regularly as they do when stimuli are modulated sinusoidally. However, this interpretation awaits further confirmation.
Task‐related activation
Evidence from neuroimaging has shown that selective attention to auditory stimuli can increase both the magnitude and extent of the haemodynamic response within regions of auditory cortex [e.g., Grady et al., 1997; Woodruff at al., 1996]. For example, counting occurrences of a target word in a list increased the extent and magnitude of activation in the primary and surrounding auditory areas, relative to simply listening to the word list without response [Grady et al., 1997]. In a task that involved either attending to auditory or visual items that were simultaneously presented, Woodruff et al. found a relative increase in the extent of activation in regions of the STG (BA 22 and 42) when subjects were instructed to attend to the auditory stimulus. Some studies have failed to replicate the increase in auditory activation with attention [e.g., Frith and Friston, 1996; Tzourio et al., 1997] suggesting that enhancement of the sensory response due to attention may depend on the perceptual load of the attention task and on the nature of the attentional processes that are elicited by the baseline task. For example, Tzourio et al. used the same type of tone sequence in both conditions. Subjects were instructed to respond to the deviant tone in the active listening condition and ignore targets in the passive listening condition, thus requiring the suppression of attention to the targets when instructed to listen passively.
When an increase in sensory activation with attention is observed, attention also appears to activate many different brain regions. For example, Pugh et al. [1996] have measured activation increases in a dichotic listening task relative to a diotic listening task. The listening tasks required subjects to distinguish the speech syllable “ba” from “da” and to distinguish a rising tone from a falling tone. In the diotic condition, the same stimulus was presented to the two ears. In the dichotic condition, speech was presented to one ear and tones to the other ear so this task required selective listening to one stimulus type while ignoring the other. Relative to diotic listening, dichotic listening increased activation in the superior temporal region of auditory cortex (BA 22), in the inferior and superior parietal regions, inferior frontal regions, and the precuneus.
The effects of attention in sensory regions might suggest that attention serves to control sensory “gain.” Indeed, Roland [1993] proposed that, at a local level, attention may tune receptive neurones in sensory cortex in anticipation of a stimulus event by increasing the number of excitatory postsynaptic potentials. Specialised areas of the frontal and parietal cortex may be involved in the neural network that mediates such sensory amplification effects [Posner and Dehaene, 1994; Posner and Peterson, 1990; Posner and Presti, 1987]. A large body of work has investigated the source of general modulatory attention effects in the visual modality and evidence from other sensory domains converges to suggest that some areas are multimodal [see Roland, 1993 for a review]. In general, the “posterior attention system”—including the inferior and superior parietal cortex and superior colliculus—seems to be involved in controlling the perceptual aspects of attention, such as shifting the attentional “ spotlight” and engaging attention with particular aspects of the sensory input, thus mediating any consequent changes in sensory processing [Corbetta et al., 1995; Posner and Dehaene, 1994; Posner and Peterson 1990; Posner and Presti 1987]. The “anterior attention system”—including the cingulate gyrus—is more strongly implicated in controlling the allocation of directed attentional resources, for example when attention is divided across multiple attributes of stimuli [e.g., Corbetta et al., 1991]. The anterior attention system is also active during focusing of attention and in maintaining attention towards targets during vigilance tasks [e.g., Menon et al., 1997; Roland, 1993].
The present study
The study employed a 2 × 2 factorial design. It investigated the effects of spectro‐temporal modulation on the auditory MR response and evaluated differences in the patterns of activation between a passive listening and a target‐discrimination task. If the auditory system is hierarchically organised [as proposed by Rauschecker, 1998], then areas of secondary auditory cortex should show a preferential response to modulated tones compared to static tones, possibly in anterior regions of the STG. The discrimination task involved identifying infrequent target tones (oddballs) with reference to a frequent tone. The target changed repeatedly between relatively short blocks of trials and so arguably this procedure required a particularly high level of sustained attention. We predict that, by placing demands on auditory attention, the target‐discrimination task would increase the magnitude of response auditory cortex, relative to the passive listening task, as well as producing activation within regions of the anterior and posterior attention systems. This pattern of activation should be obtained for both stimulus conditions. In addition, there are several grounds for expecting an interaction between stimulus and task, although it may not always be obvious in which direction to predict. For example, if modulation strongly increases the auditory response, then the opportunity for enhancement by attention may be reduced, assuming that the response saturates. Conversely, if modulated tones induce more widespread auditory activation than static tones, the opportunity for further enhancement of activation (for example, as given by the extent of activation) may be increased by attention.
MATERIALS AND METHODS
Subjects
Seven right‐handed volunteers, aged between 18 and 48, participated in the study. Subjects had no history of neurological or auditory impairment and were not on any medication. Prior to the imaging session, the hearing sensitivity of subjects was measured using pure‐tone audiometry. The hearing thresholds of all subjects fell within the normal range (less than or equal to 20 dB HL) at octave frequencies between 500 and 8000 Hz inclusive.
Stimuli
Two pairs of acoustical stimuli were synthesised digitally at a sampling rate of 48,000 samples/s with 16‐bit quantisation. Each stimulus was 800 ms in duration including 20‐ms onset and offset ramps shaped by inverted cosine functions in order to avoid audible clicks due to transients. One pair of stimuli consisted of two pure tones (i.e., static tones of fixed frequency). Their frequencies were 500 Hz and 900 Hz.1 The other pair consisted of modulated tones. The amplitude‐modulated (AM) tone was generated by sinusoidally modulating a 900‐Hz tone at 6 Hz with an amplitude range of +/−32% (in linear units). The frequency‐modulated (FM) tone was generated by sinusoidally modulating a 900‐Hz tone at 6 Hz with a frequency range of +/−12% (792–1008 Hz). These parameters were chosen so that the two static tones were readily discriminable from one another, likewise the two modulated tones. The tone frequencies and rates and depths of modulation are within the ranges encountered in speech.
Stimuli were presented diotically to listeners using a specially‐engineered PC‐based sound system, in which electrostatic headphones (for high‐fidelity signal transduction) are combined with Bilsom industrial ear defenders (for passive attenuation of the scanner noise) [Palmer et al., 1998]. Peak presentation levels at each ear over the duration of the stimuli were 89 dB SPL for the static tones and 86 dB SPL for the modulated tones. Levels were measured by placing the headphones on a Knowles Electronics Manikin for Acoustic Research (KEMAR) feeding a Bruel and Kjaer measuring amplifier, Type 2636, using “fast” root‐mean‐square level averaging (integration time of 125 ms).
Imaging protocol
The study was performed on a dedicated echo‐planar imaging (EPI) 3 Tesla scanner with purpose‐built head gradient coils and a birdcage radio‐frequency receiver coil [Bowtell et al., 1994]. Subjects lay supine in the scanner with their head restrained using foam wedges and two inflatable airbags. Functional images were acquired using a T2*‐weighted MBEST sequence (TE = 36 ms). A volume of images was acquired every 11 s at the end of each stimulus epoch using a clustered‐volume acquisition sequence which permitted the acquisition of 16 images in 1072 ms. We have termed this method temporally sparse imaging [Hall et al., 1999]. Sparse imaging reduces the effect of the scanner noise on the magnitude of detected activation firstly by using a long TR to reduce the effect of noise from one volume acquisition to the next [see Hall et al., 1999], and secondly by using clustered‐volume acquisition to reduce the effect within a volume [see Edmister et al., 1999]. Sparse imaging primarily reduces interference from scanner noise because a volume of images is acquired only after the effective stimulus epoch and near to the plateau of the haemodynamic response to the acoustical stimulus of interest. It also reduces the number of images acquired per cycle and hence the number and rate of occurrence of the bursts of scanner noise. The technique is effective for auditory fMRI as it ensures that the haemodynamic response depends on the stimulus alone and not on any interaction with the additional processing effort required to “filter out” background simultaneous scanner noise.
The image matrix contained 128 × 128 elements and the voxel resolution was 3‐ by 3‐mm in‐plane, with an 8‐mm slice thickness. A volume consisted of 16 contiguous coronal slices that covered the whole brain region, apart from the poles of the frontal and occipital cortex and cerebellum. Volumes were acquired at 241 time points across the 44‐min experimental period.
Task
Four conditions were defined by crossing the two requirements for attention (passive listening and target‐discrimination) with the two types of stimuli (static tones and modulated tones). In each condition, the stimulus epoch lasted 10 sec and consisted of a sequence of ten stimuli, each separated by 200‐msec periods of silence. In the target‐discrimination conditions, one member of each stimulus pair was designated the target and the other the reference tone. Targets and reference tones were presented in a random sequence with a ratio of targets to reference tones of 1:4. All four assignments of stimuli were included in the experiment in a counterbalanced order (modulated tones with FM target, modulated tones with AM target, static tones with 500‐Hz target and static tones with 900‐Hz target). So that the subjects could know which stimulus was the target in each epoch, the first two stimuli in an epoch were always reference tones. Thus, in a condition involving the modulated stimuli where the FM stimulus was the target, the ordering of the ten stimuli in a stimulus epoch might be: AM, AM, FM, AM, AM, AM, AM, AM, FM, AM. Subjects were instructed to press a button with the index finger of their right hand whenever a target was presented. The sound system logged the times of occurrence of targets and button presses for off‐line analysis.
In the passive‐listening conditions, the stimulus sequence within each epoch alternated between the members of the stimulus pair. Thus, in a condition involving the static tones, the sequence might be: 900, 500, 900, 500, 900, 500, 900, 500, 900, 500 Hz. The reverse order (500, 900, 500…) was included in the experiment along with both orders of the modulated stimuli. These four conditions were presented in a counterbalanced order. Subjects were instructed to listen to the stimuli, but to make no response. We acknowledge that the stimulus sequence may be confounded with the task instructions. At a general level, confounding between stimulus and response task characteristics reflects the fact that many stimuli go together naturally with particular tasks and so their effects cannot easily be separated without loss of task naturalness. In requesting the subject to respond to salient variations in the stimulus sequence, stimulus response compatibility is controlled in the target‐discrimination task. The reason for alternating stimuli in the passive‐listening task, rather than presenting the same random orders that were employed in the target‐discrimination task, was to prevent subjects from inadvertently attending to targets when instructed to listen passively.
There was a fifth condition (resting baseline), during which no acoustic stimulation was delivered through the headphones. Because image acquisition only occurred at the end of each epoch, this baseline condition was silent apart from random noise and low‐frequency hum due to the air‐conditioning and the power‐transformers for the room lights. The level of this background noise was 72 dB SPL in the centre of the RF coil. Its level at the subjects' ears would have been about 40 dB SPL after attenuation by the ear defenders.
The four stimulus conditions were randomly interleaved, with the resting baseline appearing at every fifth point in the experimental cycle. A small light within the subjects' field of view was illuminated for the duration of the concurrent epoch to indicate that target discrimination was required. The five conditions were each presented 48 times, thus giving 240 epochs in total.
Image analysis
Image analysis was performed on a Sun Ultra 2 computer (Sun Microsystems) using SPM99 software [Friston et al., 1995a; http://www.fil.ion.ucl.ac.uk/spm] running in MATLAB v5.3 (Mathworks Inc, Natick, MA, USA) to test the significance of the main effects and interactions on a voxel‐by‐voxel basis. The first volume of images of each time‐series was acquired before the onset of the first stimulus epoch to enable accurate synchronisation of the stimulus with image acquisition. These images were discarded prior to statistical analysis. For each subject, the 240 remaining volumes of images were realigned to the average image to correct for 3‐dimensional movement of the head between image acquisitions. Image realignment involved determining the values for a 6‐parameter, rigid‐body, affine transformation that minimised the sum of squared differences between the reference image (the mean image for the time‐series) and each of the images in the experimental sequence [Friston et al., 1995b]. Realigned images were then spatially transformed into a standard brain space and voxels were re‐sampled to a size of 2 × 2 × 4 mm. This procedure involved a nine‐parameter affine transformation, followed by nonlinear deformations using discrete cosine transform basis functions that matched each scan to an EPI template using a least‐squares algorithm [Friston et al., 1995b]. The brain template was defined in a space specified by the Montreal Neurological Institute [Evans et al., 1993]. The normalised images were spatially smoothed using a Gaussian kernel of 6 × 8 × 6 mm full‐width‐at‐half‐maximum to improve the signal‐to‐noise ratio of the data and to condition the statistical output to approach a lattice approximation of a continuous, stationary, random field. Image data were not temporally smoothed, due to the long TR interval between data acquisitions. Low frequency artifacts, corresponding to aliased respiratory and cardiac effects and other cyclical variations in signal intensity, were removed by high‐pass filtering the time series using cosine basis functions up to a maximum frequency of half a cycle per minute.
The image data for the six subjects were analysed using a multi‐subject, fixed‐effects model. This technique computes the fit of the MR signal, for each subject, to a covariate that describes the stimulation paradigm. In this experiment, the MR signal was analysed using a set of five simple square‐wave functions (one for each condition) where the data points for the condition fell onto the maxima of the square‐wave. Subtractions between conditions were performed to investigate the effects of stimulus and task and these were specified using different combinations of linear contrasts. Contrasts specifying the interaction between independent variables were also entered in the analysis. The activation maps were corrected for multiple correlated t statistics (to give a corrected threshold of P<0.05) and the resulting SPM{t} maps are reported. The activation was tested for significance using a combined test for spatial extent and peak height [Poline et al., 1997]. Unless otherwise stated, all activation maps presented were thresholded using this procedure.
Regions of activation were identified with reference to anatomical landmarks by overlaying the activation maps onto a T1‐weighted image that had been transformed into the same brain space as the functional images. Within this stereotaxic space, the position of HG on the anatomical image fell acceptably within the 25–50% probability contours of the 3D coordinates for HG reported by Penhune et al. [1996] and that are also in the same brain space.
RESULTS
Behavioural analysis
Six of the seven subjects discriminated targets with an average accuracy of 91.8% correct (SD = 9.5%). The seventh subject performed materially more poorly at only 70% correct. This level of compliance with the instructions was judged to be unacceptable, and the fMRI data from this subject were excluded from the analysis.
fMRI results
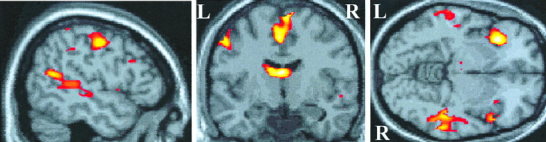
As a first step, each of the four stimulus conditions was compared with the resting baseline in a subtraction analysis. All four conditions produced significant activation bilaterally in the STG and superior temporal sulcus. Activation was seen in HG and anteriorly along the STG, but was largely posterior to HG, along the planum temporale and the STG (Fig. 1). In all conditions, there was a greater extent of activation in the left than in the right hemisphere (25.5 cm3 and 22.0 cm3, respectively). The passive‐listening and target‐discrimination tasks activated overlapping regions of auditory cortex, but the active task produced additional activation in other regions including frontal and parietal cortex, anterior cingulate gyrus, thalamus, anterior insula and pre‐ and post‐central gyri (Fig. 1B).
Figure 1.
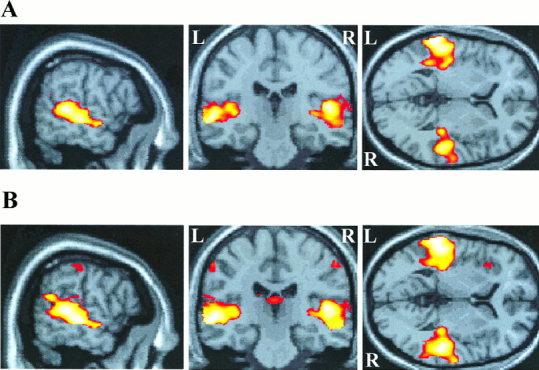
Superior temporal cortex activation during (A) passive listening to modulated tones, and (B) active listening to modulated tones, both relative to the resting baseline condition. Activation is projected onto sagittal, coronal and axial planes through the point in standard brain space corresponding to −58, −24, 4 mm in the x, y, z planes. The sagittal plane shows bilateral activation along the superior temporal gyrus and superior temporal sulcus, extending anteriorly and posteriorly beyond Heschl's gyrus. Both (A) and (B) show that the volume of temporal activation is greater on the left side in both passive and active conditions. Only active listening produced activation in other brain regions, including bilateral post‐central gyrus and left insula cortex shown here.
A significant regionally‐specific interaction between stimulus and task would indicate context‐sensitivity of the effects and a degree of integration of the two processes. However, in the present study, no brain region showed any statistically reliable interaction between stimulus and task. We can interpret this absence of either a stimulus‐contingent task effect or an attention‐contingent stimulus effect as an independence between the activation effects of stimulus and task.
Effect of modulation
The static and modulated conditions were first compared by distinguishing voxels that were activated exclusively in one condition or the other from voxels that were activated in common in both conditions (Fig. 2). The general pattern of auditory activation for the static and modulated tones was the same in that both activated common regions of temporal cortex and both showed a greater activation in the left hemisphere.
Figure 2.
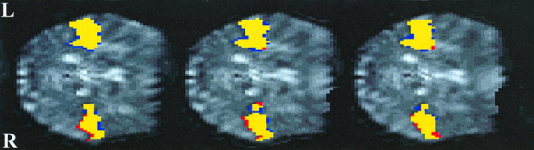
Contiguous axial slices showing the relative distribution of activation during passive listening to static and modulated tones, contrasted against resting baseline. Activation maps are superimposed onto the mean normalised functional image through the superior temporal cortex. Yellow represents voxels that are significantly activated by both modulated and static tones during passive listening (P<0.001). Red denotes voxels that are significantly activated by static tones alone, whereas blue denotes voxels activated by modulated tones alone. There is a very close correspondence between the two activation patterns.
The main effect of modulation was also calculated statistically using a conjunction analysis (Price and Friston, 1997). In contrast to the interaction analysis, this analysis sought to achieve generalisation by delimiting the voxels displaying context‐insensitive responses to stimulus modulation. In the present analysis, voxels were identified that were significantly more activated by modulated tones than by static tones, irrespective of the listening task. In other words, voxels were sought that displayed significant differences when activation induced by static tones was subtracted from activation induced by modulated tones, and that were in common for both passive‐listening and target‐discrimination tasks. The resulting activation (Fig. 3) was displayed using a threshold of P<0.001, but was not corrected for multiple comparisons because activation differences were only expected to occur within the region of STG and superior temporal sulcus shown in Figure 1. HG itself did not exhibit any preferential responses to tone modulation, but modulated tones produced significantly greater activation than static tones in a region of secondary auditory cortex, particularly a region of STG that was anterior and inferior to HG (see Table I). Following the general pattern of asymmetry, the effect was larger on the left side (2.4 cm3), where the activation formed a medio‐lateral shaped belt. The effect was smaller on the right side (0.7 cm3) and formed a supero‐inferior shaped belt. This anterior region of the STG was activated in all four listening conditions when contrasted with the resting baseline and so the effect of tone modulation is one of signal magnitude, rather than extent. A subsequent conjunction analysis showed that was no preferential activation to the static tones relative to the modulated tones.
Figure 3.
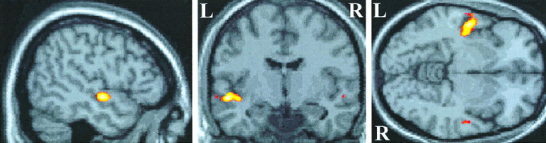
Location of preferential activation induced by modulated tones compared with static tones. Activation is projected onto sagittal, coronal, and axial views of a canonical T1‐weighted image through the point in standard brain space corresponding to −50, −8, −6 mm in the x, y, z planes. Activation is anterior and inferior to Heschl's gyrus on the superior temporal gyrus and is predominantly left‐sided.
Table I.
Main effects of modulation and listening task on cortical activation. Coordinates and T values are reported for the peak voxels of activation located in the auditory cortex (including the anterior area, planum temporale, superior temporal sulcus and anterior insula) and other cortical regions
| Cortical area | Coordinates (mm) | Coordinates (mm) | ||||||
|---|---|---|---|---|---|---|---|---|
| x | y | z | T value | x | y | z | T value | |
| Modulated vs. static tone | ||||||||
| Anterior area | −50 | −8 | −6 | 4.09 | 54 | −12 | −2 | 2.50 |
| Target discrimination vs. passive listening | ||||||||
| Planum temporale | −58 | −52 | 18 | 4.33 | 46 | −28 | 8 | 3.14 |
| Superior temporal sulcus | −58 | −28 | 0 | 3.09 | 52 | −40 | 0 | 5.20 |
| Inferior parietal cortex | −44 | −48 | 60 | 2.60 | 58 | −48 | 18 | 3.13 |
| Superior frontal gyrus | 0 | 0 | 48 | 6.49 | 2 | 0 | 58 | 5.76 |
| Middle frontal gyrus | −46 | −20 | 28 | 3.19 | 50 | 12 | 42 | 4.67 |
| Pre‐central gyrus | −50 | −8 | 44 | 3.22 | 54 | −16 | 44 | 1.95 |
| Post‐central gyrus | −56 | −24 | 42 | 3.70 | 50 | −20 | 44 | 2.64 |
| Cingulate gyrus | −2 | −28 | 26 | 2.05 | −2 | −32 | 26 | 2.76 |
| Thalamus | −12 | −20 | 0 | 3.41 | ||||
| Anterior insula | −36 | 20 | 0 | 5.34 | 34 | 24 | 0 | 3.65 |
Effect of task
The passive‐listening and target‐discrimination tasks were compared by again distinguishing voxels that were activated exclusively in one task or the other from voxels that were activated in common in both tasks (Fig. 4). For both static and modulated tones, the target‐discrimination task produced a greater posterior spread of activation along the superior temporal cortex compared with passive listening. The posterior spread was predominantly in the right hemisphere, with the right‐sided increase in activation reducing the volumetric asymmetry between left and right temporal activation. In the target‐discrimination task, the difference between left and right volumes was 0.7 cm3 (28.1 and 27.4 cm3, respectively) and in the passive listening task it was 6.4 cm3 (23.0 and 16.6 cm3, respectively).
Figure 4.
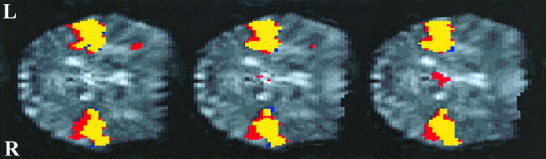
Relative distribution of activation during both active and passive listening to the static tones, contrasted against resting baseline. Activation maps are shown for contiguous axial slices superimposed onto the same mean normalised functional slices used in Fig. 2. Yellow represents voxels that are significantly activated by both active and passive listening (P<0.001). Red denotes voxels that are significantly activated by active listening alone, whereas blue denotes voxels activated by passive listening alone. Active listening induces a posterior spread of activation, particularly in the right superior temporal cortex. A similar distribution of relative activation was obtained for the modulated tones.
A conjunction analysis further investigated the presence of task effects that were relatively insensitive to the class of stimulus. In this context, the conjunction sought to identify areas that displayed significant differences when activation induced by passive listening was subtracted from activation induced by target discrimination and that were in common to both static and modulated tones (Fig. 5). Preferential responses to the target‐discrimination task were found bilaterally in areas of the STG undercutting HG and posterior to it in the planum temporale and superior temporal sulcus, but did not include HG. The posterior temporal activation also spread bilaterally into inferior parietal cortex, namely the supramarginal and angular gyri located along the terminal parts of the posterior ramus of the lateral fissure and superior temporal sulcus. Activation was also observed in other cortical and sub‐cortical sites (see Table I). There was bilateral frontal activation anterior to the pre‐central sulcus both laterally in the middle frontal gyrus and medially in the superior frontal gyrus. Regions of the somato‐motor system were also activated, namely a region posterior to the pre‐central sulcus on the pre‐central gyrus and a region posterior to the central sulcus on the post‐central gyrus. Activation in somato‐motor areas was bilateral but was greater on the left, probably because subjects were instructed to respond to targets by pressing the response button with their right index finger. Subcortical activation was observed in the cingulate gyrus bilaterally, in the left thalamus and in the anterior insula cortex. Insula activation was bilateral, but was greater on the left than on the right side.
Figure 5.
Location of preferential activation induced by the target‐detection task compared with the passive listening task. Activation is projected onto sagittal, coronal, and axial views of a canonical T1‐weighted image through the point in standard brain space corresponding to −50, −8, −6 mm in the x, y, z planes. This sagittal view shows temporal cortex activation posterior to Heschl's gyrus along the superior temporal sulcus. Activation due to active listening is also produced in other brain regions, including left pre‐central gyrus, superior frontal gyrus, thalamus, and insula cortex shown here.
DISCUSSION
The four listening conditions all activated primary and secondary auditory areas, including HG and anterior and posterior STG, including the planum temporale. For both static and modulated tones, activation in these regions of temporal cortex was greater in the left than in the right hemisphere, particularly for the passive listening condition. Previous auditory fMRI investigations of activation induced by tones have also found hemispheric asymmetries, although their reported directions have been inconsistent. Greater activation in the left hemisphere has been found during passive listening [Binder et al., 1994; Millen et al., 1995], but not always during active listening [e.g., Binder et al., 1995]. These results suggest that auditory analysis of even simple tonal sounds is sufficiently complex to mean that different tasks can draw on different processes. However, the finding of the present study that the left‐sided dominance was reduced in the target‐discrimination task relative to the passive listening task is in general agreement with the studies of Binder et al. [1994] and Millen et al. [1995].
The present results clearly showed evidence for effects of both modulation and listening task in different regions of the auditory cortex. Amplitude and frequency modulation increased activity predominantly in the anterior portion of the STG, suggesting that this area may be selectively responsive to modulated sounds, or at least to sounds whose spectro‐temporal properties change over time. The target‐discrimination task increased activation in posterior regions of the STG and also induced activation in frontal, parietal lobes, and midbrain sites that have previously been proposed to form a network [Posner and Dehaene, 1994; Posner and Peterson, 1990; Posner and Presti, 1987]. There was no significant interaction between stimulus and task. In fact, the results showed that the target‐discrimination task activated a region of STG that was distinct from and posterior to the area that responded preferentially to the modulation. The following sections discuss the two main effects in more detail.
Effect of modulation
The modulated tones preferentially activated bilateral regions of the anterior STG, part of the secondary auditory cortex. It is unlikely that the area is responsive to the low‐frequency AM since all stimuli were presented at a rate of one per second and so this aspect of the response was partialled out in the conjunction analysis. The anterior STG area was therefore most probably responsive to rates of change that were greater than 1 Hz. Furthermore, one cannot state conclusively that the area is selectively responsive to modulation per se. The key attribute of the modulated tones may not be that their spectro‐temporal pattern was changing periodically, but simply that it was changing over time. For example, the area might contain neurones that respond to decreases in (say) frequency, without the pattern of decreases over time having to be regularly repeated.
Modulated tones differed from the static tones both in their changing spectro‐temporal pattern and also in their bandwidth, because applying either frequency or amplitude modulation to a sound increases its bandwidth. For the AM stimuli, the bandwidth was equal to twice the modulation frequency (i.e., 12 Hz) and for the FM stimuli it was approximately equal to the total frequency range (i.e., 216 Hz). Thus, there are two possible interpretations for the modulation effect—either populations of neurones within secondary auditory cortex are selectively responsive to modulation per se, or populations of neurones are sensitive to the stimulus bandwidth. In nonhuman primates, neurones in the lateral belt are highly responsive to both FM sweeps and band‐pass noise [Rauschecker, 1998]. The lateral belt extends out from the supratemporal plane to the surface of the STG and is divided into three subregions along its anterior‐posterior axis [Kaas and Hackett, 1998], including an antero‐lateral area that may be homologous to the human anterior region of STG that selectively responded to modulation in this study. The bandwidth of the modulated tones used in the present study remained within one (AM) or two (FM) auditory filters, because, at 900 Hz, the bandwidth of the auditory filter is approximately 120 Hz [Glasberg and Moore, 1990]. Consequently, the modulated stimuli would not have excited the large number of auditory channels whose activation underlay the effect of bandwidth reported by Rauschecker [1998]. Even when bandwidth is matched across FM and static tone conditions [cf. Thivard et al., 1998], a region of anterior STG remains selectively responsive to the FM tone. Thus, on balance, the findings indicate that the region of the anterior STG is selectively responsive to modulation rather than to an increase in bandwidth.
The modulation effect was greater in the left STG than in the right. It has been hypothesised that neural mechanisms in the left auditory cortex are specialised for processing short‐duration spectral aspects of the acoustic stimulus and therefore support the efficient processing of rapidly changing broadband signals that compose speech [Johnsrude et al., 1997]. Although this study was not designed to separate the effects of FM from AM, one might speculate that the observed left‐sided dominance could be an effect of the frequency sweeps of the FM stimuli. Further experimentation will be required to define precisely the features that underlie the modulation effect, such as the type of modulation (e.g., amplitude vs. frequency), the rate and depth of modulation and the nature of the carrier (e.g., pure tone vs. band‐limited noise).
Effect of target discrimination
The target‐discrimination task required attention to the identities of the tone stimuli and a response to each occurrence of a target tone. Relative to passive listening, target discrimination permits the measurement of the degree of compliance in the task and may also sustain subject's arousal over the length of the experiment. The target‐discrimination task preferentially activated bilateral regions of the posterior STG and superior temporal sulcus. These regions were spatially separate from the area of STG that was specifically involved in analysis of the spectro‐temporal properties of the sound. An enhanced response in the posterior STG by selective auditory attention has also been reported by Tzourio et al. [1997] although in this study effects were lateralised to the hemisphere contralateral to the attended ear. In the present study, subjects attended to both ears and so bilateral activation of the posterior STG may be expected. The results demonstrate that the manifestations of selective attention can differ between the auditory and visual modalities. For example, visual cortical activation is modulated by the stimulus attributes to be detected. Regions known to be involved in colour processing show specific increases in activation during selective attention to colour and respective patterns are also observed for visual form and movement [Corbetta et al., 1991]. The present auditory study failed to show any interaction between modulation and auditory attention. In fact, the effect of auditory attention (task) was distinct and separate from that of modulation. Tzourio et al. [1997] have speculated that the auditory system may have a very different functional organisation to the parallel, hierarchically‐organised streams of processing reported in the visual system. So far, it has not been possible to clearly decompose pattern analysis pathways in the STG of the auditory cortex nor to ascribe specialised roles to different subregions of the STG. As previously discussed, for example, preferential responses to several acoustic features including bandwidth and frequency modulation seem to be found in the same lateral belt region of auditory cortex [see Rauschecker, 1998].
A number of brain areas beyond those of the temporal cortex were significantly activated by the target‐discrimination task. The anterior insula cortex, not generally construed as part of the auditory system, was one such area. In humans, the insula cortex has been divided into anterior and posterior regions on the basis of architectonic differences in staining patterns and the anterior insula cortex has been ascribed a multimodal sensory role [Rivier and Clarke, 1997]. The insula cortex of nonhuman primates has connections with a posterior region of the STG [Galaburda and Pandya, 1983], further indicating its auditory function. We therefore speculate that the target‐discrimination task, by placing demands on auditory analysis, leads to the detection of auditory activation in the anterior insula region. Other regions of activation, namely the pre‐ and post‐central gyrus, were primarily activated by the action of the finger press in the present study in response to target discrimination. However, there were other areas of differential activation, in frontal and parietal cortex and midbrain, whose functions are predominantly neither motor nor auditory, but has been suggested to be involved in the organisation of cognitive activity [e.g., Posner and Dehaene, 1994]. Several of these areas are multimodal regions of the attention network that have been described by Posner and his colleagues [Posner and Dehaene, 1994; Posner and Peterson, 1990; Posner and Presti, 1987], including the cingulate gyrus and the inferior parietal cortex corresponding to the supramarginal and angular gyri. The left thalamus was also activated during the target‐discrimination task. It has been suggested that the thalamus serves as a gating mechanism for the transmission of sensory information to the cortex [Brunia, 1993] and is involved in auditory attention by tuning the sensory neurones in auditory cortex [Roland, 1993]. This view indicates that the thalamus may have been in part responsible for the increase in activation that was observed in both primary and secondary regions of auditory cortex during the target‐discrimination task.
The target‐discrimination task also activated regions in the middle frontal gyrus of the prefrontal cortex and medially in the superior frontal gyrus. Bilateral middle frontal gyrus has been implicated in working memory tasks [e.g., Klingberg et al., 1997], including perceptual target‐discrimination tasks [McCarthy et al., 1996]. The target‐discrimination task used in the present study probably imposed a working memory load including remembering, over a period of time, the stimulus attributes to discriminate. The medial part of the superior frontal gyrus contains the supplementary motor area and supplementary eye fields [Bodis‐Wollner et al., 1997; Dejardin et al., 1998; Picard and Strick, 1996]. Saccadic eye movements could occur as subjects were not instructed to fixate during the study and hence superior frontal gyrus activation is therefore most likely to reflect finger and increased eye movements during the target‐discrimination task.
As a final point, we consider the potential confounding effect of the light cue that was present during the target‐discrimination, but not during the passive‐listening, task. The principle issue is whether the effect of this concurrent visual stimulus might influence our interpretation of the experimental results in the auditory cortex and/or in brain areas beyond the temporal cortex. We suggest that the effects of the cue on nonvisual activation are likely to be negligible because the light cue placed only a low‐level cognitive demand on subjects. Evidence indicates that when concurrent auditory and visual stimuli require no explicit integration to perform the task, then variations in the auditory stimulus have no measurable effect on the level of visual activation [Elliott et al., 1999].
CONCLUSIONS
The present study measured the pattern of stimulus‐induced activation in auditory cortex under conditions of passive and active listening. Both modulation and target discrimination induced preferential responses in separate regions of the STG indicating that the modulation effect was independent of the information‐processing demands of the listening task. Modulation elicited a response in a region of the STG that was anterior and inferior to HG, whereas target discrimination elicited a response in the posterior portion of the STG. The enhanced auditory activation by attention in a localised region of the posterior secondary auditory cortex that was not specifically involved in computing the attended stimulus attribute suggests possible differences between the organisation of the auditory and visual system [Corbetta et al., 1991; Tzourio et al., 1997]. Much is yet to be learned about the topographical representation in the auditory cortex. However, similarities in the organisation of the auditory pathway for pattern analysis in both humans and nonhuman primates (e.g., preferential responses to modulation and other complex acoustical stimuli in the lateral belt of the STG) [Rauschecker, 1998] suggest that jointly neurophysiology and neuroimaging can provide a basis for a greater understanding of the auditory system.
ACKNOWLEDGMENTS
We thank John Foster for carrying out the sound level measurements and Elaine Gurney for her assistance in the data analysis. This research was partly supported by MRC project grant G9302591 to the Magnetic Resonance Centre.
Footnotes
Due to an oversight, for two subjects, the higher frequency, static tone was 1 kHz instead of 900 Hz. This difference was not expected to affect the results because the spatial separation across tonotopically organised regions of auditory cortex between these two frequencies is smaller than the voxel resolution.
REFERENCES
- Binder JR. (1995): Functional magnetic resonance imaging of language cortex. Int J Imaging Syst Technol 6: 280–288. [Google Scholar]
- Binder JR, Rao SM, Hammeke TA, Yetkin FZ, Jesmanovicz A, Bandettini PA, Wong EC, Estkowski LD, Goldstein MD, Haughton VM, Hyde JS. (1994): Functional magnetic resonance imaging of human auditory cortex. Ann Neurol 35: 662–672. [DOI] [PubMed] [Google Scholar]
- Binder JR, Rao SM, Hammeke, TA , Frost JA, Bandettini PA, Jesmanovicz A, Hyde JS. (1995): Lateralized human brain language systems demonstrated by task subtraction functional magnetic resonance imaging. Arch Neurol 52: 593–601. [DOI] [PubMed] [Google Scholar]
- Boddaert N, Thivard L, Belin P, Poline JB, Zilbovicius M, Samson Y. (1998): Specialised auditory area related to frequency modulation analysis: a “meta‐analysis” PET study. NeuroImage 7: S374. [Google Scholar]
- Bodis‐Wollner I, Bucher SF, Seelos KC, Paulus W, Reiser M, Oertel WH. (1997): Functional MRI mapping of occipital and frontal cortical activity during voluntary and imagined saccades. Neurology 49: 416–420. [DOI] [PubMed] [Google Scholar]
- Bowtell RW, Mansfield P, Coxon RJ, Harvey PR, Glover PM. (1994): High resolution EPI at 3.0T. Magn Resonance Mater Phys, Med Biol 2: 1–5. [Google Scholar]
- Brunia CHM. (1993): Waiting in readiness—gating in attention and motor preparation. Psychophysiology 30: 327–339. [DOI] [PubMed] [Google Scholar]
- Corbetta M, Miezin FM, Dobmeyer S, Shulman GL, Petersen SE. (1991): Selective and divided attention during visual discriminations of shape, color, and speed—functional‐anatomy by positron emission tomography. J Neurosci 11: 2383–2402. [DOI] [PMC free article] [PubMed] [Google Scholar]
- Corbetta M, Shulman GL, Miezin FM, Petersen SE. (1995): Superior parietal cortex activation during spatial attention shifts and visual feature conjunction. Science 270: 802–805. [DOI] [PubMed] [Google Scholar]
- Dejardin S, Dubois S, Bodart JM, Schiltz C, Delinte A, Michel C, Roucoux A, Crommelinck M. (1998): PET study of human voluntary saccadic eye movements in darkness: effect of task repetition on the activation pattern. Eur J Neurosci 10: 2328– 2336. [DOI] [PubMed] [Google Scholar]
- Edmister WB, Talavage TM, Ledden PJ, Weisskoff RM. (1999): Improved auditory cortex imaging using clustered volume acquisition. Hum Brain Mapp 7: 89–97. [DOI] [PMC free article] [PubMed] [Google Scholar]
- Elliott MR, Bowtell RW, Morris PG. (1999): The effect of scanner sound in visual, motor, and auditory functional MRI. Magn Resonance Med 41: 1230–1235. [DOI] [PubMed] [Google Scholar]
- Evans AC, Collins DL, Mills SR, Brown ED, Kelly RL, Peters TM. (1993): 3D statistical neuroanatomical models from 305 MRI volumes In: Proceedings IEEE‐Nuclear Science Symposium and Medical Imaging Conference. Piscataway, NJ: IEEE Inc. p. 1813–1817. [Google Scholar]
- Friston KJ, Holmes AP, Poline JB, Grasby PJ, Williams SCR, Frackowiak RSJ, Turner R. (1995a): Analysis of fMRI time‐series revisited. NeuroImage 2: 45–53. [DOI] [PubMed] [Google Scholar]
- Friston KJ, Ashburner J, Frith CD, Poline JB, Heather JD, Frackowiak RSJ. (1995b): Spatial registration and normalization of images. Hum Brain Mapp 3: 165–189. [Google Scholar]
- Frith CD, Friston KJ. (1996): The role of the thalamus in “top‐down” modulation of attention to sound. NeuroImage 4: 210–215. [DOI] [PubMed] [Google Scholar]
- Galaburda AM, Pandya DN. (1983): The intrinsic architectonic and connectional organisation of the superior temporal region of the rhesus monkey. J Comp Neurol 221: 169–184. [DOI] [PubMed] [Google Scholar]
- Glasberg BR, Moore BCJ. (1990): Derivation of auditory filter shapes from notched noise data. Hearing Res 47: 103–138. [DOI] [PubMed] [Google Scholar]
- Grady CL, VanMeter JW, Maisog JM, Pietrini P, Krasuski J, Rauschecker JP. (1997): Attention‐related modulation of activity in primary and secondary auditory cortex. NeuroReport 8: 2511–2516. [DOI] [PubMed] [Google Scholar]
- Hall DA, Haggard MP, Akeroyd MA, Palmer AR, Summerfield AQ, Elliott MR, Gurney E, Bowtell RW. (1999): Sparse temporal sampling in auditory fMRI. Hum Brain Mapp 7: 213–223. [DOI] [PMC free article] [PubMed] [Google Scholar]
- Jäncke L, Shah NJ, Posse S, Grosse‐Ryuken M, Müller‐Gärtner HW. (1998): Intensity coding of auditory stimuli: an fMRI study. Neuropsychologia 36: 875–883. [DOI] [PubMed] [Google Scholar]
- Johnsrude IS, Zatorre RJ, Milner BA, Evans AC. (1997): Left‐hemisphere specialisation for the processing of acoustic transients. NeuroReport 8: 1761–1765. [DOI] [PubMed] [Google Scholar]
- Kaas JH, Hackett TA. (1998): Subdivisions of auditory cortex and levels of processing in primates. Audiol Neuro‐otol 3: 73–85. [DOI] [PubMed] [Google Scholar]
- Klingberg T, O'Sullivan BT, Roland PE. (1997): Bilateral activation of fronto‐parietal networks by incrementing demand in a working memory task Cereb Cortex 7: 465–471. [DOI] [PubMed] [Google Scholar]
- McCarthy G, Puce A, Constable RT, Krystal JH, Gore JC, GoldmanRakic P. (1996): Activation of human prefrontal cortex during spatial and nonspatial working memory tasks measured by functional MRI. Cereb Cortex 6: 600–611. [DOI] [PubMed] [Google Scholar]
- Menon V, Ford JM, Lim KO, Glover GH, Pfefferbaum A. (1997): Combined event‐related fMRI and EEG evidence for temporal‐parietal cortex activation during target detection. NeuroReport 8: 3029–3037. [DOI] [PubMed] [Google Scholar]
- Millen SJ, Haughton VM, Yetkin Z. (1995): Functional magnetic resonance imaging of the central auditory pathway following speech and pure‐tone stimuli. Laryngoscope 105: 1305–1310. [DOI] [PubMed] [Google Scholar]
- Palmer AR, Bullock DC, Chambers JD. (1998): A high‐output, high‐quality sound system for use in auditory fMRI. NeuroImage 7: S359. [Google Scholar]
- Penhune VB, Zatorre RJ, MacDonald JD, Evans AC. (1996): Interhemispheric anatomical differences in human primary auditory cortex: probabilistic mapping and volume measurement from magnetic resonance scans. Cereb Cortex 6: 661–672. [DOI] [PubMed] [Google Scholar]
- Picard N, Strick PL. (1996): Motor areas of the medial wall: a review of their location and functional activation. Cereb Cortex 6: 342–353. [DOI] [PubMed] [Google Scholar]
- Poline JB, Worsley KJ, Evans AC, Friston KJ. (1997): Combining spatial extent and peak intensity to test for activations in functional imaging. NeuroImage 5: 83–96. [DOI] [PubMed] [Google Scholar]
- Posner MI, Dehaene S. (1994): Attentional networks. Trends Neurosci 17: 75–79. [DOI] [PubMed] [Google Scholar]
- Posner MI, Peterson SE. (1990): The attention system of the human brain. Annu Rev Neurosci 13: 25–42. [DOI] [PubMed] [Google Scholar]
- Posner MI, Presti DE. (1987): Selective attention and cognitive control. Trends Neurosci 10: 13–17. [Google Scholar]
- Price CJ, Friston KJ. (1997): Cognitive conjunction: a new approach to brain activation experiments. NeuroImage 5: 261–270. [DOI] [PubMed] [Google Scholar]
- Pugh KR, Shaywitz BA, Fulbright RK, Byrd D, Skudlarski P, Katz L, Constable RT, Fletcher J, Lacadie C, Marchione K, Gore JC. (1996): Auditory selective attention: an fMRI investigation. NeuroImage 4: 159–173. [DOI] [PubMed] [Google Scholar]
- Rauschecker JP. (1997): Processing of complex sounds in the auditory cortex of cat, monkey and man. Acta Otolaryngol (Suppl.) 532: 34–38. [DOI] [PubMed] [Google Scholar]
- Rauschecker JP. (1998): Parallel processing in the auditory cortex of primates. Audiol Neuro‐otol 3: 86–103. [DOI] [PubMed] [Google Scholar]
- Rauschecker JP, Tian B, Hauser M. (1995): Processing of complex sounds in the macaque non‐primary auditory cortex. Science 268: 111–114. [DOI] [PubMed] [Google Scholar]
- Rauschecker JP, Tian B, Pons T, Mishkin M. (1997): Serial and parallel processing in Rhesus monkey auditory cortex. J Comp Neurol 382: 89–103. [PubMed] [Google Scholar]
- Rivier F, Clarke S. (1997): Cytochrome oxidase, acetylcholinesterase, and NADPH‐diaphorase staining in human supratemporal and insular cortex: evidence for multiple auditory areas. NeuroImage 6: 288–304. [DOI] [PubMed] [Google Scholar]
- Roland P. (1993): Brain activation. New York: John Wiley & Sons, Inc. [Google Scholar]
- Schlosser MJ, Aoyagi N, Fulbright RK, Gore JC, McCarthy G. (1998): Functional MRI of auditory comprehension. Hum Brain Mapp 6: 1–13. [DOI] [PMC free article] [PubMed] [Google Scholar]
- Strainer JC, Ulmer JL, Yetkin FZ, Haughton VM, Daniels DL, Millen SJ. (1997): Functional MR of the primary auditory cortex: an analysis of pure tone activation and tone discrimination. Am J Neuroradiol 18: 601–610. [PMC free article] [PubMed] [Google Scholar]
- Thivard L, Belin P, Zilbovicius M, Boddaert N, Samson Y. (1998): Functional anatomy of frequency modulation analysis: demonstration of functional specialisation in human auditory cortex. NeuroImage 7: S373. [Google Scholar]
- Tzourio N, El Massioui F, Crivello F, Joliot M, Renault B, Mazoyer B. (1997): Functional anatomy of human auditory attention studied with PET. NeuroImage 5: 63–77. [DOI] [PubMed] [Google Scholar]
- Woodruff PWR, Benson RR, Bandettini PA, Kwong KK, Howard RJ, Talavage T, Belliveau J, Rosen BR. (1996): Modulation of auditory and visual cortex by selective attention is modality‐dependent. NeuroReport 7: 1909–1913. [DOI] [PubMed] [Google Scholar]