

Abstract
Recently, event‐related fMRI‐experiments have been reported in which subsequent trials were separated by only 2 sec or less. Because the BOLD response needs 10 sec and longer to return to baseline, the event‐related signal in these experiments has to be extracted from the overlapping responses elicited by successive trials. Usually it is assumed that this convolved signal is a summation of the overlapping BOLD responses. We tested this assumption by comparing event‐related signals in conditions with little and with substantial BOLD overlap in two fMRI experiments of a task‐switching paradigm. We analyzed the difference in the activational time course elicited by a critical task and a baseline task when trials of both tasks were separated by intertrial intervals of 15 sec or when the critical trials were embedded in a stream of baseline trials with ISI = 1 sec. The change of the BOLD signal elicited by the critical trials showed a high correspondence between both experiments in five out of six cortical ROI. Our data support the view that BOLD overlap leads to largely linear signal changes. In the present study, task‐related increases in the BOLD response were detected equally well with substantial BOLD overlap as with mostly nonoverlapping BOLD responses. Hum. Brain Mapping 9:26–37, 2000. © 2000 Wiley‐Liss, Inc.
Keywords: neuroimaging, methods, magnetic resonance, vascular response, human, executive function
INTRODUCTION
The feasibility of event‐related analysis of functional magnetic resonance imaging (fMRI) data has been demonstrated in a number of studies [Buckner et al., 1996; Zarahn et al., 1997]. Initially, it was shown that isolated trials of a task, usually averaged over experimental conditions, elicited sufficiently strong signal changes. In these experiments, periods of task processing were interspersed with long interstimulus intervals (ISI) in order to allow the BOLD response to return to baseline. However, long ISI are suboptimal from an experimental point of view, since they restrict the number of averages that can be obtained in a given duration of an experimental session. Moreover, control over participants' mental activities during these long intervals is poor. This led a number of researchers to present trials in rapid succession. Clark et al. [1998] demonstrated that different conditions of a face detection task, presented randomly at a rate of 0.5 Hz, led to discriminable activation patterns. Dale and Buckner [1997] found that the individual stimulation events contributed roughly linearly to the BOLD response elicited by a train of stimuli presented in rapid succession. In a study in which the ISI was systematically varied from 4–12 sec, we similarly found that the change of the BOLD response at short ISI could be mainly attributed to summation of overlapping BOLD responses [Pollmann et al., 1998]. This was true for regions of interest (ROIs) in frontal, parietal, and occipital cortex as well as subcortical structures. These findings are in line with an earlier report demonstrating that variations in stimulus contrast and duration led to discriminable linear changes in the BOLD response [Boynton et al., 1996]. Analogous data have recently been reported for Broca's area [Nystrom et al., 1998].
Correction for BOLD overlap is necessary for event‐related fMRI with short ISI and appropriate designs, which assure that critical trials have the same “trial history” in that experimental conditions are counterbalanced in the trials preceding the critical trials and will lead to valid results, in the sense that both conditions will experience the same overlap from responses to previous trials [Buckner et al., 1998]. However, there are limits to the linear relation between stimulus frequency and BOLD response. In a recent report, an increase in the stimulus frequency led to a u‐shape function of the BOLD intensity, i.e., the intensity declined beyond an optimal stimulation frequency [Friston et al., 1998]. This effect was specific for fMRI in that it did not occur in the same experiment replicated with positron emission tomography (PET). Such a reduction of the BOLD signal could mean that event‐related signal changes become so small that they fall beyond a detection threshold, although they would be above threshold at longer ISI with less BOLD overlap. The goal of the present study is to provide an empirical test whether ISI, which are sufficiently short to run most cognitive experiments without changes to their trial structure, may lead to such reductions in signal amplitude.
For this purpose, we have run two fMRI‐experiments using a task‐switching paradigm. Participants had to reverse the response mapping of two visual stimuli, depending on their color. It has been shown that task switches of this sort lead to increased reaction times, indicating additional task demands during the switch operation [e.g., Allport et al., 1994; Jersild, 1927; Meiran, 1996; Rogers and Monsell, 1995]. We investigated whether these additional task demands led to an increase of the BOLD signal, compared to the baseline task requiring responses to the same stimuli without task switch. We then compared the difference between baseline‐ and switch‐elicited BOLD signal when the ISI was long, allowing the BOLD response to return to baseline as well as at short ISI, leading to BOLD overlap. Given a linear summation of BOLD responses, the signal increase from baseline to the switch condition should be equal at long and short ISI.
This report concentrates on methodological questions. The functional neuroanatomy of task switching is analysed in a separate study, based in part on the data presented here [Dove et al., 1999].
BEHAVIORAL EXPERIMENTS
The phenomenon observed in task‐switching experiments is that participants need additional time to respond to stimuli when the mapping between stimulus and response is changed during an experiment. This prolongation of reaction times (RT) is referred to as “switch costs,” which are a quite robust phenomenon that has been observed whether switches were predictable or not and even when participants had a relatively long time (1200 msec) to prepare for a switch [Rogers and Monsell, 1995]. Theoretically, switch costs are expected whenever a switch between tasks has to be carried out, even with long intervals between responses. This was a prerequisite for the current experiments. Our goal was to compare switch‐associated BOLD responses in event‐related fMRI under conditions with little and with substantial BOLD overlap. These conditions were realized by using ISIs of 1 sec and 15 sec, respectively.
For the present experiments, we had to establish that switch costs would be observed at ISI which are considerably longer than the ISI reported in the literature. In addition, we reduced the ratio of baseline trials relative to switch trials in the experiment with long ISI in order to collect a sufficient number of switch trial averages in the limited time a subject can lay still in the MR scanner. Thus we also investigated whether the ratio of switch and basic trials would affect switch costs.
Participants
Twelve paid participants (eight female), all students of the University of Leipzig, took part in the behavioral pretest experiments. They were between 20 and 32 years of age. All were righthanded as assessed with the Edinburgh Inventory [Oldfield, 1971].
Stimuli and procedures
In baseline trials, a green + or − sign was presented at the center of the screen (Fig. 1). The stimuli extended 1.26° of visual angle. Participants were instructed to press the left key of a custommade response board when + was presented and the right key when − was presented. In the switch condition, stimuli were colored red and participants had to reverse the response mapping. After a switch trial had occurred, a mandatory number of baseline trials were run, depending on the condition (see below). After this minimum number of baseline trials, switches occurred in exponentially declining frequency over the subsequent trials, so that the probability of a switch occurring at trial n was equivalent to the probability that it would occur at one of the following trials. This presentation ensured that no valid expectations as to the occurrence of a switch at a given trial could be generated by the participants.
Figure 1.
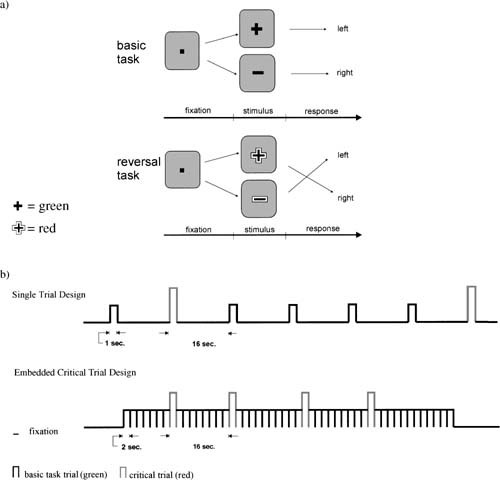
Experimental procedures. (a) Structure of basic task and task switch trials. (b) Temporal sequence of stimuli in the conditions with long and short ISI in the fMRI‐experiments.
This lack of predictiveness ensured that the time participants had to prepare for this task switch was identical in both conditions, in spite of the different intertrial intervals. This is important since longer preparation times may lead to reduced switch costs [Rogers and Monsell 1995; Meiran 1996].
After the participants had read the instructions, a practice block was presented. The first 80 trials, presented with an ISI of 1 sec, served as training and were discarded. Depending on the condition, the experiment continued as below.
ECT: embedded critical trial condition, ISI = 1 sec
After stimulus presentation, a fixation mark was presented for 1 sec. At least eight basic task trials were presented between the presentation of each critical trial. In the 9.‐14. trial, one critical trial was presented. The frequency of the switch trials was governed by a declining exponential probability function as described above. After the critical trial, again a minimum of eight basic task trials were run. The critical condition contained 96 trials embedded in 884 basic task trials.
STL: single trial condition, ISI = 16 sec, long version
After stimulus presentation, a hollow square was presented as fixation mark. After 10 sec, the square blinked for 1.5 sec to alert participants to the upcoming new stimulus. This was done to yield a comparable level of alertness as in the ECT condition. One second before stimulus presentation, the fixation mark changed to a filled square, identical to the ECT version. The total length of the interstimulus interval was 16 sec. Compared to the ECT condition, the number of trials was reduced to a third, resulting in 32 critical and 301 basic task trials. All other aspects were identical to the ECT condition.
STS: single trial condition, ISI = 16 sec, short version (STS)
In this condition, the procedure was the same as in the STL condition except that instead of a minimum number of eight basic task trials, a minimum of four basic task trials were presented between the presentation of each critical trial. Thus, 32 critical trials were interspersed in 165 basic task trials.
Experimental design
The three experimental conditions (ECT, STL, and STS) were presented in counterbalanced order. The trials of the STL condition were presented in two sessions of 45 min each. The trials of the ECT and STS conditions were presented in one session each. The four sessions were conducted on 4 different days spread over a maximum of 8 days. Participants were randomly assigned to the different orders.
Apparatus
Participants sat in front of a computer monitor in a dimly lit room. Environmental brightness was comparable to the magnet room. Stimulus presentation and response collection were controlled with millisecond accuracy by a PC equipped with ERTS software and EXKEY logic connected to custommade response keys [Beringer, 1995].
Data analysis
The following responses were excluded from further analysis to remove artefactual confounds: responses in the first trial of an experiment and each trial presented after a break, error trials and trials immediately following a baseline task error, the next four trials after a switch error. Reaction times (RT) > 1,300 msec were excluded. RT beyond this deadline would have interfered with preparation to the upcoming trial in the ECT condition. Therefore, in all conditions a warning signal was presented when RT exceeded 1,300 msec. A repeated measures ANOVA with the factors treatment (basic/switch) and condition (ECT, STL, and STS) was run on the reaction times. Posthoc contrasts were conducted to examine switch cost differences between conditions. For these analyses, RT in the switch trials were compared to RT in the basic task trials immediately preceding the switch trials.
RESULTS
The ANOVA yielded a significant main effect for task switch (F(1, 11) = 193,14, P < .001). The condition main effect was not significant (F(2, 22) = 2.05, P = .153). The interaction of task switch × condition was significant (F(2, 22) = 5,36, P = .013). Figure 2 shows that basic task RT were elevated at long ISI and in the STS compared to the STL condition. Pairwise comparisons of switch costs yielded a significant difference between the ECT and the STS condition (t(11) = 3.28, P = .007).
Figure 2.
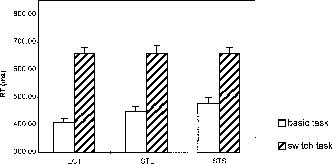
Reaction times (RT) in the behavioral pretests for basic task and critical switch trials. ECT: embedded critical trial condition, STS: short single trial condition, STL: long single trial condition (for details, see behavioral experiments methods Exp. One). Switch costs are the difference between the switch and the basic task RT. Error bars represent standard error of mean.
Only few errors were made in all conditions (ECT: 2,17%, STL:2,38%, STS:2,99%).
DISCUSSION
The behavioral data showed highly significant switch costs in all three experimental conditions, therefore enabling us to investigate task switch‐related BOLD signal changes at short and long ISI. Switch costs were highest in the ECT condition. Both long ISI and higher ratio of switch/basic trials contributed to a gradual decrease in switch costs. These findings show that changes necessary for the adaptation to a standard, long ISI, single trial fMRI design were problematic in that they led to subtle changes in the experimental effect. If replicated in the fMRI experiments, they would have to be accounted for in the analysis of the activation data.
FMRI EXPERIMENTS
Two fMRI experiments were run to compare switch‐associated signal changes in conditions with little and with substantial BOLD overlap. We used the STS condition to implement the former and the ECT condition for the latter. Due to the long ISI in the STS experiment, signal changes both for baseline and switch trials start from a resting state baseline. In comparison, the short intertrial intervals in the ECT condition should lead to continuous activation over the entire task period. The embedded switch trials were expected to elicit an additional increase of the BOLD response on top of this ongoing activation (Fig. 3). Time course analyses of ROI were conducted to compare the amplitude, latency, and duration of the signal changes elicited by the additional task demands of the switch trials in both conditions. If BOLD overlap leads to a strictly linear summation, the additional activation elicited by the critical trials in the ECT experiment will be equivalent to the difference between signal intensity changes of the basic task trials and critical trials in the STS experiment.
Figure 3.
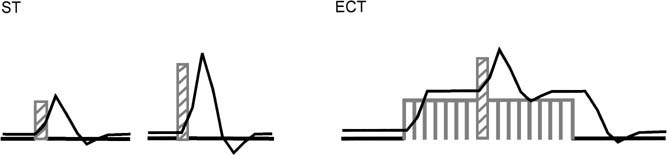
Hypothetical BOLD responses with short and long ISI. Switch trials are assumed to elicit stronger activation than basic task trials. With long ISI (ST condition), switch trials lead to peaks of higher amplitude. With short ISI (ECT condition), task switching leads to a signal increase on top of the basic task activation (For graphical reasons, only one critical trial per basic task block is depicted in the ECT‐condition.)
Participants
The ECT experiment was conducted with 14 paid participants. The data of three participants could not be used (one participant moved grossly during scanning, another showed extended susceptibility artefacts, a third did not show behavioral switch costs).
We were able to invite six of the remaining 11 participants again to perform the STS condition. One more participant performed both fMRI‐experiments, but in the opposite order (STS condition before ECT). One of seven participants who conducted both experiments was excluded from the analyses, because she showed no difference in activation between basic task and critical task in either the ST‐ or the ECT‐condition. Of the remaining six participants, four were female, two male, between 22 and 27 years of age. All were righthanded as assessed with the Edinburgh Inventory [Oldfield, 1971].
Procedures
Behavioral training
To make sure that the participants were acquainted with the experiment, they were given practice prior to the fMRI experiment, and 3–4 days prior to the fMRI experiment, they practised in the laboratory. At the beginning of the scanning session, they were given another 97 trials at ISI = 1 sec while the anatomical images were collected.
ECT experiment
With few exceptions the experiment remained the same as in the ECT condition of the behavioral pretest experiment. The following changes were made to include a fixation condition and to adapt the experiment to the requirements of fMRI‐testing (Fig. 1). Critical trials and basic task trials were presented in 12 task blocks of 50 trials each. Before and after the task blocks, a central fixation square was presented for 30 sec. This condition allowed us to determine the signal intensity level at rest. Within each task block, four critical trials were presented pseudorandomly. Prior to the first critical trial and after the last critical trial, at least eight basic task trials were presented. The total number of critical trials was 48, embedded in 552 basic task trials. The experiment consisted of four runs of 7‐min duration each.
STS experiment
The experiment was identical to the STS condition of the behavioral pretest experiment except that the ISI was reduced from 16 sec to 15 sec to yield a trial duration (15 sec ISI + 1 sec stimulus presentation = 16 sec), which is a multiple of the image repetition time (TR = 2 sec). The experiment, which was subdivided into five runs of 8 minutes each, consisted of 20 critical and 125 basic task trials.
Apparatus
Stimuli were projected by an LCD projector equipped with a telephoto lens [Pollmann, 1997] onto a translucent screen positioned in the bore of the magnet behind the participant's head. Participants perceived the screen through mirror glasses equipped with corrective lenses if needed. Size and brightness of the stimuli were closely matched to the behavioral experiments (the brightness of the stimuli was 10 cd/m2 and the brightness of the background 1 cd/m2). As in the behavioral pretest, the experiments were run on a PC with ERTS software and EXKEY‐logic [Beringer, 1995]. The response logic was connected to a custommade shielded electrical response board that was used in the scanner. Participants reacted by pressing a left and a right response key with the index and middle finger of their right hand.
MR methods
Seven horizontal slices were acquired parallel to the AC‐PC plane, two slices ventral and the remaining five slices dorsal to AC‐PC. Slice thickness was 10 mm, interslice distance 2 mm, a 25 cm FOV, and an image matrix of 128 (left/right) × 64 (anterior/posterior). Thus voxel size was 2 × 4 × 10 mm. A two‐shot EPI sequence was used with a bandwidth of 100 kHz and a TR of 2 sec for a complete image. Stimulus presentation was triggered by the MR console every 2 sec for exact temporal correspondence between image collection and stimulation. A gradient recalled echo with TE = 40 ms was used with a RF flip angle of 40°. All investigations were performed using a Bruker 3 T/100 Medspec, whole body system. Signal transmission and reception were performed using a 28 cm id quadrature birdcage resonator. Either a whole body gradient set (30 mT/m switchable within 500 msec), or a head gradient insert (Magnex: 40 cm id., 35 mT/m, 150 msec switching time) were employed, and 3D anatomical images were acquired using segmented MDEFT [Lee et al., 1995]. In this sequence, the 90°‐t‐180°‐t preparation is followed by 64 FLASH readouts, generating a 256 × 256 × 128 matrix. The data were acquired in sagittal section to minimise motion artefacts from the eyes. Imaging parameters were: t 650 msec, slice 1.5 mm, field of view 25 cm, and 3D structural and functional images were acquired in separate sessions.
Data analysis
Behavioral data
Analogous to the behavioral pretest, a repeated measures ANOVA with treatment (basic/switch) and condition (ECT, STS) as factors was calculated on the RT.
FMR‐data
Images were gaussian filtered in the spatial domain with a FWHM = 3 mm and motion corrected with the algorithm of Friston et al. [1996]. Subsequently, images were analysed with the in‐house software BRIAN [Kruggel and Lohmann, 1996] using t‐tests to compare activations between the experimental conditions, as detailed below. A boxcar reference waveform was designed to represent the experimental conditions—basic task and task switch. This reference waveform was shifted in time to obtain optimal activation strength for 4 sec in the STS and for 2 sec in the ECT experiment. Each critical trial was represented by three “on” images, resulting in on periods lasting from 2–8 sec poststimulus onset in the STS and from 4–10 sec poststimulus onset in the ECT experiment. The basic task in the STS condition was represented by three on images lasting from 2–8 sec poststimulus onset, as the critical task in the same condition.
From the basic task in the ECT condition, the first seven trials of each block were excluded, allowing the activation to reach an equilibrium. In addition, the first seven trials after the presentation of a critical trial were excluded, since the critical trial may have contributed to the activation in this period. The resulting t‐maps were converted into z‐maps registered with a high‐resolution anatomical dataset for each participant. Then the individual z‐maps as well as the anatomical datasets were normalized by linear scaling. Average z‐maps were computed by performing t‐tests for known variance at corresponding voxels across participants. T‐tests for known variance can be used in this case, because given the null hypothesis of no difference at a voxel within an individual z‐map, z‐scores are normally distributed with a variance of 1. The resulting group z value equals the average individual z value * ✓ n, in this case 1.8 * ✓ 6 = 4.4. All reported group z = 4.40 are significant at P = 0.00001. The group z‐map was overlaid onto the averaged anatomical dataset.
Regions showing significant differences in activation between task switching and basic task in the averaged activation maps were selected as regions of interest (ROI). The borders of the ROI were then anatomically defined within each participant's individual anatomical dataset. They covered the anatomical structures underlying the activations in the averaged activation map, but extended beyond the borders of the averaged activation areas to allow for individual variance. Within the borders of a given ROI, a cluster of the four most activated pixels was selected from the individual functional dataset of each participant in each experiment. ROIs were always defined in the same slice to avoid slice acquisition order effects. The mean signal intensity over the cluster was extracted for each experiment. Linear detrending was performed calculating linear regression for each run. In order to transform the data into percent change from baseline, all residuals were set to a corrected value by adding the mean of the estimated values of the regression analysis. In the STS condition, the measurements taken at the time the stimulus was presented and two measurements before were defined to be the baseline for the following epoch. In the ECT condition, the mean signal intensity measured during the fixation condition was defined to be the baseline for the following task block.
Error trials in the STS condition in the basic task and critical task and in the ECT experiment in the critical condition were eliminated. Error trials of the basic task in the ECT condition were not discarded because, due to the rapid succession of trials, it is difficult to define which timesteps would be affected by an error (few errors, 4.65%, were made in this condition). Data were selectively averaged over the basic and critical task conditions in the STS and ECT conditions.
To obtain the signal intensity changes in the critical task in the ECT condition, the measurements taken one timestep prior to until six timesteps past the critical trial were averaged over all correct critical trials for each participant. Afterward the data were averaged over the six participants. Due to the BOLD overlap in the basic task condition, we could only determine the mean amount of activation in the basic task condition. This was done by averaging over basic task trials excluding the six timepoints following the presentation of the critical trial first for each participant and then over all participants.
As in the ECT condition, the measurements taken one timestep prior to until six timesteps past the critical trial in the STS condition were averaged over all critical trials of each participant and then averaged over participants. To obtain the signal intensity changes, the basic task trials presented before the critical trials were averaged in the same way as the critical trials. Instead of taking all basic task trials, these trials were chosen to make sure that the basic task trials were not affected in any way by the presentation of the critical trial and to keep the number of trials in both conditions the same.
RESULTS
Behavioral data
The ANOVA yielded a significant treatment main effect (F(1, 5) = 155.39, P < .001), indicating clear task switch costs. The condition main effect (F(1, 5) = 23.50, P = .005) was significant, RT were longer in the STS condition. Although there was a trend toward higher switch costs in the ECT condition (Fig. 4), the interaction of treatment × condition was not significant (F(1, 5) = 5.41, P = .068). Again, error rates were low (ECT: 4.9%, STS: 1.7%).
Figure 4.
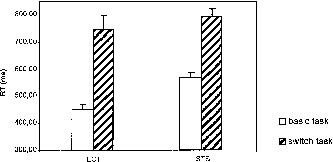
Behavioral switch costs during the fMRI experiments. ECT: embedded critical trial condition, STS: short single trial condition. Switch costs are the reaction time differences between switch and basic task trials. Error bars represent standard error of mean.
Functional imaging
Compared to baseline task activity, we found significant task switch‐related activity in the right middle frontal gyrus, the right insula bordering the claustrum, the SMA/pre‐SMA complex, and the banks of the intraparietal sulcus (IPS) bilaterally, with more marked activation along the left IPS (Fig. 5). In general, activation foci were identical in the ECT and STS experiments. However, the ECT experiment yielded larger areas of activation and in the case of the insula and the right IPS, suprathreshold activations were only seen in the ECT experiment. However, the absence of a significant activation focus need not necessarily imply the absence of a sufficiently strong task‐related response. For one, the number of critical trials in the ECT experiment was three times the number in the STS experiment, yielding more statistical power. In addition, the smaller foci in the STS experiment were less likely to overlap in the averaged image and thus may have gone unnoticed. Thus for the six activated regions of the ECT experiment, we returned to the individual datasets and analyzed clusters of the most active pixels within these ROI (cf. methods). Recurring to the individual ROI, the right prefrontal activation turned out to be composed of a more anterior and a more posterior portion, in correspondence with the form of the averaged z‐map in the ECT‐condition. Figure 6 gives the BOLD response curves for these individually defined ROI, again averaged over participants. Switch trials elicited significantly higher signal changes than basic task trials in all ROI, assessed by t‐tests between peak amplitudes of the switch and basic task conditions (ECT‐experiment: all t(5) ≥ 4.02, P ≤ .010, STS‐experiment: all t(5) ≥ 2.71, P ≤ .042). Amplitude and latency of the BOLD responses showed a high degree of correspondence between the experiments in all ROI except the SMA/pre‐SMA‐complex.
Figure 5.
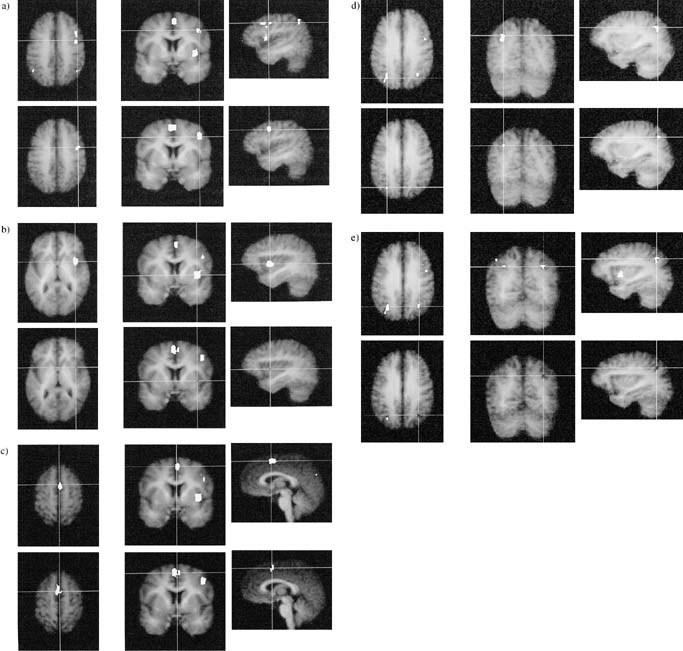
Areas activated by task switching. White areas represent increases in the BOLD response associated with task switching vs. basic task, averaged over participants. Activations are overlaid on the participants' averaged high‐resolution anatomical images. White areas represent activation above a threshold of z (group) = 4.4. (a) right middle frontal gyrus, (b) right insula, (c) SMA/preSMA, (d) left intraparietal sulcus, (e) right intraparietal sulcus.
Figure 6.
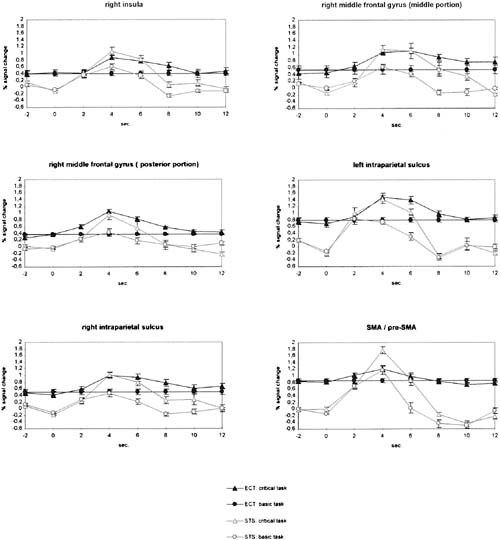
Averaged event‐related BOLD signal changes for the basic task and task switch conditions in the ECT and STS experiments for six ROI. Error bars represent standard error of mean.
Table I.
Localization of task switch‐basic task activation in the coordinates of the Talairach and Tournoux [1988] atlas
| x | y | z | |
|---|---|---|---|
| Right middle frontal gyrus (middle portion) | 45 | 16 | 37 |
| Right middle frontal gyrus (posterior portion) | 45 | 2 | 37 |
| Right insula (middle portion)/Claustrum | 31 | 2 | 3 |
| SMA/preSMA‐complex | 0 | 2 | 56 |
| Banks of the left intraparietal sulcus | −25 | −72 | 36 |
| Banks of the right intraparietal sulcus | 27 | −67 | 36 |
In the ECT experiment, the activation elicited by the rapidly presented baseline task trials is at an equilibrium. The additional activation elicited by the embedded critical trials should reflect the additional cognitive processing demands of the switch trials. Therefore, the difference of the intensity elicited by the two conditions in the STS experiment should be equivalent to the intensity change elicited by the switch condition in the ECT‐experiment. Figure 7 compares these measures. For most ROI, there was a very close correspondence of the differential BOLD curves between conditions. The intensity changes elicited by the embedded switch trials developed over time in almost the same way as the differential intensity curve calculated for the STS experiment. Only one ROI, the SMA‐pre‐SMA complex, showed a clear difference between both measures.
Figure 7.
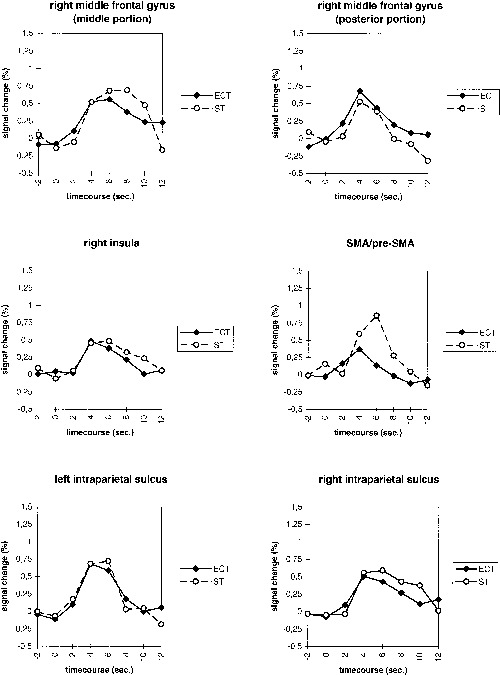
Differential BOLD curves for task switch‐basic task in six ROI in the ECT and STS conditions.
A MANOVA with the factors experiment (ECT, STS) and time (timesteps from −2–12 sec) calculated over the six ROI as dependent variables yielded significant overall main effects for experiment (F(6, 75) = 2.548, P = .027) and time (F(42, 440) = 4.954, P < .001). Not surprisingly, the main effect of time was also highly significant for all individual ROI (all F(7, 80) > 5,789, P < .001). However, the univariate main effect of experiment was only significant for the SMA/pre‐SMA‐complex‐ROI (F(1, 80) = 8,302, P = .005, all other F(1, 80) < 2,659, P > .107). In all ROI, if there were noticeable differences between the experiments, the BOLD response seemed to peak later in the STS condition. However, the multivariate interaction of experiment × time was not significant (F(42, 440) = .922, P = .614). This was also true for all individual ROI except the SMA/pre‐SMA‐complex (F(7, 80) = 2,651, P = .016, all other F(7, 80) < .935, P > .485).
When the SMA/pre‐SMA‐complex was excluded from the analysis, the multivariate main effect of experiment was not significant anymore (F(5, 76) = 1,582, P = .175). Besides this, exclusion of the SMA/pre‐SMA‐complex did not affect the pattern of significant multivariate or univariate effects. Thus with the exception of the SMA/pre‐SMA‐complex, long versus short ISI did not lead to significant differences in the amplitude or latency of the BOLD response.
DISCUSSION
Switching between stimulus‐response mappings elicited significantly increased activation in the right middle frontal gyrus, the right insula bordering the claustrum, the SMA/pre‐SMA complex, and the banks of the intraparietal sulcus bilaterally.
The BOLD overlap in the rapid presentation condition did not lead to signal loss; on the contrary, two additional foci of activation were detected compared to the STS condition. Moreover, the loci of activation common to both ECT and STS conditions were larger in the ECT condition. One reason for this difference may be the higher statistical power due to the higher number of averages made possible by rapid succession of trials in the ECT condition. Another contributing factor may be the tendency toward stronger switch costs observed in the ECT condition.
Whereas the activated areas were larger in the ECT than the STS condition, the amplitudes of the signal changes in the most activated voxels were very similar across short and long ISI, both for basic task and switch trials. Moreover, the form of the differential task switch‐basic task BOLD signal curves showed a high correspondence in the experiments with and without BOLD overlap, indicating a mostly linear superposition of overlapping BOLD responses to trials presented in rapid succession. The present study confirms the data of Dale and Buckner [1997], which had drawn the same conclusion from their visual cortex activation data, and extends their findings to multiple cortical regions. In addition, our data show that the linearity of BOLD overlap holds for cognitive evoked BOLD changes and not only for signal changes evoked by physical stimulus changes. Clark et al. [1998] validated their rapid presentation data by comparing their rapid presentation event‐related fMRI data to activation patterns from relevant block design fMRI and PET‐studies. Our comparison was a more direct examination of the effects of stimulation frequency in otherwise closely parallelized event‐related fMRI experiments.
Signal change in one ROI, the SMA/pre‐SMA complex, was reduced with rapid presentation. Although this reduction did not lead to a detection failure in this experiment, it may be an example of a nonlinear response change that may occur when a critical stimulation frequency is reached and that this critical frequency may differ from area to area [Friston et al., 1998]. However, there is no good reason to expect that the SMA/pre‐SMA complex should have a lower optimal stimulation frequency than the other ROI. The increased SMA/pre‐SMA‐complex activation may instead follow from differential processing demands induced by the ISI variation. It is known since long that increasing the duration of a foreperiod leads to increased reaction times [Niemi and Näätänen 1981, Luce 1986]. Such an increase was also found in the present study, with longer baseline RT at long ISI. This inability to keep up a response preparation over an extended period of time goes along very well with increased activity in the SMA/preSMA complex. This increased activity may thus reflect the need to renew response preparation for every response when long ISI are used, whereas with short ISI response preparation may be facilitated by the ongoing sequence of responses.
In the behavioral pilot experiments, switch costs were higher with short ISI. Therefore, one concern may be that higher activation, in correspondence to the higher switch costs, may have counteracted a signal decrease due to rapid presentation at short ISI, leading to the erroneous conclusion of linear BOLD overlap. However, although there was a trend toward higher switch costs at short ISI in the fMRI experiments, the treatment × condition interaction failed to reach significance. We, therefore, assume that processing differences have not affected the comparison of short and long ISI in any major way (except for the SMA/pre‐SMA‐complex).
Another possible concern is that the fixed order of the experiments may have biased the amplitude of the BOLD response. This cannot be excluded; however, in pilot experiments, we found that reaction times were reduced after extensive training, but the size of switch costs (i.e., the difference of reaction times to task switch trials vs. baseline trials) did not change. Thus the size of the differential BOLD effect (Fig. 7) should not be affected by training.
Of course, our ISI = 1 sec (equivalent to a stimulus presentation rate of 0.5 Hz) may have been not rapid enough to observe a signal reduction. In the study of Friston et al. [1998], this reduction occurred at word presentation frequencies above 1 Hz. However, our interest was not to reach this limit, but to study the linearity of the BOLD response at presentation rates, which are sufficiently fast so that most experiments from the domains of cognitive psychology or psychophysiology can be used without alterations in their trial structure. The importance of this is underlined by our behavioral data, which showed that the variation of the ISI alone was sufficient to create subtle changes in task processing in otherwise closely parallelized experiments. Fortunately, the available evidence sofar indicates that rapid presentation event‐related fMRI can be used without significant loss of information.
Acknowledgements
We thank Torsten Schubert, David Norris, and two anonymous reviewers for their valuable comments on a previous version of this manuscript.
REFERENCES
- Allport DA, Styles EA, Hsieh S. 1994. Shifting intentional set: Exploring the dynamic control of tasks In: Umilta C, Moscovitch M, editors. Attention and performance XV. Cambridge: MIT Press; p 421–452. [Google Scholar]
- Beringer J. 1995. Experimental Run Time System, Version 3.11. Berisoft, Frankfurt am Main, Germany.
- Boynton GM, Engel SA, Glover GH, Heeger DJ. 1996. Linear systems analysis of functional magnetic resonance imaging in human V1. J Neurosci 16:13:4207–4221. [DOI] [PMC free article] [PubMed] [Google Scholar]
- Buckner R, Bandettini P, O'Craven K, Savoy R, Petersen S, Raichle M, Rosen B. 1996. Detection of cortical activation during averaged single trials of a cognitive task using functional magnetic resonance imaging. Proc Natl Acad Sci USA 93:14878–14883. [DOI] [PMC free article] [PubMed] [Google Scholar]
- Buckner RL, Goodman J, Burock M, Rotte M, Koutstaal W, Schacter D, Rosen B, Dale AM. 1998. Functional‐anatomic correlates of object priming in humans revealed by rapid‐presentation event‐related fMRI. Neuron 20:285–296. [DOI] [PubMed] [Google Scholar]
- Clark VP, Maisog JM, Haxby JV. 1998. fMRI study of face perception and memory using random stimulus sequences. J Neurophysiol 79:3257–3265. [DOI] [PubMed] [Google Scholar]
- Dale AM, Buckner R. 1997. Selective averaging of rapidly presented individual trials using fMRI. Hum Brain Mapping 5:329–340. [DOI] [PubMed] [Google Scholar]
- Dove A, Pollmann S, Schubert T, Wiggins CJ, von Cramon DY. 1999. Prefrontal cortex activation in task switching: an event‐related fMRI study. Cognitive Brain Res (in press). [DOI] [PubMed] [Google Scholar]
- Friston KJ, Josephs O, Rees G, Turner R. 1998. Nonlinear event‐related responses in fMRI. Magn Res Med 39:41–52. [DOI] [PubMed] [Google Scholar]
- Friston KJ, Williams S, Howard R, Frackowiak RSJ, Turner R. 1996. Movement‐related effects in fMRI time‐series. Magn Res Med 35:346–355. [DOI] [PubMed] [Google Scholar]
- Jersild AT. 1927. Mental set and shift. Arch Psychol, whole no. 89. [Google Scholar]
- Kruggel F, Lohmann G. 1996. BRIAN (Brain Image Analysis). A toolkit for the analysis of multimodal brain datasets In: Lemke HU, Vannier MW, Inamura K, Farman AG, editors. Computer assisted radiology. Proceedings of the International Symposium on Computer and Communication Systems for Image Guided Diagnosis and Therapy: Paris. June 1996, Amsterdam, Elsevier. [Google Scholar]
- Lee J‐H, Garwood M, Menon R, Adriany G, Andersen P, Truwit CL, Ugurbil K. 1995. High contrast and fast three‐dimensional magnetic resonance imaging at high fields. Magn Res Med 34:308. [DOI] [PubMed] [Google Scholar]
- Luce RD. 1986. Response times: their role in inferring elementary mental organization. New York: OUP, p 72. [Google Scholar]
- Meiran N. 1996. Reconfiguration of processing mode prior to task performance. J Exp Psychol: Learn Mem Cogn 22:1423–1442. [Google Scholar]
- Niemi P, Näätänen R. 1981. Foreperiod and simple reaction time. Psychol Bull 89:133–162. [Google Scholar]
- Nystrom LE, Delgado MR, Sabb FW, Noll DC, Cohen JD. 1998. Dynamics of fMRI: Broca's area activation reflects independent effects of duration and intensity of working memory processes. Neuroimage 7:s7. [Google Scholar]
- Oldfield RC. 1971. The assessment and analysis of handedness: the Edinburgh inventory. Neuropsychologia 9:97–113. [DOI] [PubMed] [Google Scholar]
- Pollmann S. 1997. Development of a visual projection system for fMRI experiments. Annual Report 1996, Max Planck Institute of Cognitive Neuroscience, Leipzig, p 127.
- Pollmann S, Wiggins CJ, Norris DN, von Cramon DY, Schubert T. 1998. Use of short inter‐trial intervals in single‐trial experiments: a 3T fMRI study. Neuroimage 8:327–339. [DOI] [PubMed] [Google Scholar]
- Rogers RD, Monsell S. 1995. Cost of a predictable switch between simple cognitive tasks. J Exp Psychol: Hum Percept Perform 124:207–231. [Google Scholar]
- Talairach J, Tournoux P. 1988. Co‐planar stereotactic atlas of the human brain. Stuttgart: Thieme. [Google Scholar]
- Zarahn E, Aguirre G, D'Esposito M. 1997. A trial‐based experimental design for fMRI. Neuroimage 6:122–138. [DOI] [PubMed] [Google Scholar]