

Abstract
One of the principal functions of the nervous system is to synthesize information from multiple sensory channels into a coherent behavioral and perceptual gestalt. A critical feature of this multisensory synthesis is the sorting and coupling of information derived from the same event. One of the singular features of stimuli conveying such information is their contextual or semantic congruence. Illustrating this fact, subjects are typically faster and more accurate when performing tasks that include congruent compared to incongruent cross‐modal stimuli. Using functional magnetic resonance imaging, we demonstrate that activity in select brain areas is sensitive to the contextual congruence among cross‐modal cues and to task difficulty. The anterior cingulate gyrus and adjacent medial prefrontal cortices showed significantly greater activity when visual and auditory stimuli were contextually congruent (i.e., matching) than when they were nonmatching. Although activity in these regions was also dependent on task difficulty, showing decreased activity with decreasing task difficulty, the activity changes associated with stimulus congruence predominated. Hum. Brain Mapping 19:213–223, 2003. © 2003 Wiley‐Liss, Inc.
Keywords: fMRI, cerebral cortex, vision, audition, multisensory
INTRODUCTION
Although the different sensory modalities are readily identified by the specificity of their peripheral organs and the pathways by which these organs access the brain, our perception is known to be markedly affected by interactions among the senses [Stein and Meredith, 1993]. The nature of these cross‐modal stimuli and their relationship to one another are important determinants of these interactions. For example, cross‐modal stimuli that originate from the same place at the same time and carry semantically related information typically result in speeded responses and improved response accuracy [Andreassi and Greco, 1975; Bernstein et al., 1969; Frens et al., 1995; Gielen et al., 1983; Goldring et al., 1996; Harrington and Peck, 1998; Hershenson, 1962; Hughes et al., 1994; Nozawa et al., 1994; Perrott et al., 1990; Stein et al., 1988]. These behavioral facilitations can exceed those predicted by theories of probability summation [Miller, 1982; Raab, 1962], suggesting a neural integration of multisensory information. Consistent with this, neural activity is enhanced under similar circumstances [Calvert et al., 2000; Calvert et al., 2001; Macaluso et al., 2000; Meredith and Stein, 1986a, b; Meredith et al., 1987; Stein and Meredith, 1993].
On the other hand, when multisensory stimuli are spatially or temporally incongruent, behavioral responses can be significantly degraded [Frens et al., 1995; Stein et al., 1988] and neural activity can be significantly depressed [Calvert et al., 2000, 2001; Frens and Van Opstal, 1998; Jiang et al., 2001; Kadunce et al., 1997; Macaluso et al., 2000; Meredith and Stein, 1986a, b; Meredith et al., 1987; Stein and Meredith, 1993; Wallace et al., 1996]. Despite the potent influence of temporal and spatial cross‐modal stimulus congruence on multisensory processes and the extensive data on such processes in animals [Stein and Meredith, 1993], other than observations on speech perception [Calvert et al., 2000; Calvert, 2001; Raij et al., 2000], we remain largely ignorant of the areas of the human brain sensitive to semantic or contextual congruence between multiple sensory cues. Identifying such areas was the primary objective of the present experiments.
SUBJECTS AND METHODS
Subjects
Sixteen adult volunteers (mean age 32 years, 15 right‐handed, 7 women) with self‐reported normal hearing and normal or corrected‐to‐normal vision participated. To reduce confounds related to caffeine consumption, all subjects were instructed to maintain their usual caffeine consumption [Laurienti et al., 2002b]. After receiving an explanation of the scanning procedure, subjects gave written informed consent. The Wake Forest University School of Medicine Internal Review Board for Human Subjects approved this study.
Stimulation paradigm
Subjects were presented with paired visual and auditory stimuli, which were either matching (the stimuli contained contextually congruent information) or not matching (the stimuli contained contextually incongruent information). The stimuli were presented through MR compatible visual display goggles and headphones (Resonance Technologies, online at http://www.mrivideo.com). A total of 60 visual stimuli consisted of ClipArt (Microsoft, Redmond, WA) pictures of various objects or scenes, such as a submarine, an alarm clock, a cow, and a tennis match. The sound clips were chosen to match each visual stimulus. Examples that matched the visual stimuli listed above include a sonar ping, an alarm clock, a cow's moo, and the sound of a tennis racket hitting a ball. For the nonmatching condition, each of the visual stimuli was randomly paired with one of the nonmatching auditory stimuli. The same nonmatching pairings were used for all subjects. The visual stimuli were presented in the center of the display screen, and although the pictures differed in absolute size, each covered approximately 25% of the display screen. The volume of the headset was adjusted for each subject during a prescanning period to ensure that the stimuli could be heard above the noise made by the MR scanner.
The visual stimuli were displayed for 2 sec with a 3‐sec inter‐stimulus interval (ISI). The auditory stimuli were matched in time with the visual stimuli. The stimuli were presented in random order in an epoch‐based paradigm consisting of 30‐sec periods during which the visual and auditory stimuli matched (congruent condition) alternating with 30‐sec periods during which the stimuli did not match (incongruent condition). Two runs, each consisting of 5 matching and 5 nonmatching stimulation blocks, were performed. To ensure focused attention on the visual stimuli, subjects were instructed to press a response button with their index finger if they encountered the object or scene displayed in the picture on a weekly basis. If they did not encounter the object or scene in the visual display on a weekly basis, they were instructed to press a button with their middle finger. Although the stimuli were presented in matching and nonmatching blocks, the task remained the same throughout the duration of the experiment. The subjects were told that sounds would be presented throughout the study but that they should ignore the sounds and respond only to the pictures. It should be noted that no “resting” baseline was used for the current experiments. Furthermore, unimodal tasks were not performed as part of the current study. In a preliminary behavior study, many of the auditory stimuli were difficult to identify in the absence of a visual stimulus. A stimulus‐timing program (E‐Prime; Psychology Software Tools, online at http://www.pstnet.com) controlled all stimulus presentations and was used to record response times (RT). A debriefing period followed the scanning session.
fMRI image acquisition
All imaging experiments were performed on a 1.5‐T GE echo‐speed Horizon LX MR scanner with a birdcage headcoil (GE Medical Systems, Milwaukee, WI). Whole‐brain activation was assessed by examining blood oxygenation level‐dependent (BOLD) changes [Buchbinder and Cosgrove, 1998; Turner et al., 1998] by measuring changes in the T2*‐relaxation rate caused by the changes in blood oxygenation that accompany cortical activation [Ogawa et al., 1990, 1993]. Functional imaging was performed in the axial plane using multislice gradient‐echo echo planar imaging with a field of view of 24 cm (frequency) × 15 cm (phase), and an acquisition matrix of 64 × 40 (28 slices, 5 mm thickness, no skip, TR = 2,500, TE = 40). This sequence delivered an effective voxel resolution of 3.75 × 3.75 × 5 mm. The fMRI raw echo amplitudes were saved and transferred to a SUN Ultrasparc workstation (SUN Microsystems, Mountain View, CA) for off‐line reconstruction using software developed in IDL (Research Systems, Boulder, CO).
Anatomical image acquisition
High‐resolution structural scans were obtained using a 3D spoiled gradient echo (3DSPGR) sequence with the following parameters: matrix, 256 × 256; field of view, 24 cm; section thickness, 3 mm with no gap between sections; number of sections, 60; in‐plane resolution, 0.94 mm. This sequence was used both for anatomic overlays of the functional data, as well as for spatial normalization of the data sets to a standard atlas. The T1‐weighted images were normalized to a standard template in MNI coordinate space within SPM99. All data are presented in neurological format with the right side of the brain presented on the right.
Functional image analysis
Statistical parametric maps (SPMs) were generated using SPM99 (Wellcome Department of Cognitive Neurology, London, UK) [Friston et al., 1995b, c] implemented in Matlab (Mathworks Inc., Sherborn, MA), with an IDL interface. Correction for image distortion and alternate k‐space line errors was performed on each image on the basis of data acquired during phase‐encoded reference imaging [Alsop, 1995].
The functional data sets were motion corrected (intra‐run realignment) within SPM99 using the first image as the reference [Friston et al., 1995a]. The functional data sets were normalized to Montreal Neurological Institute (MNI) space using image header information to determine the 16‐parameter affine transform between the functional data sets and the T1‐weighted images [Maldjian et al., 1997] in combination with the transform computed within SPM99 for the T1‐weighted anatomic images to MNI space [Friston et al., 1995a]. The normalized data sets were resampled to 4 × 4 × 5 mm within MNI space using sync interpolation. A second realignment step (inter‐run realignment) was then performed between successive normalized runs within each subject using the initial normalized run as the target. This was done to eliminate motion between the successive runs within each subject. The data sets were then smoothed using an 8 × 8 × 10 mm full‐width at half‐maximum Gaussian smoothing kernel.
SPMs were generated using the general linear model within SPM99. The data were modeled with a boxcar design including an explicit baseline model convolved with the hemodynamic response function (HRF). All data were globally normalized with proportional scaling of the image means. Temporal smoothing and detrending were performed as part of the SPM analysis. High‐pass filtering was used with a cut‐off at twice the period (120 sec). Data from all subjects were processed individually using a fixed effects analysis to combine the two runs. The weighted parameter estimates from each subject generated using the fixed effects analyses were combined in a one‐sample t‐test.
Upon evaluation of response times, it was noted that there was a linear relationship between the BOLD signal change and response times (RT); thus, there were changes in two dependent variables related to our experimental condition. Therefore, an analysis of covariance (ANCOVA) was performed to determine if BOLD signal changes due to cross‐modal congruence remained or whether they were abolished after adjusting for changes in RT [Snedecor and Cochran, 1989]. The variate and covariate in the ANCOVA analysis were orthogonal, resulting in an estimatable design. However, due to the linear relationship between the BOLD signal change and RT, the results from the ANCOVA should be interpreted with caution. The ANCOVA was performed using data from 12 of the 16 subjects, as RTs from the first 4 subjects were not collected during the nonmatching condition.
All SPMs were generated using random‐effects models and were thresholded at a P < 0.005 and corrected for spatial extent (P < 0.05) using the theory of gaussian fields as implemented in SPM99 [Friston et al., 1994; Worsley et al., 1996]. Anatomic regions were defined automatically using an anatomic MRI atlas [Kikinis et al., 1996] that we previously normalized to the MNI‐SPM template for use with our fMRI data. All coordinates reported in this study have been converted from MNI space to Talairach coordinate system [Talairach and Tournoux, 1988] using a non‐linear transform [Duncan et al., 2000], and Brodmann areas (BA) were determined for activated regions using the Talairach Daemon [Lancaster et al., 2000].
RESULTS
The data from all 16 subjects were combined in a random effects analysis to identify differential regional activation between the matching (congruent) and nonmatching (incongruent) cross‐modal conditions. After correction for multiple comparisons, one activation cluster was identified that exhibited greater activity during the matching condition compared to the nonmatching condition (Fig. 1). This area was located in the anterior cingulate/medial prefrontal cortex (ACG/MPC). The activation cluster was located predominantly in the left hemisphere and encompassed 146 voxels, and the peak was located in the medial aspect of the superior frontal gyrus (see Table I). A similar evaluation of the regional activity that was greater during the nonmatching condition compared to the matching condition also revealed one significant cluster (Fig. 2), which was located in the right ventral visual cortex, spanning the cuneus, lingual, and fusiform gyri (Table I). Activation was also noted to be greater in the left ventral visual pathway and bilaterally in the frontal eye fields during the nonmatching condition, but those areas did not survive correction for multiple comparisons.
Figure 1.
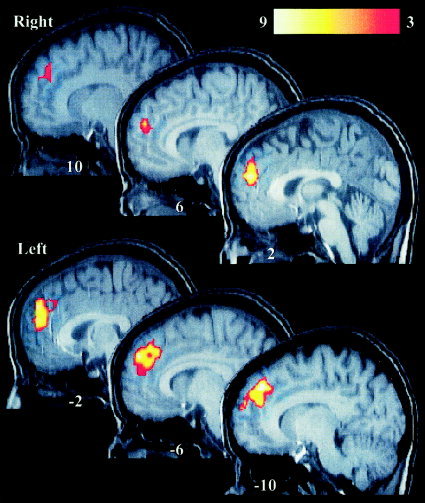
Areas showing significantly greater activation during the matching condition when compared to the nonmatching condition. Top: Sagittal slices from the right hemisphere. Bottom: Slices from the left hemisphere. The y coordinate in Talairach space is labeled on each section. The color calibration bar represents the T score for all sections. All activation maps in this and subsequent figures are in neurological space and are overlaid on a typical T1‐weighted image that has been normalized to Talairach space.
Table I.
Location of clusters of activation derived from the three different analyses
| Brain regions | BA | Peak voxel | Size | |||
|---|---|---|---|---|---|---|
| x | y | z | T Score | |||
| 16 Subject random effects | ||||||
| (a) Matching vs. nonmatching Medial superior frontal and anterior cingulate gyri | 6, 8, 9, 10, 32 | −16 | 41 | 35 | 5.8 | 146 |
| (b) Nonmatching vs. matching Lingual, fusiform, cuneus, inferior and middle occipital | 17, 18, 19 | 28 | −78 | 0 | 5.3 | 127 |
| 12 Subject random effects | ||||||
| (a) Matching vs. nonmatching Medial superior frontal | 9, 10 | −12 | 47 | 16 | 5.7 | 73 |
| (b) Nonmatching vs. matching Lingual, fusiform (left) | 37 | −28 | −62 | −5 | 7 | 41 |
| Lingual, cuneus, inferior occipital, middle occipital (right) | 17, 18, 19 | 28 | −70 | −5 | 5.1 | 51 |
| 12 Subject ANCOVA | ||||||
| (a) Matching vs. nonmatching Medial superior frontal and anterior cingulate gyri | 6, 9, 10, 11, 32 | −8 | 47 | 16 | 8.1 | 181 |
| (b) Nonmatching vs. matching Lingual, fusiform (left) | 37 | −28 | −62 | −5 | 6.7 | 39 |
| Lingual, cuneus, fusiform, inferior and middle occipital (right) | 17, 18, 19 | 28 | −70 | −5 | 5.1 | 45 |
| (c) Activations attributed to increased RT difference Medial superior frontal and anterior cingulate gyri | 6, 9, 10, 32 | −8 | 47 | 16 | 5.9 | 60 |
The anatomic brain regions, Brodmann's Areas (BA), and size of each cluster are listed with the Talairach coordinates and T score for the peak voxel.
Figure 2.
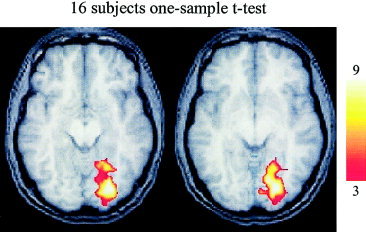
Areas showing significantly greater activation during the nonmatching condition compared to the matching condition. The large cluster is located in the ventral visual cortex on the right. A region of activity was present in a similar location on the left but did not survive correction for multiple comparisons. The axial slices are located at z = −8 and z = −2 from left to right. The color calibration bar represents the T score magnitude.
In 12 of the subjects, an analysis of the RTs from the matching and nonmatching conditions was performed to determine if the matching condition resulted in behavioral enhancement (speeded responses). Subjects were, in fact, significantly (one‐tailed paired t‐test, P = 0.02) faster at responding to the visual stimuli during the matching condition (mean matching RT 867 ± 25 msec; mean nonmatching RT 892 ± 26 msec). To correct for this significant difference in behavior between the two conditions, which might manifest as a difference in activation due to behavioral rather than stimulus‐dependent effects, an ANCOVA was performed on the fMRI data that included the difference in response time for each subject. For comparison, a random effects one‐sample t‐test was also performed on the same 12 subjects. This allowed for direct comparison of the activation patterns with and without the inclusion of RT as a nuisance regressor.
Without accounting for RT, the activation patterns in the 12 subjects were very similar to the initial data (Fig. 3A). Regional activity that was greater during the matching condition compared to the nonmatching condition was located in the region of the ACG/MPC, although the activation cluster was smaller than that seen in the 16‐subject analysis.
Figure 3.
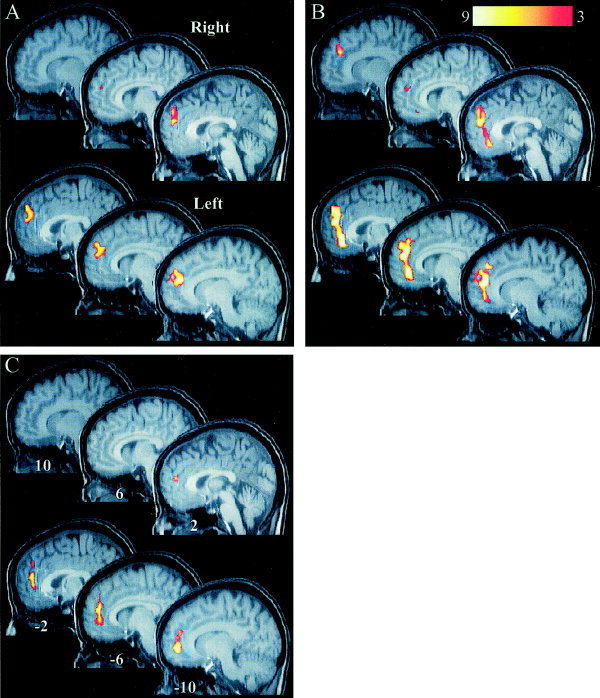
Areas of significant difference in activation between matching and nonmatching conditions from the 12 subject analyses. A: Activation maps from the one‐sample t‐test identified regions of differential activation in the prefrontal cortex just superior to the anterior cingulate gyrus. B: Activation maps corrected for RT differences (ANCOVA analysis) identified more extensive regions of differential activation that encompassed both the medial prefrontal and anterior cingulate cortices. C: Activation maps for the ANCOVA identifying regions whose changes in activity can be attributed to decreased response times (match RT–nonmatch RT). This area of activity is focused in the inferior aspect of the anterior cingulate gyrus. Top: Sagittal sections from the right hemisphere. Bottom: Sections from the left hemisphere. The color calibration bar shown in B applies to all images and represents the T score magnitude. The y coordinate in Talairach space is labeled on each section in C and applies to all figures.
Removing the variance associated with changes in RT by using the ANCOVA analysis [Snedecor and Cochran, 1989] resulted in an increase in the area of activation in the ACG/MPC (Fig. 3B). This cluster of activation increased from 73 voxels in the one‐sample t‐test to 181 voxels in the ANCOVA analysis to include a much more extensive portion of the ACG. In addition, the peak T score increased from 5.7 to 8.1 (see Table I), but the location of the peak was essentially the same, only shifting to an adjacent voxel (see Table I). The ACG/MPC exhibited activity increases during the matching cross‐modal condition and activity decreases during speeded responses. Since subjects' responses were fastest during the matching condition, “subtraction” of the changes attributed to speeded responses revealed an even greater increase in the signal attributed to the matching cross‐modal condition. In fact, the map showing that the regional activity decreases were correlated with speeded responses (Fig. 3C), demonstrates that the area of correlation overlaps a large portion of the regional activity associated with the matching condition.
A plot of the RT difference (matching RT–nonmatching RT) and the magnitude of the BOLD response in the peak voxel (−12, 48, 20) for each subject revealed that the signal in this region increased as differences in RT increased (Fig. 4A). This represents an increase in the BOLD signal as the RT for the matching condition increased relative to the nonmatching condition. The correlation between the signal attributed to RT and the actual RT difference from each subject (Fig. 4B) improved when comparing the results from the ANCOVA analysis (r2 = 0.65) to the one‐sample t‐test (r2 = 0.2). Since the variance attributed to RT was removed in the ANCOVA analysis, the signal attributed to the matching cross‐modal condition no longer correlated with RT (Fig. 4C).
Figure 4.
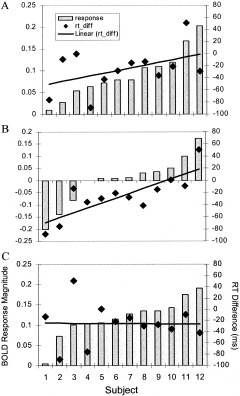
Bold response magnitude and RT difference plots for the 12 subject analyses. The response plots (left axes) are displayed in normalized, arbitrary units. The RT difference plots (rt_diff) refer to the right axes and are in msec. A: Plots of the response magnitude (match–nonmatch) from the peak voxel in the ACG generated from the one‐sample t‐test are arranged in ascending order. The RT difference for each subject is shown in the same column as the response magnitude. The linear regression through the rt_diff data is shown as the solid black line (R2 = 0.2). B: The response magnitude plots represent the response attributed to the difference in RT (match RT–nonmatch RT) from the ANCOVA. The data have been arranged in ascending order by response magnitude (note that the subject order changes for each of the plots). The linear regression through the rt_diff data exhibits a better fit with R2 increasing to 0.65. C: Plots of the response magnitude (match–nonmatch) from the peak voxel in the ACG generated from ANCOVA. Following removal of the variance attributed to the difference in RT, the response magnitude no longer correlated with the rt_diff. All subjects exhibited an increase in response in the ACG during matching compared to nonmatching with an increase in the magnitude of response across the group.
Regional activity that was greater during the nonmatching condition compared to the matching condition identified in the 12‐subject analysis using the one‐sample t‐test was located in the right and left inferior, ventral visual cortices (Fig. 5). Activation maps showing areas that exhibited greater activity during the nonmatching condition compared to the matching condition generated using the ANCOVA (Fig. 5) were nearly identical to the one‐sample t‐test, except that the focus of activation in the left visual cortex failed to survive correction for multiple comparisons in the 16 subject analysis.
Figure 5.
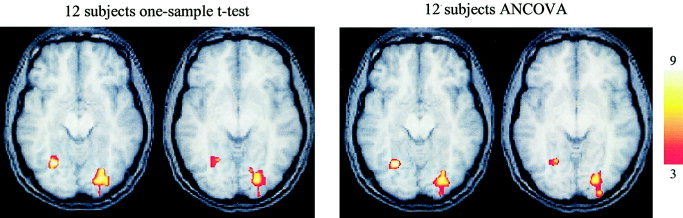
Areas showing significantly greater activation during the nonmatching condition from the 12 subject analyses. The bilateral activation in the ventral visual cortex was observed in both analyses. The activity on the right is located in the same region as observed in the 16 subject analysis. The activity on the left survived correction for multiple comparisons in both 12‐subject analyses but did not survive in the 16‐subject analysis. The axial slices are located at z = −5 and z = 39 from left to right for each analysis. The color calibration bar applies to all images and represents the T score magnitude.
DISCUSSION
We demonstrated that the ACG/MPC and the ventral visual cortices exhibit differential activity, as measured by the BOLD response, during pairing of congruent and incongruent cross‐modal stimuli. ACG/MPC activity was enhanced when the stimulus pairs were congruent or matching, such that the coupling of a visual image of a cow with the sound of a cow mooing evoked a substantially greater BOLD response than did a picture of a cow coupled with the sound of a baby crying. This observation is consistent with the idea that these brain areas are tuned to the selection of meaningful stimuli even when such stimuli are derived from different sensory channels. That the ACG is a multisensory area is supported by studies demonstrating its involvement in the processing of visual [Banati et al., 2000; Klingberg and Roland, 1998; Lewis et al., 2000; Naito et al., 2000], auditory [Klingberg and Roland, 1998; Lewis et al., 2000; Naito et al., 2000], tactile [Banati et al., 2000], olfactory [Royet et al., 2000], and nociceptive stimuli [Coghill et al., 1999; Derbyshire et al., 1998; Vogt et al., 1996; Vogt and Sikes, 2000]. The ACG has been implicated not only in the detection of events within these sensory modalities, but also in selective responses to salient events [Downar et al., 2002]. Its activity has been shown to be greatest in response to cross‐modal as compared to within‐modal stimuli [Banati et al., 2000]. Furthermore, lesion studies in monkeys have shown that ablations of the anterior portion of the ACG/MPC disrupt cross‐modal matching, whereas lesions of other cross‐modal brain areas, including the dorsolateral prefrontal cortex and intraparietal sulcus, do not [Aitken, 1980].
When using a paradigm that compares matching and nonmatching conditions, one must consider effects that may be due to interference during the nonmatching condition, which could produce spurious changes in the BOLD responses when comparing the matching and nonmatching conditions. For example, the Stroop task results in interference when subjects attempt to state the color of ink that a word is printed in if the word spells a color different from the ink [Stroop, 1935]. Consistent with such interference, reaction times in the present experiments were longer during the nonmatching than the matching condition. However, in contrast to the activation patterns characteristic of the Stroop task, where activity in the ACG/MPC is greater during nonmatching conditions [Botvinick et al., 1999; Bunge et al., 2001; Bush et al., 1998; Carter et al., 1998], in the current study, activation of the ACG/MPC was greater during the matching conditions. The finding of increased activity in the ACG/MPC during congruent cross‐modal stimulation is consistent with the findings of a recent study in which increased activity in the ACG was noted during the non‐interference (i.e., “congruent”) component of an orthographic‐phonologic task [de Zubicaray et al., 2002].
In a more global context, interference tasks are also associated with increased reaction times during the presentation of incongruent stimuli. However, for such tasks the linkage between reaction time changes and ACG activity is less clear, and may be specific to the task employed [Badgaiyan and Posner, 1998]. Thus, whereas some studies report that increasing RT is associated with increases in ACG activity [Banati et al., 2000; Buckner et al., 1996; Bunge et al., 2001; Klingberg and Roland, 1997], others report decreases in ACG activity [Badgaiyan et al., 1999; Naito et al., 2000; Petersen et al., 1998]. The task used in the current study produced speeded responses and increases in ACG/MPC activity during the congruent condition when compared to the incongruent condition. A one‐sample t‐test was unable to demonstrate if the observed changes in ACG/MPC activity were associated with the stimulus congruence, speed responses, or both. To resolve this issue, we performed an ANCOVA analysis to remove activity changes associated with speeded responses from activity changes associated with cross‐modal stimulus congruence. Using this analysis, we found that activity in the ACG/MPC was directly sensitive to auditory‐visual stimulus congruence and increased during congruent compared to incongruent stimulation. However, ACG/MPC activity was also associated with changes in response time. As RTs decreased (i.e., task difficulty decreased), activity in ACG/MPC also decreased. When such changes in RT were taken into account, the predominant effect was driven by stimulus congruence/incongruence, such that activity changes associated with cross‐modal stimulus congruence actually increased.
The observation that activity in the ACG/MPC was greater during congruent cross‐modal stimulation than during incongruent stimulation is consistent with the principles of cross‐modal integration identified at the single neuron level [Stein and Meredith, 1993] and further shown to be applicable to fMRI measures [Calvert et al., 2001]. It is also consistent with modulations in attentiveness, as the ACG is known to play an important role in attentional processing [Posner and Rothbart, 198]. Although subjects performed the same task regardless of the stimulus condition, and many subjects were unaware that the congruent and incongruent conditions were alternated, it is possible that the congruent stimulus conditions more effectively accessed attentional networks. In fact, a recent study reported that covert attention to an auditory stimulus can result in increased activity in the ACG [Benedict et al., 2002]. It remains to be seen whether these results can be generalized to within‐modal stimulus pairs (i.e., that “congruence” per se is the selective stimulus feature dealt with by these brain areas).
Because no resting baseline was used in the present study, it is not possible to determine if the effects observed were due to differences in BOLD signal increases or decreases. Although not measured directly in the present experiments, the cross‐modal congruent condition is likely to have increased the BOLD signal from a visual alone baseline level. Previous studies of linguistically‐relevant cross‐modal stimuli have shown that congruent stimulus pairs (lip movements and spoken words) increased the BOLD response above the sum of the two modality‐specific stimuli, whereas incongruent stimulus pairs degraded the BOLD response below that of the least effective modality‐specific stimulus [Calvert et al., 2000]. Similar observations have been made at the behavioral level where spatially congruent (i.e., coincident) visual and auditory stimuli evoked the most rapid and accurate orientation responses, but nonspatially congruent stimuli yielded responses at or below those seen to the best modality‐specific stimulus [Frassinetti et al., 2002; Frens et al., 1995; Stein et al., 1988]. It is interesting to note that although multiple studies have identified multisensory activation in regions of the human cortex, such as portions of the sensory specific cortices [Foxe et al., 2000; Kawashima et al., 1995; Laurienti et al., 2002a; Macaluso et al., 2000; Shams et al., 2001], anterior cingulate [Banati et al., 2000], the intraparietal sulcus [Macaluso et al., 2000; Macaluso and Driver, 2001; Macaluso et al., 2002], and the claustrum and insula [Ettlinger and Wilson, 1990; Hadjikhani and Roland, 1998], these studies did not evaluate the effect of stimulus congruence on these areas.
That the activity observed here in sensory‐specific visual processing regions was also modulated by nonvisual cues is consistent with many prior reports [Calvert et al., 1997, 1999; Foxe et al., 2000; Giard and Peronnet, 1999; Laurienti et al., 2002a; Macaluso et al., 2000; Oray et al., 2002; Sams et al., 1991]. This effect was particularly evident in the incongruent condition, presumably, because the nonmatching auditory stimulus provided conflicting information, thereby requiring subjects to spend more time evaluating the image prior to making their decision. The increase in processing and scanning of the image may account for the increased activation patterns observed. In addition, these effects in visual cortex may be due to changes in the level of attention dedicated to the auditory stimulus in the matching and nonmatching conditions. Attention to one sensory modality has been shown to modulate activity in the cortex for another sensory modality [Kawashima et al., 1999; O'Leary et al., 1997; Woodruff et al., 1996]. However, in the present experiment, the cross‐modal effects observed were limited to visual areas. Auditory cortices showed no differential responses to the matching and nonmatching cross‐modal stimuli. The basis for this difference is likely to be related to the use of the visual stimulus as a target and the auditory stimulus as a modulator.
CONCLUSIONS
ACG/MCP are differentially activated by cross‐modal congruent and incongruent stimuli. Their activity is highest in response to congruent cross‐modal stimuli, and the magnitude of that enhanced activity is directly related to task difficulty. Thus, as task difficulty goes up (i.e., RT slows), activity also increases. Thus, the present experiments reveal that two factors determine the level of activity in these areas: the coherence of the cross‐modal stimulus pair and the difficulty of identifying the cross‐modal event.
REFERENCES
- Aitken PG (1980): Lesion effects on tactual to visual cross‐modal matching in the rhesus monkey. Neuropsychologia 18: 575–578. [DOI] [PubMed] [Google Scholar]
- Alsop DC (1995): Correction of ghost artifacts and distortion in echo‐planar mr‐imaging with an iterative image‐reconstruction technique. Radiology 197: 388–388. [Google Scholar]
- Andreassi JL, Greco JR (1975): Effects of bisensory stimulation on reaction time and the evoked cortical potential. Physiol Psychol 3: 189–194. [Google Scholar]
- Badgaiyan RD, Posner MI (1998): Mapping the cingulate cortex in response selection and monitoring. Neuroimage 7: 255–260. [DOI] [PubMed] [Google Scholar]
- Badgaiyan RD, Schacter DL, Alpert NM (1999): Auditory priming within and across modalities: Evidence from positron emission tomography. J Cogn Neurosci 11: 337–348. [DOI] [PubMed] [Google Scholar]
- Banati RB, Goerres GW, Tjoa C, Aggleton JP, Grasby P (2000): The functional anatomy of visual‐tactile integration in man: a study using positron emission tomography. Neuropsychologia 38: 115–124. [DOI] [PubMed] [Google Scholar]
- Benedict RHB, Shucard DW, Santa Maria MP, Shucard JL, Abara JP, Coad ML, Wack D, Sawusch J, Lockwood A (2002): Covert auditory attention generates activation in the rostral/dorsal anterior cingulate cortex. J Cogn Neurosci 14: 637–645. [DOI] [PubMed] [Google Scholar]
- Bernstein IH, Clark MH, Edelstein BA (1969): Effects of an auditory signal on visual reaction time. J Exp Psychol 80: 567–569. [DOI] [PubMed] [Google Scholar]
- Botvinick MM, Nystrom LE, Carter CS, Cohen JD (1999): Conflict monitoring versus selection‐for‐action in anterior cingulate cortex. Nature 402: 197–181. [DOI] [PubMed] [Google Scholar]
- Buchbinder BR, Cosgrove GR (1998): Cortical activation mr studies in brain disorders. Magn Reson Imaging Clin N Am 6: 67–93. [PubMed] [Google Scholar]
- Buckner RL, Raichle ME, Miezin FM, Petersen SE (1996): Functional anatomic studies of memory retrieval for auditory words and visual pictures. J Neurosci 16: 6219–6235. [DOI] [PMC free article] [PubMed] [Google Scholar]
- Bunge SA, Ochsner KN, Desmond JE, Glover GH, Gabrieli JD (2001): Prefrontal regions involved in keeping information in and out of mind. Brain 124: 2074–2086. [DOI] [PubMed] [Google Scholar]
- Bush G, Whalen PJ, Rosen BR, Jenike MA, McInerney SC, Rauch SL (1998): The counting stroop: An interference task specialized for functional neuroimaging: validation study with functional mri. Hum Brain Mapp 6: 270–282. [DOI] [PMC free article] [PubMed] [Google Scholar]
- Calvert GA (2001): Crossmodal processing in the human brain: Insights from functional neuroimaging studies. Cereb Cortex 11: 1110–1123. [DOI] [PubMed] [Google Scholar]
- Calvert GA, Bullmore ET, Brammer MJ, Campbell R, Williams SC, McGuire PK, Woodruff PW, Iversen SD, David AS (1997): Activation of auditory cortex during silent lipreading. Science 276: 593–596. [DOI] [PubMed] [Google Scholar]
- Calvert GA, Brammer MJ, Bullmore ET, Campbell R, Iversen SD, David AS (1999): Response amplification in sensory‐specific cortices during crossmodal binding. Neuroreport 10: 2619–2623. [DOI] [PubMed] [Google Scholar]
- Calvert GA, Campbell R, Brammer MJ (2000): Evidence from functional magnetic resonance imaging of crossmodal binding in the human heteromodal cortex. Curr Biol 10: 649–657. [DOI] [PubMed] [Google Scholar]
- Calvert GA, Hansen PC, Iversen SD, Brammer MJ (2001): Detection of audio‐visual integration sites in humans by application of electrophysiological criteria to the bold effect. Neuroimage 14: 427–438. [DOI] [PubMed] [Google Scholar]
- Carter CS, Braver TS, Barch DM, Botvinick MM, Noll D, Cohen JD (1998): Anterior cingulate cortex, error detection, and the online monitoring of performance. Science 280: 747–749. [DOI] [PubMed] [Google Scholar]
- Coghill RC, Sang CN, Maisog JM, Iadarola MJ (1999): Pain intensity processing within the human brain: A bilateral, distributed mechanism. J Neurophysiol 82: 1934–1943. [DOI] [PubMed] [Google Scholar]
- Derbyshire SW, Vogt BA, Jones AK (1998): Pain and stroop interference tasks activate separate processing modules in anterior cingulate cortex. Exp Brain Res 118: 52–60. [DOI] [PubMed] [Google Scholar]
- de Zubicaray G, McMahon K, Eastburn M, Wilson S (2002): Orthographic/phonological facilitation of naming responses in the picture‐word task: An event‐related fmri study using overt vocal responding. Neuroimage 16: 1084. [DOI] [PubMed] [Google Scholar]
- Downar J, Crawley AP, Mikulis DJ, Davis KD (2002): A cortical network sensitive to stimulus salience in a neutral behavioral context across multiple sensory modalities. J Neurophysiol 87: 615–620. [DOI] [PubMed] [Google Scholar]
- Duncan J, Seitz RJ, Kolodny J, Bor D, Herzog H, Ahmed A, Newell FN, Emslie H (2000): A neural basis for general intelligence. Science 289: 457–460. [DOI] [PubMed] [Google Scholar]
- Ettlinger G, Wilson WA (1990): Cross‐modal performance: Behavioural processes, phylogenetic considerations and neural mechanisms. Behav Brain Res 40: 169–192. [DOI] [PubMed] [Google Scholar]
- Foxe JJ, Morocz IA, Murray MM, Higgins BA, Javitt DC, Schroeder CE (2000): Multisensory auditory‐somatosensory interactions in early cortical processing revealed by high‐density electrical mapping. Brain Res Cogn Brain Res 10: 77–83. [DOI] [PubMed] [Google Scholar]
- Frassinetti F, Pavani F, Ladavas E (2002): Acoustical vision of neglected stimuli: Interaction among spatially converging audiovisual inputs in neglect patients. J Cogn Neurosci 14: 62–69. [DOI] [PubMed] [Google Scholar]
- Frens MA, Van Opstal AJ (1998): Visual‐auditory interactions modulate saccade‐related activity in monkey superior colliculus. Brain Res Bull 46: 211–224. [DOI] [PubMed] [Google Scholar]
- Frens MA, Van Opstal AJ, Van der Willigen RF (1995): Spatial and temporal factors determine auditory‐visual interactions in human saccadic eye movements. Percept Psychophys 57: 802–816. [DOI] [PubMed] [Google Scholar]
- Friston KJ, Worsley KJ, Frackowaik RSJ, Mazziotta JC, Evans AC (1994): Assessing the significance of focal activations using their spatial extent. Hum Brain Mapp 1: 210–220. [DOI] [PubMed] [Google Scholar]
- Friston KJ, Ashburner J, Poline J, Frith C, Heather J, Frackowaik RSJ (1995a): Spatial registration and normalization of images. Hum Brain Mapp 2: 165–189. [Google Scholar]
- Friston KJ, Frith CD, Frackowiak RS, Turner R (1995b): Characterizing dynamic brain responses with fmri: A multivariate approach. Neuroimage 2: 166–172. [DOI] [PubMed] [Google Scholar]
- Friston KJ, Frith CD, Turner R, Frackowiak RS (1995c): Characterizing evoked hemodynamics with fmri. Neuroimage 2: 157–165. [DOI] [PubMed] [Google Scholar]
- Giard MH, Peronnet F (1999): Auditory‐visual integration during multimodal object recognition in humans: A behavioral and electrophysiological study. J Cogn Neurosci 11: 473–490. [DOI] [PubMed] [Google Scholar]
- Gielen SC, Schmidt RA, Van den Heuvel PJ (1983): On the nature of intersensory facilitation of reaction time. Percept Psychophys 34: 161–168. [DOI] [PubMed] [Google Scholar]
- Goldring JE, Dorris MC, Corneil BD, Ballantyne PA, Munoz DP. 1996. Combined eye‐head gaze shifts to visual and auditory targets in humans. Exp Brain Res 111: 68–78. [DOI] [PubMed] [Google Scholar]
- Hadjikhani N, Roland PE. 1998. Cross‐modal transfer of information between the tactile and the visual representations in the human brain: A positron emission tomographic study. J Neurosci 18: 1072–1084. [DOI] [PMC free article] [PubMed] [Google Scholar]
- Harrington LK, Peck CK (1998): Spatial disparity affects visual‐auditory interactions in human sensorimotor processing. Exp Brain Res 122: 247–252. [DOI] [PubMed] [Google Scholar]
- Hershenson, M . 1962. Reaction time as a measure of intersensory facilitation. J Exp Psychol 63: 289–293. [DOI] [PubMed] [Google Scholar]
- Hughes HC, Reuter‐Lorenz PA, Nozawa G, Fendrich R (1994): Visual‐auditory interactions in sensorimotor processing: Saccades versus manual responses. J Exp Psychol Hum Percept Perform 20: 131–153. [DOI] [PubMed] [Google Scholar]
- Jiang W, Wallace MT, Jiang H, Vaughan JW, Stein BE (2001): Two cortical areas mediate multisensory integration in superior colliculus neurons. J Neurophysiol 85: 506–522. [DOI] [PubMed] [Google Scholar]
- Kadunce DC, Vaughan JW, Wallace MT, Benedek G, Stein BE (1997): Mechanisms of within‐ and cross‐modality suppression in the superior colliculus. J Neurophysiol 78: 2834–2847. [DOI] [PubMed] [Google Scholar]
- Kawashima R, O'Sullivan BT, Roland PE (1995): Positron‐emission tomography studies of cross‐modality inhibition in selective attentional tasks: Closing the “mind's eye”. Proc Natl Acad Sci U S A 92: 5969–5972. [DOI] [PMC free article] [PubMed] [Google Scholar]
- Kawashima R, Imaizumi S, Mori K, Okada K, Goto R, Kiritani S, Ogawa A, Fukuda H (1999): Selective visual and auditory attention toward utterances‐a pet study. Neuroimage 10: 209–215. [DOI] [PubMed] [Google Scholar]
- Kikinis R, Gleason PL, Moriarty TM, Moore MR, Alexander E 3rd, Stieg PE, Matsumae M, Lorensen WE, Cline HE, Black PM, Jolesz FA (1996): Computer‐assisted interactive three‐dimensional planning for neurosurgical procedures. Neurosurgery 38: 640–649; discussion 649–651. [PubMed] [Google Scholar]
- Klingberg T, Roland PE (1997): Interference between two concurrent tasks is associated with activation of overlapping fields in the cortex. Brain Res Cogn Brain Res 6: 1–8. [DOI] [PubMed] [Google Scholar]
- Klingberg T, Roland PE (1998): Right prefrontal activation during encoding, but not during retrieval, in a non‐verbal paired‐associates task. Cereb Cortex 8: 73–79. [DOI] [PubMed] [Google Scholar]
- Lancaster JL, Woldorff MG, Parsons LM, Liotti M, Freitas CS, Rainey L, Kochunov PV, Nickerson D, Mikiten SA, Fox PT (2000): Automated talairach atlas labels for functional brain mapping. Hum Brain Mapp 10: 120–131. [DOI] [PMC free article] [PubMed] [Google Scholar]
- Laurienti PJ, Burdette JH, Wallace MT, Yen Y‐F, Field AS, Stein BE (2002a): Deactivation of sensory‐specific cortex by cross‐modal stimuli. J Cogn Neurosci 14: 1–10. [DOI] [PubMed] [Google Scholar]
- Laurienti PJ, Field AS, Burdette JH, Maldjian JA, Yen Y‐F, Moody DM (2002b): Dietary caffeine consumption modulates fmri measures. Neuroimage 17: 751–757. [PubMed] [Google Scholar]
- Lewis JW, Beauchamp MS, DeYoe EA (2000): A comparison of visual and auditory motion processing in human cerebral cortex. Cereb Cortex 10: 873–888. [DOI] [PubMed] [Google Scholar]
- Macaluso E, Frith CD, Driver J (2000): Modulation of human visual cortex by crossmodal spatial attention. Science 289: 1206–1208. [DOI] [PubMed] [Google Scholar]
- Macaluso E, Driver J (2001): Spatial attention and crossmodal interactions between vision and touch. Neuropsychologia 39: 1304–1316. [DOI] [PubMed] [Google Scholar]
- Maldjian JA, Liu WC, Hirschorn D, Murthy R, Semanczuk W (1997): Wavelet transform‐based image compression for transmission of mr data. AJR Am J Roentgenol 169: 23–26. [DOI] [PubMed] [Google Scholar]
- Meredith MA, Stein BE (1986a): Visual, auditory, and somatosensory convergence on cells in superior colliculus results in multisensory integration. J Neurophysiol 56: 640–662. [DOI] [PubMed] [Google Scholar]
- Meredith MA, Stein BE (1986b): Spatial factors determine the activity of multisensory neurons in cat superior colliculus. Brain Res 365: 350–354. [DOI] [PubMed] [Google Scholar]
- Meredith MA, Nemitz JW, Stein BE (1987): Determinants of multisensory integration in superior colliculus neurons. I. Temporal factors. J Neurosci 7: 3215–3229. [DOI] [PMC free article] [PubMed] [Google Scholar]
- Miller J (1982): Divided attention: Evidence for coactivation with redundant signals. Cognit Psychol 14: 247–279. [DOI] [PubMed] [Google Scholar]
- Naito E, Kinomura S, Geyer S, Kawashima R, Roland PE, Zilles K (2000): Fast reaction to different sensory modalities activates common fields in the motor areas, but the anterior cingulate cortex is involved in the speed of reaction. J Neurophysiol 83: 1701–1709. [DOI] [PubMed] [Google Scholar]
- Nozawa G, Reuter‐Lorenz PA, Hughes HC (1994): Parallel and serial processes in the human oculomotor system: Bimodal integration and express saccades. Biol Cybern 72: 19–34. [DOI] [PubMed] [Google Scholar]
- Ogawa S, Lee TM, Kay AR, Tank DW (1990): Brain magnetic resonance imaging with contrast dependent on blood oxygenation. Proc Natl Acad Sci U S A 87: 9868–9872. [DOI] [PMC free article] [PubMed] [Google Scholar]
- Ogawa S, Menon RS, Tank DW, Kim SG, Merkle H, Ellermann JM, Ugurbil K (1993): Functional brain mapping by blood oxygenation level‐dependent contrast magnetic resonance imaging. A comparison of signal characteristics with a biophysical model. Biophys J 64: 803–812. [DOI] [PMC free article] [PubMed] [Google Scholar]
- O'Leary D, Andreasen NC, Hurtig RR, Torres IJ, Flashman LA, Kesler ML, Arndt SV, Cizadlo TJ, Ponto LLB, Watkins GL, Hichwa RD (1997): Auditory and visual attention assessed with pet. Hum Brain Mapp 5: 422–436. [DOI] [PubMed] [Google Scholar]
- Oray S, Lu ZL, Dawson ME (2002): Modification of sudden onset auditory erp by involuntary attention to visual stimuli. Int J Psychophysiol 43: 213–224. [DOI] [PubMed] [Google Scholar]
- Perrott DR, Saberi K, Brown K, Strybel TZ (1990): Auditory psychomotor coordination and visual search performance. Percept Psychophys 48: 214–226. [DOI] [PubMed] [Google Scholar]
- Petersen SE, van Mier H, Fiez JA, Raichle ME (1998): The effects of practice on the functional anatomy of task performance. Proc Natl Acad Sci U S A 95: 853–860. [DOI] [PMC free article] [PubMed] [Google Scholar]
- Posner MI, Rothbart MK (1998): Attention, self‐regulation and consciousness. Philos Trans R Soc Lond B Biol Sci 353: 1915–1927. [DOI] [PMC free article] [PubMed] [Google Scholar]
- Raab DH (1962): Statistical facilitation of simple reaction times. Trans NY Acad Sci 24: 574–590. [DOI] [PubMed] [Google Scholar]
- Raij T, Uutela K, Hari R (2000): Audiovisual integration of letters in the human brain. Neuron 28: 617–625. [DOI] [PubMed] [Google Scholar]
- Royet JP, Zald D, Versace R, Costes N, Lavenne F, Koenig O, Gervais R (2000): Emotional responses to pleasant and unpleasant olfactory, visual, and auditory stimuli: A positron emission tomography study. J Neurosci 20: 7752–7759. [DOI] [PMC free article] [PubMed] [Google Scholar]
- Sams M, Aulanko R, Hamalainen M, Hari R, Lounasmaa OV, Lu ST, Simola J (1991): Seeing speech: Visual information from lip movements modifies activity in the human auditory cortex. Neurosci Lett 127: 141–145. [DOI] [PubMed] [Google Scholar]
- Shams L, Kamitani Y, Thompson S, Shimojo S (2001): Sound alters visual evoked potentials in humans. Neuroreport 12: 3849–3852. [DOI] [PubMed] [Google Scholar]
- Snedecor G, Cochran W (1989): Statistical methods. Ames, Iowa: Iowa State University Press; [Google Scholar]
- Stein BE, Meredith MA (1993): The merging of the senses. Cambridge, MA: MIT Press; [Google Scholar]
- Stroop, J. R. 1935. Studies of interference in serial verbal reactions. J Exp Psychol 18: 643–662. [Google Scholar]
- Stein BE, Huneycutt WS, Meredith MA (1988): Neurons and behavior: The same rules of multisensory integration apply. Brain Res 448: 355–358. [DOI] [PubMed] [Google Scholar]
- Talairach J, Tournoux P (1988): Co‐planar stereotaxic atlas of the human brain. 3‐dimensional proportional system: an approach to cerebral imaging. New York: Thieme Medical Publishers. [Google Scholar]
- Turner R, Howseman A, Rees GE, Josephs O, Friston K (1998): Functional magnetic resonance imaging of the human brain: Data acquisition and analysis. Exp Brain Res 123: 5–12. [DOI] [PubMed] [Google Scholar]
- Vogt BA, Sikes RW (2000): The medial pain system, cingulate cortex, and parallel processing of nociceptive information. Prog Brain Res 122: 223–235. [DOI] [PubMed] [Google Scholar]
- Vogt BA, Derbyshire S, Jones AK (1996): Pain processing in four regions of human cingulate cortex localized with co‐registered pet and mr imaging. Eur J Neurosci 8: 1461–1473. [DOI] [PubMed] [Google Scholar]
- Wallace MT, Wilkinson LK, Stein BE (1996): Representation and integration of multiple sensory inputs in primate superior colliculus. J Neurophysiol 76: 1246–1266. [DOI] [PubMed] [Google Scholar]
- Woodruff PW, Benson RR, Bandettini PA, Kwong KK, Howard RJ, Talavage T, Belliveau J, Rosen BR (1996): Modulation of auditory and visual cortex by selective attention is modality‐dependent. Neuroreport 7: 1909–1913. [DOI] [PubMed] [Google Scholar]
- Worsley K, Marrett S, Neelin P, Vandal AC, Friston K, Evans A (1996): A unified statistical approach for determining significant voxels in images of cerebral activation. Hum Brain Mapp 4: 58–73. [DOI] [PubMed] [Google Scholar]