

Abstract
To better understand the neuronal effects of transcranial magnetic stimulation (TMS), we studied how the TMS‐evoked brain responses depend on stimulation intensity. We measured electroencephalographic (EEG) responses to motor‐cortex TMS, estimated the intensity dependence of the overall brain response, and compared it to a theoretical model for the intensity dependence of the TMS‐evoked neuronal activity. Left and right motor cortices of seven volunteers were stimulated at intensities of 60, 80, 100, and 120% of the motor threshold (MT). A figure‐of‐eight coil (diameter of each loop 4 cm) was used for focal stimulation. EEG was recorded with 60 scalp electrodes. The intensity of 60% of MT was sufficient to produce a distinct global mean field amplitude (GMFA) waveform in all subjects. The GMFA, reflecting the overall brain response, was composed of four peaks, appearing at 15 ± 5 msec (Peak I), 44 ± 10 msec (II), 102 ± 18 msec (III), and 185 ± 13 msec (IV). The peak amplitudes depended nonlinearly on intensity. This nonlinearity was most pronounced for Peaks I and II, whose amplitudes appeared to sample the initial part of the sigmoid‐shaped curve modeling the strength of TMS‐evoked neuronal activity. Although the response amplitude increased with stimulus intensity, scalp distributions of the potential were relatively similar for the four intensities. The results imply that TMS is able to evoke measurable brain activity at low stimulus intensities, probably significantly below 60% of MT. The shape of the response‐stimulus intensity curve may be an indicator of the activation state of the brain. Hum. Brain Mapp. 21:154–164, 2004. © 2004 Wiley‐Liss, Inc.
Keywords: magnetics, motor cortex, electroencephalography, evoked potential, human
INTRODUCTION
Transcranial magnetic stimulation (TMS) is a tool for transiently influencing the physiological state of the brain [Barker et al.,1985]. Its stimulating effect is concentrated at superficial cortex [Heller and van Hulsteyn,1992]. With a favorable geometric orientation with respect to the induced current, a membrane may be depolarized to a level where an action potential is triggered. If a large number of neurons are excited simultaneously, a response in scalp EEG reflecting postsynaptic potentials (PSP) can be recorded, starting within a few milliseconds poststimulus [Ilmoniemi et al.,1997]. The TMS‐evoked neuronal activity leads to hemodynamic changes, as microvessels carry more oxygenated blood to the active area, the peak of these alterations occurring a few seconds poststimulus [Bohning et al.,2000; Fox et al.,1997; Paus et al.,1997].
The effect of motor‐cortex TMS has been traditionally measured based on electromyographic responses recorded from contralateral muscles [Barker et al.,1986]. Thresholds for evoking such responses have been reported in health and in disease [e.g., Dolberg et al.,2002; Fitzgerald et al.,2002a; Pennisi et al.,2002; Wassermann,2002]. However, we lack knowledge about the threshold for evoking cortical activity which is, in any case, lower than that required for eliciting motor responses at extremities. Also, we have lacked the means to measure how the activation spreads from the initially activated area to other areas of the brain. Experiments using paired‐pulse TMS have shown that cortical activity can be elicited with relatively low pulse intensities, as a subthreshold conditioning pulse modifies the effect of a test pulse delivered some milliseconds later [e.g., Awiszus et al.,1999; Boroojerdi et al.,2000; Cicinelli et al.,2000]. Furthermore, with the double‐pulse technique involving two stimulation sites, it has been convincingly demonstrated that the TMS‐evoked activity does not remain local but spreads to the opposite hemisphere, causing interhemispheric inhibition or facilitation [e.g., Ferbert et al.,1990,1992; Fitzgerald et al.,2002b; Salerno and Georgesco,1996]. This finding has been complemented by imaging ipsi‐ and contralaterally activated areas after a sequence of magnetic pulses [Baudewig et al.,2001; Bohning et al.,1999,2000; Fox et al.,1997; Nahas et al.,2001; Nissilä et al.,2002; Oliviero et al.,1999; Paus et al.,1997,1998; Siebner et al.,1999,2000]. Imaging metabolic changes due to neuronal activation does not, however, provide information about the sequence of activity at subsecond time scales. Because the immediate response to stimulation is of special interest, the electroencephalogram (EEG), with its excellent temporal resolution, has proven useful for mapping the TMS‐evoked brain activity [Ilmoniemi et al.,1997; Komssi et al.,2002; Kähkönen et al.,2001].
Aiming at a better understanding of TMS‐evoked neuronal effects, we measured EEG responses after motor‐cortex stimulation at intensities of 60, 80, 100, and 120% of the motor threshold (MT). We estimated the amplitude‐intensity dependence of the overall brain response and compared it to a theoretical model for the intensity dependence of the TMS‐evoked neuronal activity. We also compared the potential patterns evoked by stimulation at different intensities.
SUBJECTS AND METHODS
TMS and EEG Recording
Six healthy men (age 27, 27, 30, 32, 22, and 28 years; 2 left‐handed) and one woman (age 29 years, right‐handed) participated in the study after giving a written informed consent. The experimental protocol was approved by the Ethical Committee of the Department of Radiology, Helsinki University Central Hospital.
To focally stimulate the cortex, biphasic magnetic pulses (duration 385 μsec) were delivered with a coplanar figure‐of‐eight coil (diameter of each loop 4 cm) positioned over the scalp using a magnetic stimulator designed and constructed at the BioMag Laboratory, Helsinki University Central Hospital. The subject sat in a reclining chair wearing ear plugs, with the neck and back being supported with pillows, arms relaxed and eyes closed. The electromyogram was recorded bilaterally from the abductor digiti minimi muscles (ADM). The coil was moved around central regions of the scalp in order to find the site for producing maximal motor evoked potentials (MEP) in the contralateral ADM. The optimal position at each hemiscalp was chosen as the stimulation site. The motor threshold was determined separately for each hemisphere by adjusting the TMS intensity until 50‐μV MEPs were evoked contralaterally for approximately 50% of the pulses.
TMS was delivered in sequences of 50 pulses with a random interstimulus interval of 1.5–2.5 sec and constant intensity. Four sequences, with intensities of 60, 80, 100, and 120% of MT, were targeted in random order to each hemisphere. This was repeated after a 5–10‐min break. For Subject 4, the MT was so high (capacitor voltage 1,850/2,000 V) that intensities of 60, 80, 100, and 110% of MT were chosen for the left hemisphere and 40, 60, 80, and 100% of MT for the right hemisphere. Altogether, 16 sequences of 50 pulses were delivered during a session of less than 45 min. Stimulation voltages ranged from 800 to 2,040 V, as the individual motor thresholds were in the range of 1,400–1,850 V for the left and 1,450–2,000 V for the right hemisphere.
A TMS‐compatible EEG equipment with a 60‐electrode cap was used for recording TMS‐evoked potentials [Virtanen et al.,1999]. In each amplifier, a sample‐and‐hold circuit kept the outputs locked from 50 μsec pre‐ to 7 msec poststimulus to avoid saturation. The signals were bandpass‐filtered between 0.1–500 Hz and sampled at 1,450 Hz. In the AgCl‐coated silver electrodes, a 2‐mm slit interrupted their circular shape, to reduce eddy currents. The EEG, recorded from 100 msec pre‐ to 300 msec poststimulus, was referenced to an additional electrode on the forehead, approximately at the midline.
To assure that the measured EEG response was not significantly contaminated by auditory activation due to the clicks from the coil, the stimulation protocol was repeated for Subject 5 by applying masking acoustical white noise through ear phones. The intensity of the noise was raised until the coil click was no longer audible. The noise threshold was searched separately for each TMS intensity; the maximum sound pressure level was approximately 90 dB. The stimulation and EEG recording were performed as earlier, including the determination of the optimal stimulation site and MT, but only the left primary motor cortex (M1) was stimulated.
Analysis
After rejecting epochs with high‐amplitude waveforms resembling eye‐movement or other artifacts, each subject's EEG was averaged separately for each TMS intensity and stimulated hemisphere (i.e., each condition); at least 70 epochs were averaged per condition. Thereafter, the averaged signal sets were visually inspected and channels containing muscle or stimulus artifacts were dropped out. No more than 8 channels were omitted per condition, except for Subject 2, whose EEG for stimulation of left M1 was entirely discarded because of contaminated signals. In order to determine latencies of maximal neuronal activity, the global mean field amplitude (GMFA) was calculated as a function of time from equation
| (1) |
where K is the number of electrodes, V i is the voltage measured with electrode i, and V mean is the mean of the measured voltages [Lehmann and Skrandies,1980]. The GMFA was low‐pass filtered (50th‐order Hamming window; cut‐off at 65 Hz); its peaks were individually identified and denoted with numbers I–IV. The peaks that were smaller in amplitude than the largest prestimulus GMFA value were omitted from further analysis; these were Peak I for Subject 5 and Peak II for Subject 6 after stimulation of right M1 at 60% of MT.
To evaluate the intensity dependence of the overall TMS‐evoked brain response, the group‐mean amplitudes and latencies of Peaks I–IV were plotted as functions of stimulation intensity. The threshold for evoking the response was estimated by fitting a linear function to each amplitude‐intensity plot and extrapolating the functions to prestimulus noise level. The intensity dependence of each peak latency was tested with one‐way analysis of variance (ANOVA).
If the membrane potentials of a population of cortical neurons are normally distributed at values below the firing threshold, the proportion of these neurons that are excited by TMS depends on the amplitude of the induced electric field experienced by the neurons, according to a sigmoid‐shaped function. The amplitude of the induced field is, however, not constant over the cortex. The proportion of excited neurons within a cortical area is determined as the mean of the proportions of excited neurons in different sub‐populations, each representing a small cortical volume of a constant strength of the field. It can be assumed that the overall EEG response measured shortly after the volley(s) is proportional to the sum of all excited neurons. The experimentally determined intensity dependence of the measured EEG response on stimulus intensity was compared with this model. In the example of Figure 1 explaining the concept, the field computation was performed according to Ilmoniemi et al. [1999] and the cortex was modeled with a spherical (radius 80 mm) surface at a distance of 15 mm below the coil plane.
Figure 1.

Model for the TMS‐evoked neuronal activity. Given that the membrane potentials of a population of neurons obey the distribution (a), the proportion of excited neurons as a function of the amplitude of the induced electric field experienced by the neurons can be read from the curve (b). In this example, the field amplitudes leading to neuronal excitation were selected so that above 240 V/m, the proportion of excited neurons increased less than a percentage unit for every 10 V/m. The contour map (c) represents the cortically induced electric field (interval 20 V/m, max. 182 V/m) near the intersection of the coil windings, computed for the capacitor voltage of 1,500 V. Note that the electric field is strongest at the intersection of the coil windings and that, there, the largest proportion of neurons is excited. The box over the map depicts an area of 400 mm2 for which the cortical reactivity was estimated. The grid (d) extends over this area (two arcs depict coil windings). The field amplitudes, which were calculated in the grid nodes, and the corresponding excitation percentages, read from curve b), are shown for three locations. The percentage of excited neurons within the 400‐mm2 cortical area was determined as the mean of the proportions of excited neurons in each neuronal population (in each grid node). This procedure was performed for capacitor voltages of 0–3,000 V. As the end result, the intensity dependence curve, i.e., reactivity curve, (e) was created. In f, the overall TMS‐evoked EEG responses (Peak I) for Subjects 3, 4, and 6 are shown as functions of TMS intensity, for comparison between the theory and experimental results. Note that the responses probably sample the lower part of the sigmoid‐shaped intensity dependence curve.
One‐way ANOVA was used to test whether the spatial distribution of the potential changed with intensity at Peaks I–IV. The tests were performed separately for each peak and stimulated hemisphere. Dependent variables were the 60 average‐referenced electrode signals. The t‐test was used to evaluate differences between the potential patterns for stimulation of left and right M1; eight average‐referenced signals from fronto‐parietally located electrodes ipsilateral to stimulation were symmetrically compared with each other. The tests were performed separately for each peak. The data for Subjects 1, 3, and 5–7 were included in both ANOVA and t‐tests (Subject 4: different intensities; Subject 2: data for left side stimulation were not available).
To illustrate the temporal sequence of the TMS‐evoked activity, minimum‐norm source‐current estimates were derived from the grand‐averaged potential distributions using a spherical head model with four concentric layers of homogeneous and isotropic conductivity (scalp: radius r = 89 mm, conductivity σ = 0.33 m−1Ω −1; skull: r = 85, σ = 0.0042 m−1Ω −1; cerebrospinal fluid: r = 77 mm, σ = 1.0 m−1Ω −1; and brain: r = 75 mm, σ = 0.33 m−1Ω −1; Peters and de Munck,1990). The Tikhonov‐regularized minimum‐norm estimate (MNE) was constructed at a layer 1 mm below the innermost spherical surface (cortex). The layer was constructed of 4,096 grid points, each being occupied by three dipole components in orthogonal directions. The MNE was then computed by dividing each dipole moment by the area of a unit cell of the grid.
RESULTS
Motor‐cortex TMS delivered at intensities of 60, 80, 100, and 120% of MT evoked an EEG response consisting of N15, P30, N45, P55, N100, and P180 deflections, peaking at 16 ± 5 msec, 29 ± 4 msec, 43 ± 3 msec, 56 ± 6 msec, 103 ± 17 msec, and 183 ± 18 msec (latencies at the vertex). The mean latencies and amplitudes of these deflections for each TMS intensity and stimulated hemisphere (i.e., each condition) are given in Table I. Figure 2a illustrates the 60 EEG signals evoked by stimulation of the left motor cortex at each intensity (Subject 5). Individual and mean responses recorded at the vertex with electrode 29 are shown in Figure 2b. For all subjects, a distinct GMFA waveform was elicited with all four TMS intensities. For Subject 4, stimulation of right M1 performed at the intensity of 40% of MT also gave rise to a clear waveform. The GMFA, reflecting the overall response of the cortex, was composed of four peaks, the first appearing at 15 ± 5 msec (Peak I), the second at 44 ± 10 msec (II), the third at 102 ± 18 msec (III), and the fourth at 185 ± 13 msec (IV). The individual GMFA curves are shown in Figure 3, and their mean peak latencies for each condition are given in Table II. For Subject 5, the differences between the overall responses recorded with and without auditory masking during left motor‐cortex TMS (Fig. 4) were comparable to the differences between the responses to left and right motor‐cortex TMS (without auditory masking, Fig. 3).
Table I.
Group‐mean latencies and amplitudes (μV) of the TMS‐evoked EEG deflections at the vertex for each intensity and stimulated hemisphere*
| Paradigm | N15 | P30 | N45 | P55 | N100 | P180 |
|---|---|---|---|---|---|---|
| Latencies of TMS‐evoked deflections | ||||||
| L 120 | 17 ± 4 | 30 ± 4 | 47 ± 5 | 56 ± 8 | 99 ± 18 | 184 ± 33 |
| L 110 | 14 ± 0 | 32 ± 0 | 50 ± 0 | 57 ± 0 | 111 ± 0 | 226 ± 0 |
| L 100 | 17 ± 3 | 29 ± 2 | 42 ± 4 | 58 ± 8 | 105 ± 16 | 180 ± 22 |
| L 80 | 15 ± 4 | 28 ± 4 | 41 ± 3 | 54 ± 6 | 103 ± 17 | 184 ± 21 |
| L 60 | 19 ± 0 | 32 ± 6 | 42 ± 4 | 55 ± 7 | 107 ± 21 | 184 ± 24 |
| R 120 | 15 ± 6 | 32 ± 4 | 44 ± 3 | 54 ± 5 | 98 ± 16 | 171 ± 16 |
| R 100 | 15 ± 5 | 29 ± 4 | 43 ± 1 | 55 ± 6 | 100 ± 18 | 185 ± 15 |
| R 80 | 15 ± 6 | 27 ± 4 | 43 ± 3 | 56 ± 5 | 101 ± 18 | 187 ± 16 |
| R 60 | 15 ± 6 | 27 ± 6 | 42 ± 2 | 59 ± 8 | 109 ± 18 | 188 ± 15 |
| R 40 | — | — | — | — | — | — |
| Mean ± SD | 16 ± 4 | 29 ± 4 | 43 ± 3 | 56 ± 6 | 103 ± 17 | 184 ± 19 |
| Amplitudes of TMS‐evoked deflections | ||||||
| L 120 | −10 ± 8 | 12 ± 6 | −3 ± 2 | 6 ± 14 | −30 ± 33 | 17 ± 13 |
| L 110 | −15 ± 0 | 11 ± 0 | −4 ± 0 | 2 ± 0 | −38 ± 0 | 23 ± 0 |
| L 100 | −7 ± 4 | 6 ± 4 | −3 ± 1 | 7 ± 4 | −21 ± 26 | 16 ± 11 |
| L 80 | −3 ± 2 | 4 ± 2 | −2 ± 1 | 6 ± 3 | −23 ± 18 | 16 ± 9 |
| L 60 | −4 ± 0 | 3 ± 2 | −1 ± 1 | 6 ± 3 | −18 ± 18 | 13 ± 7 |
| R 120 | −24 ± 31 | 11 ± 7 | −5 ± 4 | 7 ± 8 | −29 ± 30 | 18 ± 11 |
| R 100 | −7 ± 6 | 7 ± 4 | −4 ± 2 | 6 ± 5 | −29 ± 27 | 14 ± 9 |
| R 80 | −5 ± 6 | 3 ± 2 | −3 ± 3 | 5 ± 3 | −19 ± 17 | 13 ± 8 |
| R 60 | −7 ± 6 | 2 ± 1 | −2 ± 2 | 3 ± 3 | −14 ± 11 | 8 ± 6 |
| R 40 | — | — | — | — | — | — |
| Mean ± SD | −10 ± 14 | 6 ± 5 | −3 ± 2 | 6 ± 6 | −23 ± 22 | 14 ± 9 |
L = stimulation of left M1; R = stimulation of right M1; numbers 60–120 denote TMS intensity (% of MT). Note that the intensities of 110 and 40% of MT were only applied for stimulation of left and right M1, correspondingly, for Subject 4. For the latter intensity, the deflections could not be identified.
Values are expressed as mean ± SD.
Figure 2.
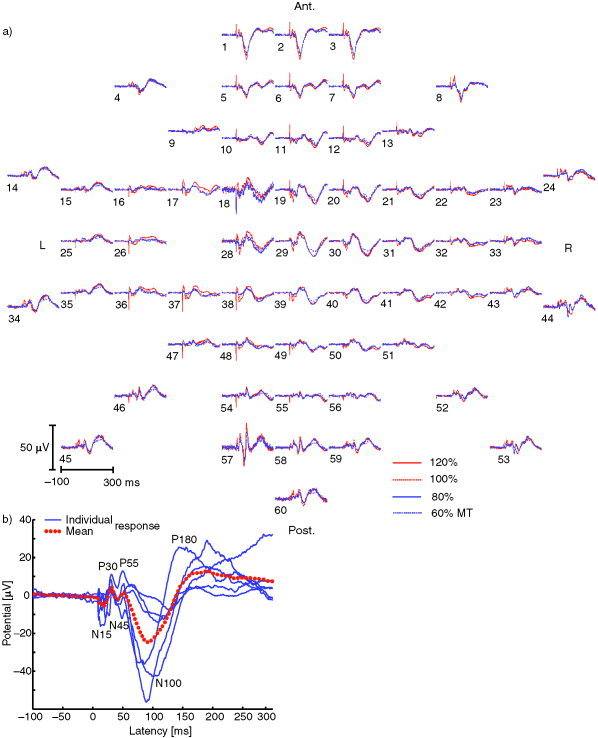
EEG evoked by left motor‐cortex TMS. a: Average‐referenced waveforms from 100 msec pre‐ to 300 msec poststimulus for the intensities of 60, 80, 100, and 120% of MT, Subject 5. Note the numbering of the electrodes. b: Intersubject repeatability of the TMS‐evoked response. Individual and group‐mean responses recorded at the vertex, referenced to the forehead. Stimulus intensity was 100% of MT.
Figure 3.

Overall TMS‐evoked EEG responses. Individual GMFA curves were calculated from EEG evoked by TMS at different intensities, Subjects 1, 3, and 5–7 (S1 = Subject 1, S3 = Subject 3, etc.). Note the designation of Peaks I–IV.
Table II.
Group‐mean latencies for Peaks I–IV of the overall EEG response evoked by TMS at different intensities*
| Intensity (% of MT) | Peak latencies for the overall TMS‐evoked response | |||||||
|---|---|---|---|---|---|---|---|---|
| Stimulation of left M1 | Stimulation of right M1 | |||||||
| I | II | III | IV | I | II | III | IV | |
| 40 | 16 ± 0 | 110 ± 0 | 151 ± 0 | |||||
| 60 | 15 ± 9 | 47 ± 13 | 105 ± 20 | 187 ± 12 | 14 ± 2 | 44 ± 10 | 102 ± 20 | 189 ± 12 |
| 80 | 16 ± 9 | 44 ± 13 | 114 ± 44 | 182 ± 11 | 13 ± 2 | 48 ± 11 | 104 ± 18 | 183 ± 17 |
| 100 | 14 ± 2 | 41 ± 8 | 100 ± 24 | 182 ± 13 | 14 ± 2 | 43 ± 8 | 98 ± 17 | 178 ± 16 |
| 110 | 14 ± 0 | 66 ± 0 | 154 ± 0 | |||||
| 120 | 18 ± 8 | 41 ± 10 | 103 ± 20 | 189 ± 13 | 14 ± 1 | 44 ± 8 | 101 ± 19 | 189 ± 15 |
| Mean ± SD | 16 ± 7 | 43 ± 11 | 101 ± 20 | 185 ± 12 | 14 ± 2 | 45 ± 9 | 102 ± 17 | 183 ± 16 |
Values are expressed in msec as mean ± SD.
Note that the intensities of 40 and 110% of MT were only used for Subject 4.
Figure 4.
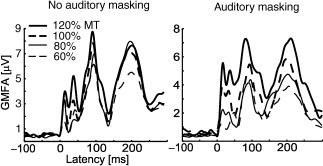
Overall TMS‐evoked EEG response with and without auditory masking. Left M1 was stimulated, Subject 5.
The overall TMS‐evoked EEG response was found to depend nonlinearly on stimulation intensity at Peaks I–IV; the nonlinearity was most pronounced for Peaks I and II. The amplitude‐intensity dependence of Peaks I and II seemed to represent the lower part of our theoretical, sigmoid‐shaped dependence function (Fig. 1). The peak latencies did not depend on stimulation intensity. Figure 5 shows the group‐mean peak amplitudes and latencies as functions of intensity. The threshold for the emergence of the overall response from noise, determined by fitting a linear function to each amplitude‐intensity plot of Figure 5 and extrapolating the functions to prestimulus noise level, was 57% of MT (threshold for Peak I, 51% of MT for stimulation of left M1 and 57% of MT for stimulation of right M1; Peak II, 40/51% of MT; Peak III, 19/28% of MT, Peak IV 0/15% of MT).
Figure 5.

Intensity dependence of the overall TMS‐evoked EEG response. a: Group‐mean amplitudes for Peaks I–IV as functions of TMS intensity. The horizontal dashed line depicts the mean prestimulus level of the GMFA (preGMFAmean; 0.65 μV). The horizontal solid line depicts preGMFAmean added by its two standard deviations (1.04 μV). Error bar = standard error of the group‐mean amplitude. b: Group‐mean latencies for Peaks I–IV as functions of TMS intensity.
Peak I was associated with strong negativity appearing under the coil. This potential pattern evolved into a dipolar field, with positive potential anterior to the stimulation site and negative potential posterior to it (Fig. 6a), and thereafter, into a nearly left‐right symmetric frontal positivity peaking at 30 ± 4 msec. Peak II was dipolar, with anterior negativity and posterior positivity, reversing polarity at the stimulation site. At 56 ± 6 msec, this pattern was followed by a frontocentral positivity, extending both to ipsi‐ and contralateral hemiscalps, and simultaneous lateral negativities. Peak III was characterized by ipsilateral frontal negativity emerging very close to the midsagittal plane at 102 ± 18 msec. Peak IV was generated by a wide positivity at the contralateral frontal region. Figure 6a illustrates the mean potential distributions and their MNEs at selected time points. The MNEs showed activity at the stimulation site and, thereafter, bilateral activations at mediofrontal areas, possibly involving premotor and primary motor areas.
Figure 6.

Temporal behavior of the TMS‐evoked activation. a: Group‐mean potential distributions and their MNEs are shown at selected latencies poststimulus. The left M1 was stimulated at 100% of MT. b: Potential patterns evoked by TMS at different intensities, for Peaks I–IV, Subject 6. The head is viewed from above.
Even though the response amplitude increased with stimulus intensity, the potential patterns were relatively similar for all intensities, as illustrated for Subject 5 in Figure 2a and for Subject 6 in Figure 6b. Nevertheless, the following intensity‐dependent behavior was observed in the potential patterns. At Peak I, higher pulse intensity caused a wider negativity, extending posterior and lateral to the stimulation site (one‐way ANOVA: significantly different signal amplitudes were measured with electrodes 21 and 31 for different intensities, P = 0.030 and 0.024, stimulation of right M1). At Peak III, the ipsilateral negativity close to the midsagittal plane extended laterally with higher stimulus intensity (significantly different signal amplitudes were measured with electrodes 21–22, 30–32, and 40–41 for different intensities, P = 0.015, 0.046, 0.002, 0.001, 0.041, 0.025, and 0.014, respectively, stimulation of right M1). For stimulation of the left side, these changes were not statistically significant (P > 0.05). The ipsilateral average‐referenced potential patterns for stimulation of the left and the right hemisphere were similar at Peaks I–IV (t‐test), implying interhemispheric symmetry.
DISCUSSION
By recording EEG reactions to motor‐cortex TMS at intensities of 60, 80, 100, and 120% of MT, we found that TMS is able to evoke clear responses at relatively low intensities, probably much below 60% of MT. To our knowledge, there are no earlier reports on brain activation evoked by the TMS‐induced electric field with as low intensity as 60% of MT.
Intensity Dependence of the Response Amplitude
The estimation of the amplitude‐intensity dependence of the overall TMS‐evoked brain response was performed according to a global measure of brain activity, the so‐called GMFA. Periods of stable potential patterns typically coincide with high field power, and thus the main components of evoked fields are represented in the GMFA [Lehmann and Skrandies,1980]. The amplitude‐intensity functions were different between the short‐ and long‐latency components of the TMS‐evoked response; compared to Peaks III and IV, Peaks I and II were small for subthreshold and threshold intensities. Also, the amplitudes of Peaks I and II depended on intensity in a nonlinear manner, while the amplitude‐intensity dependence of Peaks III and IV was more linear. Different mechanisms may underlie the generation of these components. Studies with the paired‐pulse technique show that a conditioning pulse prior to the test pulse induces facilitation of MEPs at latencies of 10–90 msec, followed by a long‐lasting inhibition at latencies of 60–200 msec [Cicinelli et al.,2000; Nakamura et al.,1997; Valls‐Solé et al.,1992]. Therefore, Peaks I and II might reflect excitatory activity (or suppression of inhibition) related with facilitation, while Peaks III and IV may be evoked due to slow inhibition, possibly mediated by GABAB receptors of cortical interneurons [Nakamura et al.,1997].
Our model that infers a sigmoidal intensity dependence of the overall TMS‐evoked cortical response is supported by the finding of Devanne et al. [1997] showing that the input‐output relation of the whole corticospinal pathway exhibits a similar shape. Comparison of our model with the intensity dependence of the early components I and II of the overall response seems to indicate that the responses sample the initial part of a sigmoid‐shaped curve only. This implies that only a small part of neurons was excited at the stimulation site. The shape of the amplitude‐intensity curve may be an indicator of the activation state of the brain; because the distribution of membrane potentials may be modified in some neurological diseases, the knowledge of the intensity dependence of the TMS‐evoked EEG response might be valuable. Our model would, however, be best applied to the period when cells fire at the stimulation site.
Previously, intensity‐dependent metabolic changes have been found with positron emission tomography and blood oxygen level dependent magnetic resonance imaging after TMS to motor/prefrontal cortex; bilateral motor/prefrontal and auditory activation is induced, which becomes stronger with increasing pulse intensity [Bohning et al.,1999,2000; Fox et al.,1997; Nahas et al.,2001; Siebner et al.,1999; Speer et al.,2003]. However, these results are not directly comparable with our EEG findings. Arising a few seconds poststimulus, metabolic changes reflect relatively long‐lasting activity of interconnected neuronal networks, whereas we were interested in the TMS‐evoked events that occurred within a fraction of a second.
Possible Origin of the TMS‐Evoked Responses
Since Cracco et al. [1989] recorded TMS‐evoked potentials from the contralateral hemiscalp, these responses have been more extensively elucidated [Ilmoniemi et al.,1997; Komssi et al.,2002; Kähkönen et al.,2001; Paus et al.,2001; Schürmann et al.,2001; Tiitinen et al.,1999]. To the previously introduced sequence of deflections evoked by motor‐cortex TMS, N15–P30–N45–N100–P180 [Komssi et al.,2002; Nikouline et al.,1999; Paus et al.,2001; Tiitinen et al.,1999], we now added P55. The nearly similar potential patterns elicited by different TMS intensities imply that a similar sequence of neuronal events was triggered independently of pulse strength. The question arises whether sub‐ and suprathreshold TMS can recruit the same cortical and subcortical circuits. The cortical volume within which neurons are effectively excited increases with stimulus strength, as the cortically induced electric field that exceeds any given threshold value extends over a larger area. MEPs are recorded when a sufficient number of pyramidal neurons send volleys to the spinal cord. Still, some corticospinal neurons fire at subthreshold stimulation [Cowan et al.,1986; Kujirai et al.,1993; Nakamura et al.,1997] and prompt the same regulatory events at the brain stem, the cerebellum, or the spinal cord as the volleys underlying MEPs. Thus, scalp‐recorded potentials might exhibit similar patterns for sub‐ and suprathreshold stimulation.
In addition to the cortical, cerebellar, and spinal structures, thalamic and basal ganglia nuclei may contribute to the EEG deflections recorded after TMS. As motor areas are part of the skeletomotor loop involving the putamen, globus pallidus, substantia nigra, and ventrolateral nucleus, contribution of these structures in TMS‐evoked activity at M1 is possible. In a recent study, an intensity‐dependent increase of the cerebral blood flow was detected at these structures after motor‐cortex TMS [Speer et al.,2003].
Peak I, appearing as focal negativity at the stimulation site, probably reflects excitatory events at the precentral gyrus, although subcortical contribution cannot be excluded. The subsequent formation of dipolar field patterns at the same area at about 25 and 45 msec (Peak II) might arise from activity at the sulcal part of M1. The latter pattern appeared also after subthreshold TMS. Hence, it is probably not solely due to afferent input from the contralateral ADM.
The N100–P180 complex (associated with Peaks III and IV) has been connected with the coil click [Nikouline et al.,1999; Tiitinen et al.,1999]; the response evoked by keeping the stimulating coil a few centimeters above the head was interpreted as elicited by the air‐conducted sound of the coil. Our results suggest that part of the response could have originated from the cortically induced electric field. Our subjects wore earplugs during stimulation, which did not quite prevent them from hearing the click. A control experiment was, therefore, performed in which white noise was played through headphones, providing effective auditory masking. The subject reported hearing a low‐frequency component of the click, which was probably elicited by bone conduction of the sound. The similarity of the responses recorded with and without auditory masking convinced us that none of the Peaks I–IV was elicited by the air‐conducted sound of the coil. Still, some part of N100 and P180 might correspond to bone‐conducted sound.
As the potential deflections described here probably reflect the activation of a network of neuronal connections due to the cortically induced electric field, possible artifactual sources of TMS‐evoked EEG need to be discussed; these include an electromechanical artifact from the coil and reflex activity from cranial muscles. Due to magnetic interactions, the coil is subject to internal forces vibrating it and, hence, nearby electrodes. As artifactual signals were rejected in the early analysis, this vibration did not contribute to the GMFA curves or the potential patterns shown in Figure 6. The physiologically reasonable field patterns also contradict with deflections due to an electromechanical artifact. A recent work indicated that reflex activity from cranial muscles does not contribute significantly to the EEG response evoked by motor‐cortex TMS [100% of MT; Kähkönen et al.,2001]. It is also unlikely that any of the described responses would represent somatosensory‐evoked potentials to scalp stimulation, because the potentials did not peak at the contralateral cortex.
CONCLUSION
The present results confirm the crucial role of TMS‐compatible EEG as a noninvasive direct measure of instant TMS‐evoked brain activity. Our results imply that even subthreshold TMS activates cortical circuits, evoking measurable potentials. The shape of the response‐stimulus intensity curve may be as an indicator of the activation state of the brain.
Acknowledgements
We thank Dr. Sauli Savolainen for helpful comments on the manuscript.
REFERENCES
- Awiszus F, Feistner H, Urbach D, Bostock H (1999): Characterisation of paired‐pulse transcranial magnetic stimulation conditions yielding intracortical inhibition or I‐wave facilitation using a threshold‐hunting paradigm. Exp Brain Res 129: 317–324. [DOI] [PubMed] [Google Scholar]
- Barker AT, Jalinous R, Freeston IL (1985): Non‐invasive magnetic stimulation of human motor cortex. Lancet 1: 1106–1107. [DOI] [PubMed] [Google Scholar]
- Barker AT, Freeston IL, Jalinous R, Jarratt JA (1986): Clinical evaluation of conduction time measurements in central motor pathways using magnetic stimulation of human brain. Lancet 1: 1325–1326. [DOI] [PubMed] [Google Scholar]
- Baudewig J, Siebner HR, Bestmann S, Tergau F, Tings T, Paulus W, Frahm J (2001): Functional MRI of cortical activations induced by transcranial magnetic stimulation (TMS). NeuroReport 12: 3543–3548. [DOI] [PubMed] [Google Scholar]
- Bohning DE, Shastri A, McConnell KA, Nahas Z, Lorberbaum JP, Roberts DR, Teneback C, Vincent DJ, George MS (1999): A combined TMS/fMRI study of intensity‐dependent TMS over motor cortex. Biol Psychiat 45: 385–394. [DOI] [PubMed] [Google Scholar]
- Bohning DE, Shastri A, Wassermann EM, Ziemann U, Lorberbaum JP, Nahas Z, Lomarev MP, George MS (2000): BOLD‐fMRI response to single‐pulse transcranial magnetic stimulation (TMS). J Magn Reson Imag 11: 569–574. [DOI] [PubMed] [Google Scholar]
- Boroojerdi B, Kopylev L, Battaglia F, Facchini S, Ziemann U, Muellbacher W, Cohen LG (2000): Reproducibility of intracortical inhibition and facilitation using the paired‐pulse paradigm. Muscle Nerve 23: 1594–1597. [DOI] [PubMed] [Google Scholar]
- Cicinelli P, Traversa R, Oliveri M, Palmieri MG, Filippi MM, Pasqualetti P, Rossini PM (2000): Intracortical excitatory and inhibitory phenomena to paired transcranial magnetic stimulation in healthy human subjects: differences between the right and left hemisphere. Neurosci Lett 288: 171–174. [DOI] [PubMed] [Google Scholar]
- Cowan JMA, Day BL, Marsden C, Rothwell JC (1986): The effect of percutaneous motor cortex stimulation on H reflexes in muscles of the arm and leg in intact man. J Physiol 377: 333–347. [DOI] [PMC free article] [PubMed] [Google Scholar]
- Cracco RQ, Amassian VE, Maccabee PJ, Cracco JB (1989): Comparison of human transcallosal responses evoked by magnetic coil and electrical stimulation. Electroenceph Clin Neurophysiol 74: 417–424. [DOI] [PubMed] [Google Scholar]
- Devanne H, Lavoie BA, Capaday C (1997): Input‐output properties and gain changes in the human corticospinal pathway. Exp Brain Res 114: 329–338. [DOI] [PubMed] [Google Scholar]
- Dolberg OT, Dannon PN, Schreiber S, Grunhaus L (2002): Magnetic motor threshold and response to TMS in major depressive disorder. Acta Psychiat Scand 106: 220–223. [DOI] [PubMed] [Google Scholar]
- Ferbert A, Priori A, Rothwell JC, Colebatch JG, Day BL, Marsden CD (1990): Trans‐callosal effects on motor cortical excitability in man. J Physiol 429: 38P. [Google Scholar]
- Ferbert A, Priori A, Rothwell JC, Day BL, Colebatch JG, Marsden CD (1992): Interhemispheric inhibition of the human motor cortex. J Physiol 453: 525–546. [DOI] [PMC free article] [PubMed] [Google Scholar]
- Fitzgerald PB, Brown TL, Daskalakis ZJ, deCastella A, Kulkarni J (2002a): A study of transcallosal inhibition in schizophrenia using transcranial magnetic stimulation. Schizophr Res 56: 199–209. [DOI] [PubMed] [Google Scholar]
- Fitzgerald PB, Brown TL, Daskalakis ZJ, Kulkarni J (2002b): A transcranial magnetic stimulation study of the effects of olanzapine and risperidone on motor cortical excitability in patients with schizophrenia. Psychopharmacology 162: 74–81. [DOI] [PubMed] [Google Scholar]
- Fox P, Ingham R, George MS, Mayberg H, Ingham J, Roby J, Martin C, Jerabek P (1997): Imaging human intracerebral connectivity by PET during TMS. NeuroReport 8: 2787–2791. [DOI] [PubMed] [Google Scholar]
- Heller L, van Hulsteyn DB (1992): Brain stimulation using electromagnetic sources: theoretical aspects. Biophys J 63: 129–138. [DOI] [PMC free article] [PubMed] [Google Scholar]
- Ilmoniemi RJ, Virtanen J, Ruohonen J, Karhu J, Aronen HJ, Nä ätänen R, Katila T (1997): Neuronal responses to magnetic stimulation reveal cortical reactivity and connectivity. NeuroReport 8: 3537–3540. [DOI] [PubMed] [Google Scholar]
- Ilmoniemi RJ, Ruohonen J, Karhu J (1999): Transcranial magnetic stimulation: a new tool for functional imaging of the brain. Crit Rev Biomed Eng 27: 241–284. [PubMed] [Google Scholar]
- Kähkönen S, Kesäniemi M, Nikouline VV, Karhu J, Ollikainen M, Holi M, Ilmoniemi RJ (2001): Ethanol modulates cortical activity: direct evidence with combined TMS and EEG. NeuroImage 14: 322–328. [DOI] [PubMed] [Google Scholar]
- Komssi S, Aronen HJ, Huttunen J, Kesäniemi M, Soinne L, Nikouline VV, Ollikainen M, Roine RO, Karhu J, Savolainen S, Ilmoniemi RJ (2002): Ipsi‐ and contralateral EEG reactions to transcranial magnetic stimulation. Clin Neurophysiol 113: 175–184. [DOI] [PubMed] [Google Scholar]
- Kujirai T, Sato M, Rothwell JC, Cohen LG. (1993): The effect of transcranial magnetic stimulation on median nerve somatosensory evoked potentials. Electroenceph Clin Neurophysiol 89: 227–234. [DOI] [PubMed] [Google Scholar]
- Lehmann D, Skrandies W (1980): Reference‐free identification of components of checkerboard‐evoked multichannel potential fields. Electroenceph Clin Neurophysiol 48: 609–621. [DOI] [PubMed] [Google Scholar]
- Nahas Z, Lomarev M, Roberts DR, Shastri A, Lorberbaum JP, Teneback C, McConnell K, Vincent DJ, Li X, George MS, Bohning DE. (2001): Unilateral left prefrontal transcranial magnetic stimulation (TMS) produces intensity‐dependent bilateral effects as measured by interleaved BOLD fMRI. Biol Psychiat 50: 712–720. [DOI] [PubMed] [Google Scholar]
- Nakamura H, Kitagawa H, Kawaguchi Y, Tsuji H (1997): Intracortical facilitation and inhibition after transcranial magnetic stimulation in conscious humans. J Physiol 498: 817–823. [DOI] [PMC free article] [PubMed] [Google Scholar]
- Nikouline V, Ruohonen J, Ilmoniemi RJ (1999): The role of the coil click in TMS assessed with simultaneous EEG. Clin Neurophysiol 110: 1325–1328. [DOI] [PubMed] [Google Scholar]
- Nissilä I, Kotilahti K, Komssi S, Kähkönen S, Noponen T, Ilmoniemi RJ, Katila T (2002): Optical measurement of hemodynamic changes in the contralateral motor cortex induced by transcranial magnetic stimulation In: Nowak H, Haueisen J, Giessler F, Huonker R, editors. Biomag2002, the 13th International Conference on Biomagnetism. Jena, Germany: VDE Verlag Gmbh, Berlin: p 851–854. [Google Scholar]
- Oliviero A, Di Lazarro V, Piazza O, Profice P, Pennisi MA, Della Corte F, Tonali P (1999): Cerebral blood flow and metabolic changes produced by repetitive magnetic brain stimulation. J Neurol 246: 1164–1168. [DOI] [PubMed] [Google Scholar]
- Paus T, Jech R, Thompson CJ, Comeau R, Peters T, Evans AC (1997): Transcranial magnetic stimulation during positron emission tomography: A new method for studying connectivity of the human cerebral cortex. Neuroscience 17: 3178–3184. [DOI] [PMC free article] [PubMed] [Google Scholar]
- Paus T, Jech R, Thompson CJ, Comeau R, Peters T, Evans AC (1998): Dose‐dependent reduction of cerebral blood flow during rapid‐rate transcranial magnetic stimulation of the human sensorimotor cortex. J Neurophysiol 79: 1102–1107. [DOI] [PubMed] [Google Scholar]
- Paus T, Sipilä PK, Strafella P (2001): Synchronization of neuronal activity in the human primary motor cortex by transcranial magnetic stimulation: an EEG study. J Neurophysiol 86: 1983–1990. [DOI] [PubMed] [Google Scholar]
- Pennisi G, Alagona G, Ferri R, Greco S, Santonocito D, Pappalardo A, Bella R (2002): Motor cortex excitability in Alzheimer disease: one year follow‐up study. Neurosci Lett 329: 293–296. [DOI] [PubMed] [Google Scholar]
- Peters M, de Munck J (1990): On the forward and the inverse problem for EEG and MEG In: Grandori F, Hoke M, Romani GL, editors. Auditory evoked magnetic fields and electric potentials. Basel: Karger; p 70–102. [Google Scholar]
- Salerno A, Georgesco M (1996): Interhemispheric facilitation and inhibition studied in man with double magnetic stimulation. Electroenceph Clin Neurophysiol 101: 395–403. [PubMed] [Google Scholar]
- Schürmann M, Nikouline VV, Soljanlahti S, Ollikainen M, Basar E, Ilmoniemi R (2001): EEG responses to combined somatosensory and transcranial magnetic stimulation. Clin Neurophysiol 112: 19–24. [DOI] [PubMed] [Google Scholar]
- Siebner HR, Peller M, Willoch F, Auer C, Bartenstein P, Drzezga A, Schwaiger M, Conrad B (1999): Imaging functional activation of the auditory cortex during focal repetitive transcranial magnetic stimulation of the primary motor cortex in normal subjects. Neurosci Lett 270: 37–40. [DOI] [PubMed] [Google Scholar]
- Siebner HR, Peller M, Willoch F, Minoshima S, Boecker H, Auer C, Drzezga A, Conrad B, Bartenstein P (2000): Lasting cortical activation after repetitive TMS of the motor cortex. A glucose metabolic study. Neurology 54: 956–963. [DOI] [PubMed] [Google Scholar]
- Speer AM, Willis MW, Herscovitch P, Daube‐Wintherspoon M, Shelton JR, Benson B, Post RM, Wassermann EM (2003): Intensity‐dependent regional cerebral blood flow during 1 Hz repetitive transcranial magnetic stimulation in healthy volunteers studied with H2 15O PET. I. Effects of primary motor cortex rTMS. Biol Psychiatry 54: 818–825. [DOI] [PubMed] [Google Scholar]
- Tiitinen H, Virtanen J, Ilmoniemi RJ, Kamppuri J, Ollikainen M, Ruohonen J, Näätänen R (1999): Separation of contamination caused by coil clicks from responses elicited by transcranial magnetic stimulation. Clin Neurophysiol 110: 982–985. [DOI] [PubMed] [Google Scholar]
- Valls‐Solé J, Pascual‐Leone A, Wassermann EM, Hallett M (1992): Human motor evoked responses to paired transcranial magnetic stimuli. Electroenceph Clin Neurophysiol 85: 355–364. [DOI] [PubMed] [Google Scholar]
- Wassermann EM (2002): Variation in the response to transcranial magnetic brain stimulation in the general population. Clin Neurophysiol 113: 1165–1171. [DOI] [PubMed] [Google Scholar]
- Virtanen J, Ruohonen J, Näätänen R, Ilmoniemi RJ (1999): Instrumentation for the measurement of electric brain responses to transcranial magnetic stimulation. Med Biol Eng Comput 37: 322–326. [DOI] [PubMed] [Google Scholar]