

Abstract
Activation of peripheral mixed and cutaneous nerves activates a distributed cortical network including the second somatosensory cortex (SII) in the parietal operculum. SII activation has not been previously reported in the stimulation of the dorsal penile nerve (DPN). We recorded somatosensory evoked fields (SEFs) to DPN stimulation from 7 healthy adults with a 122‐channel whole‐scalp neuromagnetometer. Electrical pulses were applied once every 0.5 or 1.5 sec to the left and right DPN. For comparison, left and right median and tibial nerves were stimulated alternatingly at 1.5‐sec intervals. DPN stimuli elicited weak, early responses in the vicinity of responses to tibial nerve stimulation in the primary somatosensory cortex. Strong later responses, peaking at 107–126 msec were evoked in the SII cortices of both hemispheres, with left‐hemisphere dominance. In addition to tactile processing, SII could also contribute to mediating emotional effects of DPN stimuli. Hum. Brain Mapping 18:90–99, 2003. © 2002 Wiley‐Liss, Inc.
Keywords: magnetoencephalography, human, functional localization, somatosensory evoked fields, SEFs, primary somatosensory cortex SI
INTRODUCTION
Somatosensory information is processed in a distributed cortical network that includes the primary somatosensory cortex (SI) in the postcentral gyrus, the second somatosensory cortices (SII) bilaterally in the parietal operculum, the posterior parietal cortex (PPC), the granular prefrontal cortex, and the limbic areas. The functional properties of the human SII are still relatively unknown. Neuromagnetic and intracranial recodings, as well as other functional brain imaging studies, have revealed SII's contribution to processing of tactile [Allison et al., 1989; Burton et al., 1993; Hari and Forss, 1999; Hari et al., 1983a; Kakigi et al., 2000; Paulesu et al., 1997] and painful [Hari et al., 1983a; Kakigi et al., 1995; Peyron et al., 2000; Pioner et al., 1999] stimuli, and suggested the contribution of SII to sensorimotor integration [Forss and Jousmäki, 1998; Huttunen et al., 1996], and maintenance of body scheme [Hari et al., 1998]. In addition, activation has been observed in the right SII during self‐generated emotions [Damasio et al., 2000], and in the left SII during sexually exciting visual stimuli [Redoute et al., 2000].
SII activation has been described in the stimulation of various tactile and mixed nerves of the limbs (for references, see e.g. [Hari and Forss, 1999]) as well as in visceral afferents from oesophagus [Schnitzler et al., 1998]. However, no SII activation has been reported in the stimulation of genital nerves. The dorsal penile nerve (DPN) supplies sensory axons to the major portion of the phallus, including the penile shaft and glans [Bradley et al., 1998]. Direct cortical recordings of somatosensory‐evoked potentials (SEPs) to DPN stimuli indicate activation of mesial cortical areas within the longitudinal fissure [Allison et al., 1996], and additional, slightly more lateral activation in the SI representation of the abdominal wall [Bradley et al., 1998]. Accordingly, scalp somatosensory‐evoked potentials (SEPs) and somatosensory‐evoked magnetic fields (SEFs), have been detected previously at the midline vertex 40–100 ms after stimuli, with sources in the SI cortex in the longitudinal fissure [Nakagawa et al., 1998; Narici et al., 1991].
No direct cortical responses or scalp SEPs have been reported the DPN stimuli from the SII region. Moreover, no DPN‐related SII activation has been described in previous SEF studies, although the human SII cortex is easily accessible to MEG recordings [Hari and Forss, 1999]. This absence of SII activations may have been due to insufficient coverage of the measurement area [Narici et al., 1991], or due to a too short interstimulus interval (ISI) and analysis period [Nakagawa et al., 1998]; SII responses to median (MN) and tibial nerve (TN) stimulation are absent or strongly diminished at ISIs below 1 sec [Hari et al., 1993]. As the main aim of the present study was to detect possible SII activation of DPN stimuli, we therefore applied a longer ISI than has been used in previous studies.
Functional mapping using SEFs, combined with three‐dimensional anatomic imaging or neuronavigation, is becoming increasingly more feasible in neurosurgical evaluation [for references, see, e.g., Mäkelä et al., 2001], and our other purpose was to find out whether SI activation elicited by DPN stimulation could provide a tool for presurgical functional localization of the central sulcus in the longitudinal fissure. In our experience, tumors in the vicinity of longitudinal fissure occasionally render SEFs to TN stimulation useless in this respect [Mäkelä et al., 2001].
MATERIALS AND METHODS
Subjects
We studied seven healthy, potent men (mean age 33 years, range 22–42 years, one left‐handed) with no neurological disorders. The subjects gave their informed consent after the aims and the procedure of the study were thoroughly explained.
The MEG recordings were carried out in a magnetically shielded room with a whole‐scalp SQUID (Superconducting QUantum Interference Device) magnetometer (Neuromag 122™; [Ahonen et al., 1993]). The 122 sensor units of the device were arranged in a helmet‐shaped array and measured the two orthogonal tangential derivatives of the magnetic field component normal to the helmet surface at 61 measurement sites.
Left and right DPNs were stimulated unilaterally with 0.2‐msec electric pulses using carbon electrodes at ISIs of 0.5 and 1.5 sec. The stimuli produced clear, non‐painful tactile sensations that were slightly aversive, but elicited no autonomic or visceral sensations. Unilateral instead of bilateral stimulation was selected to avoid bilateral activation in the mesial cortical wall, expected to result in opposing source currents and cancellation of the elicited magnetic fields. For control purposes, median nerves (MN) at wrists in one sequence and the posterior tibial nerves (TN) at ankles in another were stimulated by alternating electric pulses (intensity above the motor threshold; ISI 1.5 sec). In two subjects, responses to unilateral MN and TN stimuli at 1.5‐sec ISI were compared with those to alternate sitimulation at the 1.5‐sec ISI. The stimulus currents varied between 9–18 mA for DPN, 8–14 mA for MN, and 12–20 mA for TN stimuli.
During recordings, the subject was seated under the neuromagnetometer with his head leaning against its helmet‐shaped bottom. The exact location of his head with respect to the sensors was determined by measuring the magnetic field produced by small currents delivered to three coils attached to the scalp. The subject was instructed to keep his head still; such a procedure typically results in less than 1 mm standard deviation of the measured head position in co‐operative subjects [Uutela et al., 2001]. The locations of the coils with respect to the nasion and periauricular points were determined with a 3D digitizer. This information was used to align the MEG and MRI coordinate systems.
The recording passband was 0.03–320 Hz (3 dB points, high‐pass roll‐off 35 dB/decade, low‐pass over 80 dB/decade) and the sampling rate 987 Hz. The 500‐msec analysis period included a 100‐msec pre‐stimulus baseline. About 500 responses were averaged for DPN‐SEFs at 0.5‐sec ISI, and about 200 at the 1.5‐sec ISI; about 120 responses were averaged for MN‐ and TN‐SEFs. The vertical electro‐oculogram (EOG) was recorded simultaneously and epochs coinciding with EOG activity that exceeded ±150 μV were rejected from the averages.
The averaged responses were digitally low‐pass filtered at 190 Hz. The head was modeled as a spherical volume conductor matched to the local curvature of the inner skull in the region of interest. The spherical model has been shown to give accurate localization results in the somatosensory brain areas [Hämäläinen and Sarvas, 1989]. Sources of the strongest deflections were modeled as equivalent current dipoles (ECDs), found by least‐squares fits to signals recorded by a subset of 28 to 30 channels surrounding the maximum signals over each hemisphere [Hämäläinen et al., 1993]. The field patterns were searched for dipolar features during the whole recording period. Only ECDs explaining at least 80% of the field variance were accepted. Care was taken to accept sources from time periods with only one active brain region in the area of search. The SI sources for DPN and TN responses were searched for during 40–70 msec, and the best MN source (usually P35m) during 18–48 msec after the stimulus onset. SII activations were searched for during 70–140 msec. DPN stimulation with the 1.5‐sec ISI produced strong SII activations, and occasional activations in the posterior parietal area close to the early DPN source (indicated by arrows in Fig. 5). When these additional activations prevented identification of the SI activation, the SI source was determined from the 0.5‐sec ISI responses (at short ISIs the responses of the primary projection cortices typically remain most intact) and was used in the subsequent analysis of the 1.5‐sec ISI responses. The source locations were calculated in individual head coordinate systems. For comparison with other imaging studies, the individual coordinates were transformed into Talairach space [Talairach and Tournoux, 1988].
Figure 5.

Responses to DPN stimuli presented at ISIs of 0.5 and 1.5 sec in all subjects. The strongest signals of each individual from SI and SII regions are displayed. The arrows point to deflections generated in the nearby posterior parietal cortex.
The validity of the multidipole model was also confirmed by L1 minimum current estimates (MCEs), by calculating the current distribution with the smallest possible total current [Uutela et al., 1999]. MCE does not require initial assumptions about the source number or configuration. The MCEs were visualized by projecting the currents to the surface of the three‐dimensional brain model.
In one subject, the low signal‐to‐noise ratio prevented analysis of responses to right‐sided DPN stimuli. Another subject reported that the intensity of the left‐sided 0.5‐sec ISI DPN stimuli decreased during the measurement, and these responses were not analyzed further.
MR images (1.5 T Siemens Magnetom system) were acquired using regular T1‐weighted MPRAGE sequence, and were evaluated by an experienced neuroradiologist to be normal. The statistical significance of the results was tested by two‐tailed Student's t‐test.
RESULTS
Stimuli delivered to DPN at the 1.5‐sec ISI elicited activity in the SI and SII regions (traces a, b, and c in Fig. 1), but with clearly smaller amplitudes than to TN stimuli, especially around SI (see inset in Fig. 1). The magnetic field patterns were dipolar at peaks of the strongest signals both in SI and SII regions (Fig. 2). An additional, long‐lasting dipolar field pattern was evident above the left motor cortex region in this subject. The overlay of the estimated source locations on the subject's MR image confirmed the origin of signals in the regions of primary and secondary somatosensory cortices and in the precentral motor cortex (Fig. 3). MCE analysis of the DPN responses (Fig. 4) supported the applied multidipole model.
Figure 1.
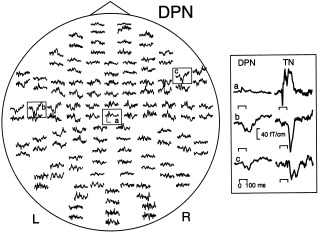
Responses to left‐sided DPN stimuli in Subject 2 (ISI 1.5 sec, 200 responses averaged). Each trace shows a signal detected by one sensor as a function of time, and signals obtained by orthogonal planar gradiometers from the same location are shown as pairs. The responses have been digitally filtered with a 0.03–90 Hz passband. The head is viewed from above and the nose points upwards. The scale bars in the encircled area (a) indicate 100 msec and 20 fT/cm. Inset (right): Enlarged responses from the SI (a) and left (b) and right (c) SII regions. Responses to left‐sided TN stimuli from the same regions are depicted for comparison.
Figure 2.

Multidipole model for responses to left‐sided DPN stimuli (ISI 1.5 sec) of Subject 2. In addition to SI and bilateral SII signals, a prolonged activation is evident in the motor cortex (MC). Insert (right): Dipole strength as a function of time; the vertical dashed line indicates time point 100 msec after the stimulus. The step in isocontour plots is 10 fT. The dipole moment and goodness‐of fit (g) values are 10 nAm and 83% at 41 msec, 25 nAm and 92% at 81 msec, 10 nAm and 82% at 122 msec, and 9 nAm and 93% at 212 msec.
Figure 3.
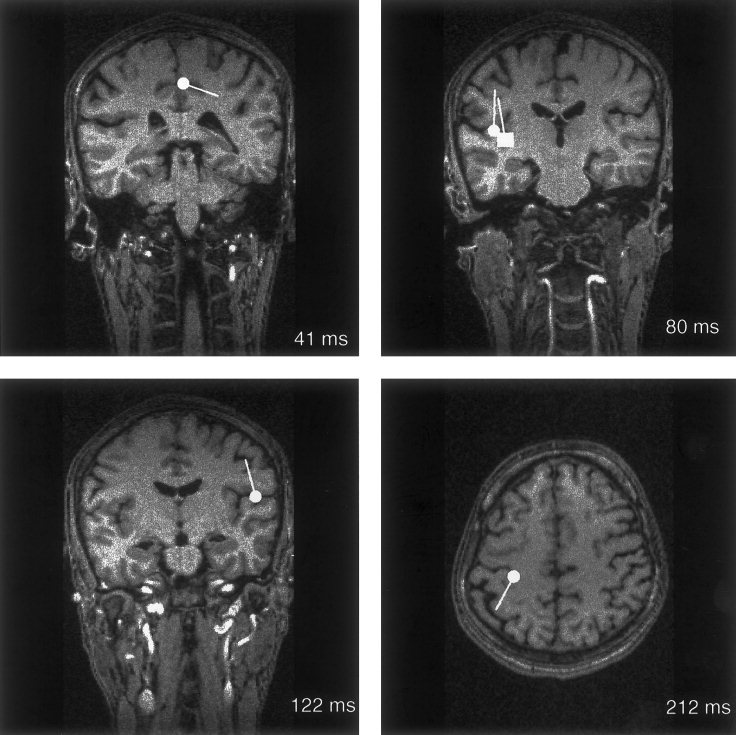
Locations of sources of responses to left DPN stimuli at 0.5‐sec ISI in the longitudinal fissure (41 msec) and to left DPN stimuli at 1.5‐sec ISI in the SII cortices (80 and 122 msec) and in the motor cortex (212 msec) in Subject 2, superimposed on his MR image. The square in the left SII (top right) indicates source location at 80 msec, and the circle the source at 112 msec.
Figure 4.

Minimum current estimates of responses to left‐sided DPN stimuli (ISI 1.5 sec) in Subject 2. The areas modeled with current dipoles in Figure 2 show MCE activity at corresponding latencies.
Table I presents the mean peak latencies and source strengths of all subjects. In SI, the peak latencies of SEFs to DPN and TN stimuli did not significantly differ but were 12–19 msec longer to DPN than MN stimuli (P < 0.03 in the right hemisphere). The source strengths of DPN‐SEFs were only about a half of those of TN‐SEFs (P < 0.005 for difference in the left and P < 0. 0001 in the right hemisphere) and about one third of those to MN SEFs (P < 0.003 for difference in the left and P < 0.03 in the right hemisphere). The DPN and TN sources were located within 1–7 mm from each other along the three coordinate axes (Table II). The location difference was statistically significant only in the anteroposterior direction in the left hemisphere, with the DPN sources 5 mm anterior to the TN sources (P < 0.05). The DPN SI responses did not differ between the two hemispheres.
Table I.
Response latencies and source strengths of sources in the primary and contralateral and ipsilateral second somatosensory cortices to dorsal penile nerve, median nerve, and tibial nerve stimuli
| DPN | TN | MN | |||
|---|---|---|---|---|---|
| Left hemisphere | lat | 50 ± 11 | 45 ± 6 | 38 ± 6 | |
| SI | Q | 10 ± 6 | 20 ± 8 | 35 ± 8 | |
| lat | 107 ± 25 | 113 ± 18 | 107 ± 28 | ||
| SIIc | Q | 28 ± 15 | 36 ± 16 | 55 ± 23 | |
| lat | 118 ± 28 | 133 ± 7 | 102 ± 13 | ||
| SIIi | Q | 21 ± 10 | 36 ± 18 | 42 ± 28 | |
| Right hemisphere | lat | 52 ± 7 | 48 ± 4 | 33 ± 11 | |
| SI | Q | 9 ± 4 | 21 ± 3 | 32 ± 16 | |
| lat | 123 ± 24 | 122 ± 21 | 91 ± 14 | ||
| SIIc | Q | 17 ± 9 | 22 ± 13 | 48 ± 21 | |
| lat | 126 ± 27 | 126 ± 31 | 113 ± 9 | ||
| SIIi | Q | 17 ± 10 | 22 ± 18 | 29 ± 22 |
Values are expressed as mean ± SD. DPN, dorsal penile nerve; TN, tibial nerve; MN, median nerve; SI, primary somatosensory cortex; lat, response latency (msec); Q, source strength (nAm); SIIc, contralateral SII cortex; SIIi, ipsilateral SII cortex.
Table II.
Mean (± SD) Talairach coordinates (x, y, z in mm) of sources in primary (SI) and contralateral (SIIc) and ipsilateral (SIIi) second somatosensory cortices to dorsal penile nerve (DPN), median nerve (MN), and tibial nerve (TN) stimuli*
| DPN | TN | MN | |||||||||||
|---|---|---|---|---|---|---|---|---|---|---|---|---|---|
| Left hemisphere | SI | −4 ± 8 | −34 ± 10 | 54 ± 11 | (7) | −5 ± 8 | −39 ± 8 | 58 ± 4 | (7) | −42 ± 6 | −28 ± 5 | 48 ± 7 | (7) |
| SIIc | −43 ± 7 | −20 ± 6 | 14 ± 4 | (7) | −47 ± 8 | −23 ± 6 | 18 ± 2 | (7) | −47 ± 3 | −20 ± 4 | 22 ± 5 | (7) | |
| SIIi | −47 ± 10 | −23 ± 4 | 19 ± 10 | (6) | −40 ± 5 | −26 ± 4 | 21 ± 4 | (6) | −42 ± 7 | −22 ± 3 | 23 ± 4 | (6) | |
| Right hemisphere | SI | 3 ± 6 | −33 ± 12 | 54 ± 12 | (6) | 8 ± 6 | −38 ± 10 | 61 ± 6 | (7) | 46 ± 5 | −20 ± 2 | 47 ± 4 | (7) |
| SIIc | 53 ± 9 | −14 ± 5 | 23 ± 6 | (6) | 48 ± 10 | −13 ± 5 | 30 ± 4 | (4) | 47 ± 3 | −15 ± 6 | 27 ± 3 | (5) | |
| SIIi | 51 ± 10 | −15 ± 7 | 17 ± 6 | (7) | 45 ± 13 | −18 ± 9 | 25 ±6 | (5) | 50 ± 12 | −18 ± 4 | 24 ± 6 | (6) | |
The number of subjects displaying a source in each region is given in parentheses
In SII, all seven subjects showed bilateral, left‐hemisphere dominant activations to DPN stimuli at the 1.5 sec ISI (Fig. 5). The mean latencies of SII signals did not differ between DPN and TN stimuli (Table I). The ipsilateral responses in the left SII were weaker to DPN than TN stimuli (P < 0.05); no significant differences were observed for other responses. Contralateral SII responses were 96–182% stronger (P < 0.05 in the right and P < 0.02 in the left hemisphere) and up to 32 msec shorter in latency (P < 0.01 in the right hemisphere) to MN than DPN stimuli. The contralateral SII sources to DPN and TN stimuli were 64% stronger in the left than right hemisphere (P < 0.05 for both differences). MN‐SEF source strengths did not differ significantly between the hemispheres. The SII/SI source strength ratio was 1.7 for DPN and 1.1 for TN in the left hemisphere; the corresponding values were 1.3 and 0.7 in the right hemisphere (P < 0.06), indicating that SII activation was relatively stronger for DPN than TN stimuli. Prolongation of the ISI of TN (from unilateral stimuli at 1.5 sec to alternating stimuli to both body sides at 1.5 sec) increased SII/SI stimulation ratio by 135% in the left and by 94% in the right hemisphere in one control subject; in another subject, corresponding values were 36% increase in the left and 33% decrease in the right hemisphere.
In the right hemisphere, the DPN SII sources (Table II) were 7 mm lateral (P < 0.05) and 5 mm inferior (P < 0.03) to TN sources for responses to contralateral, and 8 mm inferior (P < 0.03) to ipsilateral stimulation. Other source coordinates did not significantly differ between DPN and TN responses.
Additional source areas were observed to DPN responses in 5 subjects. Three subjects had activity in the vicinity of the hand sensorimotor region (see Fig. 2). Three subjects had unilateral activity in the posterior parietal region in agreement with the posterior parietal sources described previously to MN stimuli [Forss et al., 1994]. This lateral activity was quite early in two subjects, overlapping with signals from the region of the primary somatosensory cortex in the longitudinal fissure (arrows in Fig. 5). In addition, midline activation in the vicinity of the DPN SI region continued over 200 msec in three subjects.
MCEs generally supported the source areas observed by the dipole modelling, as shown for one subject in Figure 4. The source structure appeared more complex in MCE than in dipole modeling in the right hemispheres of two subjects and in the left hemisphere of one subject; however, the MCE activations included source areas observed by dipole modeling also in these subjects.
Responses to DPN stimulation at 0.5 sec produced small responses in the head midline in all subjects. The response waveforms were clearly more variable than those described for DPN‐SEPs [Haldeman et al., 1982; Fitzpatrick et al., 1989]. The first dipolar field patterns appeared at 40–50 msec; in one subject dipolar fields could be found only after 60 msec. The sources were situated in the longitudinal fissure. In three subjects, source activity was triphasic, thus showing a temporal pattern similar to the waveform reported for DPN‐SEPs [Fitzpatrick et al., 1989; Haldeman et al., 1982]. In line with previous reports, decrease of ISI from 1.5 to 0.5 sec diminished SII responses strongly (Fig. 5).
DISCUSSION
Our most prominent, and a totally novel finding, was the robust activation of the SII cortices by DPN stimuli. The observed SI activation agrees with previous reports of SEFs to DPN stimuli with sources in the midline vertex region [Narici et al., 1991; Nakagawa et al., 1998], medial and anterior to areas activated by tibial nerve stimulation.
The source locations or peak latencies of SII responses to DPN stimuli did not systematically differ from those to MN or TN stimuli. The SII sources were generally slightly weaker to DPN than to TN or MN, but the difference was less clear than in the SI region (see Table I), indicating a relatively more prominent role of SII in processing of DPN than TN or MN stimuli. The alternating stimulation of MN and TN to both body sides resulted in stimulation once every 3 sec at each side, whereas the DPN was stimulated unilaterally once every 1.5 sec. This difference cannot explain the observed differences in the SII/SI ratio as such ISI differences should rather decrease the SII/SI ratio at shorter ISIs (as was the case in 3 out of 4 hemispheres of 2 subjects in our control measurements to TN stimuli).
The DPN SII responses certainly reflect tactile processing but could also, despite their relatively early latency, be affected by the emotional content of the stimuli. DPN plays a crucial role in erection and ejaculation [Bradley et al., 1998], and its stimulation is, therefore, occasionally associated with intense emotions. In a PET study, self‐generated emotions activated the right SII, in combination with the insula, cingulate cortex and several other brain areas [Damasio et al., 2000]. Accordingly, lesions in right‐hemisphere somatosensory‐related cortices, including SI and SII, impair recognition of emotion [Adolphs et al., 2000]. Direct projections from SII to temporal lobe limbic structures have been proposed to subserve tactile learning and memory [Friedman et al., 1986]. These projections could also convey effects of DPN stimulation to limbic structures, contributing to associated emotions. SII has been claimed to be the only somatosensory region receiving amygdalar projections, and this connection has been suggested to contribute to the anatomical basis of the emotional aspects of penile sensations [Redoute et al., 2000].
The observed left‐hemisphere dominance of the SII responses parallels left‐dominant activation of SII area by sexually exciting visual stimuli [Redoute et al., 2000]. However, left‐hemisphere dominance of SII responses was seen also in TN stimulation, and has been reported earlier for simultaneous bilateral stimulation of median nerves [Simoes et al., 2002], and for proprioceptive stimulation of fingers [Alary et al., 2002]. Thus, our results indicate that DPN stimulation elicts robust SII activation, but we cannot differentiate the possible emotional contribution to these responses.
Whereas MN and TN nerve stimuli elicit SEFs both in SI and SII cortices, stimulation of visceral afferents in distal oesophagus elicits SEFs only in the SII region, close to the sources of SII responses to median nerve and lip stimulation [Schnitzler et al., 1998]. This finding has been considered to imply that visceral input has direct access to SII, without projecting to SI. Accordingly, pneumatic distension of distal rectum that activates only visceral fibers elicited fMRI signals only in SII, not in SI [Lotze et al., 2001]. However, pudendal nerve stimulation, by distension of the anal canal, activated both the SI and SII cortices [Lotze et al., 2001]. In line with this finding, stimulation of DPN, a branch of the pudendal nerve, activated both SI and SII cortices, thereby resembling somatic rather than visceral sensory activation pattern. Moreover, as tactile stimuli activate SI and SII cortices sequentially, whereas painful stimuli activate them simultaneously [Ploner et al., 1999], the sequence of our DPN‐SEFs resembled activation elicited by tactile rather than by painful stimuli.
In three subjects, DPN stimulation also elicited activation in the primary motor cortex region. Similarly, pudendal nerve stimulation in the anal canal also activated the primary motor cortex [Lotze et al., 2001]. The rostral hand region of the primary somatosensory cortex of the anesthetized squirrel monkey can be activated by noxious stimulation of distal oesophagus, colon, and urinary bladder [Brüggemann et al., 1997]. The observed DPN source in the motor cortex region could thus be related to visceroceptive activation. On the other hand, unexpected auditory stimuli may modify the excitability of motor cortex, probably as a part of the startle response [Furubayashi et al., 2000], and it is conceivable that the DPN stimuli could modify motor cortical activity by similar mechanisms. We cannot rule out the possibility that DPN stimulation elicited inadvertent motor activity since EMG was not monitored during the experiments.
Insula is an important visceral sensory area, and contains somatosensory representations as well. That we did not consistently see insular activation in our subjects could be in part due to technical reasons. First, magnetic signals caused by currents in the opposite walls of the insula may cancel each other and radially oriented insular currents are unlikely to be detected by MEG. Second, the accuracy of MEG source locations is worst in the direction of depth. Furthermore, a current dipole is only a model that shows the center of gravity but not the extent of the activated area. Thus, it is quite possible that our SII sources to DPN stimuli would include some insular activity. However, this contribution is probably rather small, because the SII sources for DPN stimuli tended to be the most lateral of all SII sources.
DPN stimuli elicit the first SEPs at about 40 msec [Fitzpatrick et al., 1989; Haldeman et al., 1982]. Similar latencies for the first DPN‐SEFs were reported by Narici et al. [1991], whereas some authors have detected the first cortical responses only at 60 msec [Nakagawa et al., 1998]. We observed clear dipolar field patterns at 40 msec, with source regions deep in the longitudinal fissure in some subjects, indicating, indeed, that the first cortical responses to DPN stimuli occur at about 40 msec. However, slightly more lateral areas were also activated in some subjects, suggesting a more widespread source structure as described by Bradley and coworkers [1998].
The DPN SI sources were occasionally deep, weak, and poorly modeled by equivalent current dipoles. Furthermore, they did not differ systematically from TN sources. However, as individual variability was considerable, the DPN sources could serve as useful landmarks in some patients who need especially careful delineation of the mesial cortex function before neurosurgical operation. Feasible routine application of DPN‐SEFs as functional landmarks would apparently require fine‐tuning of the experimental setup to optimize the signal‐to‐noise ratio.
REFERENCES
- Adolphs R, Damasio H, Tranel D, Cooper G, Damasio A (2000): A role for somatosensory cortices in the visual recognition of emotion as revealed by three‐dimensional lesion mapping. J Neurosci 20: 2683–2690. [DOI] [PMC free article] [PubMed] [Google Scholar]
- Ahonen A, Hämäläinen M, Kajola M, Knuutila J, Laine P, Lounasmaa O, Parkkonen L, Simola J, Tesche C (1993): 122‐channel SQUID instrument for investigating the magnetic signals from human brain. Phys Scripta T49: 198–205. [Google Scholar]
- Alary F, Simoes C, Jousmäki V, Forss N, Hari R (2002): Cortical activity associated with passive movements of human index finger: a MEG study. NeuroImage 15: 691–696. [DOI] [PubMed] [Google Scholar]
- Allison T, McCarthy G, Wood C, Williamson P, Spencer D (1989): Human cortical potentials evoked by stimulation of the median nerve. II. Cytoarchitechtonic areas generating long‐latency activation. J Neurophysiol 62: 711–722. [DOI] [PubMed] [Google Scholar]
- Allison T, McCarthy G, Luby M, Puce A, Spencer D (1996): Localization of functional regions of human mesial cortex by somatosensory evoked potential recording and by cortical stimulation. Electroenceph Clin Neurophysiol 100: 126–140. [DOI] [PubMed] [Google Scholar]
- Bradley W, Farrell D, Ojemann G (1998): Human cerebrocortical potentials evoked by stimulation of the dorsal nerve of the penis. Somatosens Mot Res 15: 118–127. [DOI] [PubMed] [Google Scholar]
- Brüggemann J, Shi T, Apkarian A (1997): Viscero‐somatic neurons in the primary somatosensory cortex (SI) of the squirrel monkey. Brain Res 756: 297–300. [DOI] [PubMed] [Google Scholar]
- Burton H, Videen T, Raichle M (1993): Tactile‐vibration‐activated foci in insular and parietal‐opercular cortex studied with positron emission tomography: mapping of the second somatosensory area in humans. Somatosens Mot Res 10: 297–308. [DOI] [PubMed] [Google Scholar]
- Damasio A, Grabowski T, Bechara A, Damasio H, Ponto L, Parvizi J, Hichwa R (2000): Subcortical and cortical brain activity during the feeling of self‐generated emotions. Nature Neurosci 3: 1049–1056. [DOI] [PubMed] [Google Scholar]
- Fitzpatrick D, Hendricks S, Graber B, Balogh S, Wetzel M (1989): Somatosensory evoked potentials elicited by dorsal penile and posterior tibial nerve stimulation. Electroenceph Clin Neurophysiol 74: 95–104. [DOI] [PubMed] [Google Scholar]
- Forss N, Jousmäki V (1998): Sensorimotor integration in human primary and secondary somatosensory cortices. Brain Res 781: 259–267. [DOI] [PubMed] [Google Scholar]
- Forss N, Hari R, Salmelin R, Ahonen A, Hämäläinen M, Kajola M, Knuutila J, Simola J (1994): Activation of the human posterior parietal cortex by median nerve stimulation. Exp Brain Res 99: 309–315. [DOI] [PubMed] [Google Scholar]
- Friedman D, Murray E, O'Neill J, Mishkin M (1986): Cortical connections of the somatosensory fields of the lateral sulcus of macaques:evidence for corticolimbic pathway for touch. J Comp Neurol 252: 323–347. [DOI] [PubMed] [Google Scholar]
- Furubayashi T, Ugawa Y, Terao Y, Hanajima R, Sakai K, Machii K, Mochizuki H, Shiio Y, Uesugi H, Enomoto H, Kanazawa I (2000): The human motor area is transiently suppressed by an unexpected auditory stimulus. Clin Neurophysiol 111: 178–183. [DOI] [PubMed] [Google Scholar]
- Haldeman S, Bradley W, Bhatia N (1982): Evoked responses from the pudendal nerve. J Urol 128: 974–980. [DOI] [PubMed] [Google Scholar]
- Hämäläinen M, Hari R, Ilmoniemi R, Knuutila J, Lounasmaa O (1993): Magnetoencephalography: theory, instrumentation and applications to noninvasive studies of the working human brain. Rev Mod Phys 65: 413–497. [Google Scholar]
- Hämäläinen MS, Sarvas J (1989): Realistic conductivity geometry model of the human head for interpretation of neuromagnetic data. IEEE Trans Biomed Eng BME‐ 36: 165–171. [DOI] [PubMed] [Google Scholar]
- Hari R, Forss N (1999): Magnetoencephalography in the study of human somatosensory cortical processing. Phil Trans R Soc Lond B 354: 1145–1154. [DOI] [PMC free article] [PubMed] [Google Scholar]
- Hari R, Hämäläinen M, Kaukoranta E, Reinikainen K, Teszner D (1983a): Neuromagnetic responses from the second somatosensory cortex in man. Acta Neurol Scand 68: 207–212. [DOI] [PubMed] [Google Scholar]
- Hari R, Kaukoranta E, Reinikainen K, Huopaniemi T, Mauno J (1983b): Neuromagnetic localization of cortical activity evoked by painful dental stimulation in man. Neurosci Lett 42: 77–82. [DOI] [PubMed] [Google Scholar]
- Hari R, Karhu J, Hämäläinen M, Knuutila J, Salonen O, Sams M, Vilkman V (1993): Functional organization of the human first and second somatosensory cortices: a neuromagnetic study. Eur J Neurosci 5: 724–734. [DOI] [PubMed] [Google Scholar]
- Hari R, Hänninen R, Mäkinen T, Jousmäki V, Forss N, Seppä M, Salonen O (1998): Three hands: fragmentation of bodily awareness. Neurosci Lett 240: 131–134. [DOI] [PubMed] [Google Scholar]
- Huttunen J, Wikström H, Korvenoja A, Seppäläinen A‐M, Aronen H, Ilmoniemi R (1996): Significance of the second somatosensory cortex in sensorimotor integration: enhancement of sensory responses during finger movements. NeuroReport 7: 1009–1012. [DOI] [PubMed] [Google Scholar]
- Kakigi R, Koyama S, Hoshiyama M, Kitamura Y, Shomojo M, Watanabe S (1995): Pain‐related magnetic fields following painful CO2 laser stimulation in man. Neurosci Lett 192: 45–48. [DOI] [PubMed] [Google Scholar]
- Kakigi R, Hoshiyama M, Shimojo M, Naka D, Yamasaki H, Watanabe S, Xiang J, Maeda K, Lam K, Itomi K, Nakamura A (2000): The somatosensory evoked magnetic fields. Progr Neurobiol 61: 495–523. [DOI] [PubMed] [Google Scholar]
- Lotze M, Wietek B, Birbaumer N, Ehrhardt J, Grodd W, Enck P (2001): Cerebral activation during anal and rectal stimulation. NeuroImage 14: 1027–11034. [DOI] [PubMed] [Google Scholar]
- Mäkelä JP, Kirveskari E, Seppä M, Hämäläinen M, Forss N, Avikainen S, Salonen O, Salenius S, Kovala T, Randell T, Jääskeläinen J, Hari R (2001): Three‐dimensional integration of brain anatomy and function to facilitate intraoperative navigation around the somatomotor strip. Hum Brain Mapp 12: 180–192. [DOI] [PMC free article] [PubMed] [Google Scholar]
- Nakagawa H, Namima T, Aizawa M, Uchi K, Kaiho Y, Yoshikawa K, Orikasa S, Nakasato N (1998): Somatosensory evoked magnetic fields elicited by dorsal penile, posterior tibial and median nerve stimulation. Electroenceph Clin Neurophysiol 108: 57–61. [DOI] [PubMed] [Google Scholar]
- Narici L, Modena I, Opsomer R, Pizzella V, Romani G, Torrioli G, Traversa R, Rossini P (1991): Neuromagnetic somatosensory homunculus: a non‐invasive approach in humans. Neurosci Lett 121: 51–54. [DOI] [PubMed] [Google Scholar]
- Paulesu E, Frackowiak R, Bottini G (1997): Maps of somatosensory systems In: Frackowiak R, Friston K, Frith C, Dolan R, Mazziotta J. (eds): Human Brain function. San Diego: Academic Press; pp 183–242. [Google Scholar]
- Peyron R, Laurent P, Garcia‐Larrea L (2000): Functional imaging of brain responses to pain. A review and meta‐analysis. Neurophysiol Clin 30: 263–288. [DOI] [PubMed] [Google Scholar]
- Ploner M, Schmitz F, Freund H‐J, Schnitzler A (1999): Parallel activation of primary and secondary somatosensory cortex in human pain processing. J Neurophysiol 81: 3100–3104. [DOI] [PubMed] [Google Scholar]
- Redoute J, Stoleru S, Gregoire M‐C, Costes N, Cinotti L, Lavenne F, LeBars D, Forest M, Pujol J‐F (2000): Brain processing of visual sexual stimuli in human males. Hum Brain Mapp 11: 162–177. [DOI] [PMC free article] [PubMed] [Google Scholar]
- Schnitzler A, Volkmann J, Enck P, Frieling T, Witte O, Freund H‐J (1998): Different cortical organization of visceral and somatic sensation in humans. Eur J Neurosci 11: 305–315. [DOI] [PubMed] [Google Scholar]
- Simões C, Alary F, Forss N, Hari R (2002): Left‐hemisphere dominant SII activation after bilateral median nerve stimulation. NeuroImage 15: 686–690. [DOI] [PubMed] [Google Scholar]
- Talairach J, Tournoux P (1988): A co‐planar stereotaxic atlas of the human brain. Stuttgart: Thieme‐Verlag. [Google Scholar]
- Uutela K, Hämäläinen M, Somersalo E (1999): Visualization of magnetoencephalographic data using minimum current estimates. NeuroImage 10: 173–180. [DOI] [PubMed] [Google Scholar]
- Uutela K, Taulu S, Hämäläinen M (2001): Detecting and correctinng for head movements in neuromagnetic measurements. NeuroImage 14: 1424–1431. [DOI] [PubMed] [Google Scholar]