Abstract
Localization of the generators of the scalp measured electrical activity is particularly difficult when a large number of brain regions are simultaneously active. In this study, we describe an approach to automatically isolate scalp potential maps, which are simple enough to expect reasonable results after applying a distributed source localization procedure. The isolation technique is based on the time‐frequency decomposition of the scalp‐measured data by means of a time‐frequency representation. The basic rationale behind the approach is that neural generators synchronize during short time periods over given frequency bands for the codification of information and its transmission. Consequently potential patterns specific for certain time‐frequency pairs should be simpler than those appearing at single times but for all frequencies. The method generalizes the FFT approximation to the case of distributed source models with non‐stationary time behavior. In summary, the non‐stationary distributed source approximation aims to facilitate the localization of distributed source patterns acting at specific time and frequencies for non‐stationary data such as epileptic seizures and single trial event related potentials. The merits of this approach are illustrated here in the analysis of synthetic data as well as in the localization of the epileptogenic area at seizure onset in patients. It is shown that time and frequency at seizure onset can be precisely detected in the time‐frequency domain and those localization results are stable over seizures. The results suggest that the method could also be applied to localize generators in single trial evoked responses or spontaneous activity. Hum. Brain Mapping 14:81–95, 2001. © 2001 Wiley‐Liss, Inc.
Keywords: time frequency, inverse solutions, non‐stationary signals, epilepsy, single trial ERPs
INTRODUCTION
The neuroelectromagnetic inverse problem is a highly underdetermined mathematical problem, which lacks a unique solution. Uniqueness is usually achieved by imposing specific constraints on the source space [Fuchs et al., 1999; Grave de Peralta Menendez and Gonzalez, 1998b; Scherg and Von Cramon, 1985]. In principle two major classes of solutions exists that differ in the source model they consider: dipoles and distributed source models. Although both approaches tend to provide reasonable results when the number of activated sources is small, they are inadequate or even meaningless when the number of activated sources approaches or surpasses the number of sensors. Although multidipole models cannot estimate this increasing amount of parameters [Achim et al., 1991; Cabrera Fernandez et al., 1995], the distributed solutions generally provide fixed source patterns that are independent of the actual source configuration [Grave de Peralta Menendez and Gonzalez, 1998a, Grave de Peralta et al., 2000].
Whereas for averaged data such as the early responses of event related potentials or for averaged epileptic spikes relatively simple source configurations can be expected, it is not likely to be the case for event related single trials, seizures or spontaneous activity. Still localization of the generators of single events in both cases are highly desired because it is known that averaging prevents the detection of events that are not completely synchronized to the stimuli [Tallon‐Baudry et al., 1997].
A vast literature support the hypothesis that frequency synchrony is a basic organization principle of the brain [Eckhorn et al., 1992; Fries at al., 1997; Gray and Singer, 1989; Roelfsema et al., 1997]. Thus, it is reasonable to assume that the source patterns arising at specific time frames at a given frequency should be simpler or at most as complex as the combination of them for the same time frame. On this basis, we propose in this study to localize by means of distributed solutions the generators at those scalp maps associated with specific times and frequencies where an automatic test suggests the existence of a relatively simple scalp potential pattern.
This approach generalizes the FFT approximation described by Lehmann and Michel [1990] that aimed to facilitate the localization of intracerebral generators at particular frequency bands. This idea, i.e., the localization of generators in the frequency domain has been often reconsidered and extended [Lütkenhöhner, 1992; Raz et al., 1992; Tesche and Kajola, 1993; Valdés et al., 1992] and applied to experimental and clinical data considering distributed inverse solutions or dipoles [Blanke et al., 2000; Michel et al., 1999]. In particular Sekihara et al. [1999] considered the problem of localizing MEG generators in the time‐frequency domain. These authors calculated a time‐frequency domain matrix in which diagonal and off‐diagonal terms are the auto and cross‐time‐frequency distributions of multichannel MEG recordings and applied afterwards the MUSIC algorithm [Schmidt, 1986] to the average of the time‐frequency matrix over preselected regions of interest. Whereas the latter method can be seen as the generalization of the proposals of L̈tkenhönner [1992], Raz and Turetzky [1992] and Valdes et al. [1992] to the time‐frequency domain, the variant described here choose the appealing variant of Lehmann and Michel [1990] where the computationally expensive handling of covariance matrices is avoided.
The non‐stationary distributed source isolation technique bears the following advantages over the FFT dipole approximation: 1) a figure of merit is proposed to isolate time‐frequency pairs at which a distributed inverse solution has more chances to provide meaningful results because of the simplicity of the scalp maps; 2) the source pattern arising for each specific frequency is allowed to change over time and thus non‐stationary temporal source patterns can be analyzed; and 3) frequency changes can be traced over time in the millisecond range that facilitates seizure onset localization, detection of transient events or changes in the neural network organization. Furthermore, the non‐stationary assumption is not only more general but describes also better the brain behavior. Assuming a single specific source pattern acting at a given frequency for a whole time interval precludes that brain areas can synchronize at a given frequency for short time intervals as one could expect in a fast parallel serial processing driven by frequency synchronization.
In brief, the method described here is intended to deal with distributed sources with a non‐stationary behavior over time. The initial part of the study describes the theoretical basis of the method as well as that of the test used to evaluate the “simplicity” of the patterns that arise at each time‐frequency. Simulated results are shown to illustrate the advantage of the time‐frequency approach. The method is applied to the localization of seizure onset in temporal and extratemporal epilepsy in patients where surgical outcome is known. The limitations and advantages of the method are discussed.
MATERIALS AND METHODS
On the basis of the superposition principle it is possible to express the potential (or magnetic field) measured at/near N e sensors on the scalp surface as the superposition of pattern vectors (maps) P i with weights determined by the scalar temporal functions f i(t), i.e.,
| (1) |
Equation (1) expresses that scalp measurements can be seen as superposition of fixed potential patterns where each pattern is characterized by a certain time dependent function. Note that these potential patterns are not necessarily generated by a single dipole but could instead be produced by an arbitrary set of sources sharing similar behavior in time. In the FFT dipole approximation [Lehmann and Michel, 1990] the measured potentials are transformed to the frequency domain using the Fourier transform. This approach is unable to deal with non‐stationary temporal functions, that is, signals whose frequency content is varying with time. Non‐stationary signals appear quite often in brain signals [Gersch, 1987].
To account for possible non‐stationarities in the temporal behavior of the patterns f i(t), a more general decomposition of the measured potential vector in terms of a time‐frequency representation [Boudreaux‐Bartel, 1996; Lin and Chen, 1996] can be used. Time‐frequency representations (TFRs) generalize the concept of the time and frequency domains to a joint time‐frequency function that indicates how the frequency content of a signal s changes over time.
There are a multitude of time‐frequency representations that range from the well known short time Fourier transform (STFT) to the scalogram based on the wavelet transform [Unser and Aldaroubi, 1996] or the more recently developed S‐transform [Stockwell et al., 1996]. All TFRs have in common that they transform a one‐dimensional signal to a two dimensional representation in the time‐frequency plane where the spectral properties are tracked over time. Spots (energy concentrations) in the time‐frequency plane identify the elementary signals (components or atoms) composing the original signal.
To transform measured potentials to the time‐frequency domain it is convenient to select a linear TFR because such transform will affect exclusively the temporal behavior of the patterns while leaving intact the patterns itself. In other words, the P i vector remains interpretable as a potential and the functions f i are transformed to the time‐frequency domain, i.e.,
| (2) |
where w denotes frequency and Ṽ, f̃ stand for the time‐frequency representation of V and f respectively. There are several examples of linear TFR, the wavelet transform, the STFT or the S‐transform. The S‐transform provides frequency‐dependent resolution while maintaining a direct relationship with the Fourier spectrum. Due to reasons that will be clarified later, it is convenient to select a TFR with complex coefficients such as the S‐transform or the STFT. For latter case, the continuous STFT of V and f reads:
 |
(3) |
and
 |
(4) |
where h(t) is a short analysis window localized around t = 0 and w = 0. Note that V(t) and Ṽ (w,t) are vectors with N e components. In what follows subscripts will be used to denote indexes of the patterns and superscripts for components within the measurement vector.
Let us assume that for one specific frequency w = w* at a given time t = t*, only one of the patterns, the k‐th, is active, i.e.,
| (5) |
In this case, equation (2) reduces to
| (6) |
We denote by m i the two‐dimensional column vector composed by the real and the imaginary parts of the i‐th component of inline Ṽ (w*, t*), i.e.,
| (7) |
If the hypothesis that the k‐th pattern acts alone holds, then the set of 2D points m i (i = 1…Ne) form a straight line on the x,y plane. If more than one pattern is active, they form a cloud of points on the x,y plane. Consequently, the plot of the real versus the imaginary part of the transformed potential data provides the basis for a test to detect pairs (t*,w*) at which the scalp potential map is simple in the sense that it is not the superposition of several potential maps P but a single map that dominates all over the others [Michel et al., 1990]. The convenience of selecting a complex valued time‐frequency representation (e.g., the STFT or the S‐transform) results evident. The test for deviation of linearity, termed from now on the map simplicity test, can be automatically done considering the eigenvalues associated to the second moment matrix C of the 2‐dimensional resulting cloud of points with respect to the origin, i.e.,
| (8) |
Because C is (semi) positive definite it can be decomposed as:
The ratio between the minimum (λ2) and the maximum eigenvalue (λ1), i.e.,
| (9) |
is proposed as a figure of merit to evaluate deviation from the straight line. Note that with this definition, r is constrained to the interval [0 (straight line), 1(circle)]. Clearly, if the r value is near to zero it is reasonable to accept that the pattern is simple and thus that an adequate estimator of the r‐th component of the active (k‐th) pattern inline P̂ at the corresponding (t*,w*) pair is given by the projection of the STFT of the data over the subspace associated to the largest eigenvalue λ1 i.e.,
| (10) |
Note that the projection of the coefficients over this subspace has the interpretation and physical units of the measured data. This estimated vector map is the one used as the input for the source localization procedure when the value of r is low enough.
A second criterion could be useful to decide, without any a priori information about the sources, which are the time and frequencies pairs at which a distributed inverse solution has the higher chances to succeed. This criterion is related with the energy of the estimated maps on the time‐frequency plane and we have termed it, time‐frequency energy. High values of this magnitude suggest the presence of strong sources at those time‐frequency pairs.
Summarizing, the concrete steps proposed to simplify the localization of distributed generators in the time‐frequency domain are:
-
1
Register the data.
-
2
Apply the STFT to the recorded data matrix according to equations 9 ((2), (3), (4)). For EEG measurements, transform the data to average reference.
-
3
Compute the eigenvalues and eigenvectors of the second order moment matrix (equation 8).
-
4
Compute the scalp map simplicity test, i.e., the value of r defined by equation (9) and use the time‐frequency energy plot and the r plot to select the time‐frequency pairs to be localized.
-
5
Apply a distributed inverse solution to the estimated pattern inline P̂k at pairs (t*,w*) at which r is near to zero to obtain an estimation of the generators of the scalp maps associated to the specific (t*,w*).
RESULTS
This section describes the results obtained with this method in some computer‐generated data as well as in the analysis of the ictal EEG of an epileptic patient. Although the goal with the synthetic data is to exemplify all the steps of the proposed method, the patient's analysis aims to illustrate its applicability to experimental data. The proposed isolation technique is a hybrid of tools with well‐established mathematical properties, i.e., time‐frequency representations and inverse solutions. Thus, we do not pursuit with the simulations a systematic testing of these tools but instead to illustrate how they can be combined to produce meaningful results in the analysis of experimental data. It is nearly impossible to extend the simulations to encompass all the practical difficulties that one has to face when dealing with experimental data. It is troublesome to produce synthetic data that resemble the way in which brain areas communicate because we have still little clues about this topic. For this reason, we prefer to present a simple illustrative example with simulated data and to evaluate afterwards the potential of the method in experimental data where we aim to apply it and where we count with the golden standard of intracranial recordings to confirm the localization results.
Analysis of Synthetic Data
Figure 1 depicts the position of the three sources used in the simulation and their time‐frequency characterization. The tip of each arrow marks the position of the source on the sagittal slices of a brain obtained from the average of 152 normal volunteers, available in the Statistical Parametric Mapping Toolbox [Friston et al., 1995]. The arrows link sources to their corresponding spectra (shown at the left), time course (top) and time‐frequency coefficients calculated by means of the short time Fourier transform. Note that the three sources are chosen to produce separable energy spots on the time‐frequency plane. There are two sources active at t = 40 but with different frequencies, one at f = 0.1 and the other at f = 0.4. A third source is active at t = 80 and f = 0.1. Frequencies are normalized to be between zero and one.
Figure 1.
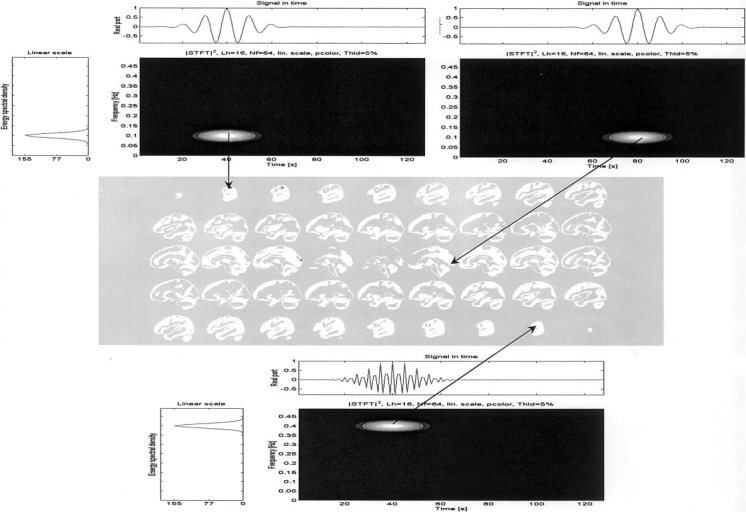
Simulated sources positions, time courses, frequency spectrum and time‐frequency behavior. The tip of each arrow marks the position of the source on the sagittal slices of an averaged brain The arrows link the sources to their corresponding spectra (shown at the left), time course (top) and time‐frequency coefficients.
The time courses of the three sources are assumed to represent intracranial potentials. The direct problem was solved to obtain the scalp potentials on 125 electrodes homogeneously distributed over the scalp surface. The STFT was computed using the function provided for such purpose in the Matlab Signal Processing Toolbox. This function splits the signal into overlapping segments, windows each segment with a predefined window (Hanning of length 7 in our case) and forms the columns of the time‐frequency representation with their zeros padded discrete Fourier transform of length 128. An overlapping of 6 frames was allowed in the windowing of the signal.
Figure 2A shows the time‐frequency energy plot for the previously described scalp data composed by three sources. The three clear spots at the correct time‐frequency pairs illustrate that the spectrogram of the scalp data is able to discriminate the number of sources and their properties. The time‐frequency energy plot suggests as interesting spots the pairs t = 40, f = 0.1; t = 40, f = 0.4; t = 80; f = 0.1. The second plot in Figure 2B depicts the coefficients of the simplicity test described in previous section, i.e., the map simplicity test. High values of the coefficients (lighter colors) denote the regions of the time‐frequency plane where the scalp maps seem to represent the superposition of more than one pattern and thus indicate that the source distribution might be more complex. Note that the pairs selected based on the time‐frequency energy correspond in Figure 2B dark areas, indicating that localization could be attempted at this pairs. Note also that this plot splits the time‐frequency plane into three regions where the sources are acting alone. It also correctly indicates an increasing complexity of the potential patterns at those regions where the activity of the sources overlap (see their temporal courses in Fig. 1).
Figure 2.
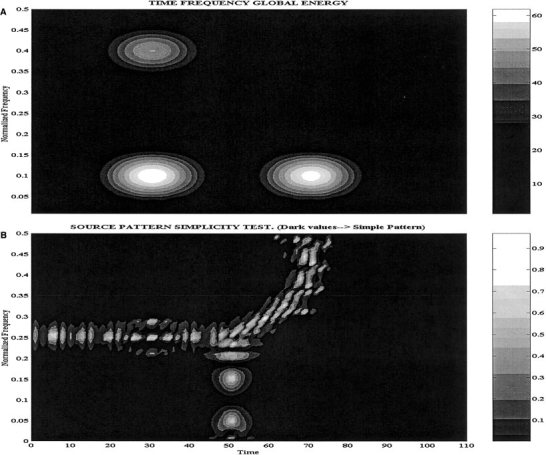
A: Time‐frequency energy. B: Scalp Map simplicity test for the data generated by the combination of the three sources shown in Figure 1.
Figure 3 depicts the localization obtained for the three time‐frequency pairs selected because of previous tests. The results are obtained with ELECTRA inverse solution [Grave de Peralta et al., 2000] that constraints because of physical reasons, the primary currents to be irrotational. In the plots, the highest absolute value of the estimated solution is encircled to facilitate discrimination. Figures 3A–C depict the localization for t = 40, f = 0.1; t = 80; f = 0.1 and t = 40; f = 0.4 respectively. Comparisons with the actual source positions represented in Figure 1 show the accuracy in their localization. In conclusion, in this example the isolation approach allowed to accurately identify the number of sources, their frequency and their localization.
Figure 3.
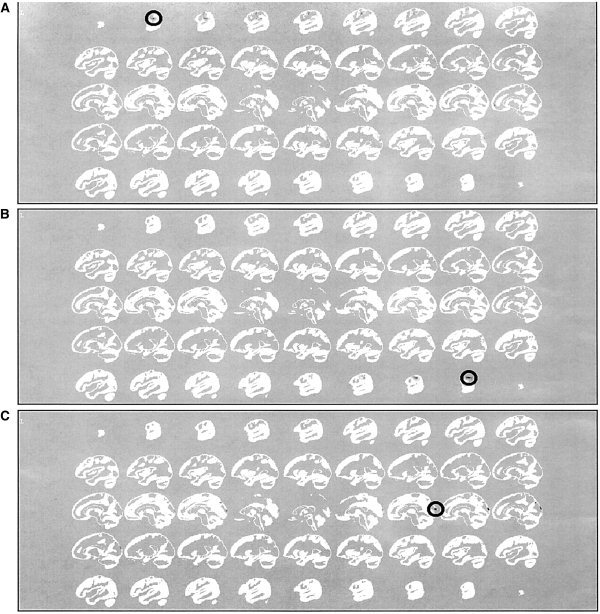
Source localization obtained using ELECTRA for the three time‐frequency pairs selected according to Figure 2. A: Localization for t = 40, f = 0.1; (B) for t = 80; f = 0.1; (C) for t = 40; f = 0.4. Maxima are encircled to facilitate discrimination given the focalization of the reconstructed sources.
Analysis of Seizure Onset in Epileptic Patients
Previous simulation helps to understand the method and to evaluate its performance in a situation without noise and where all parameters are controlled. Everyday experimental data are noisy, however, and it is not likely to find in‐practice generators with such well‐defined patterns in the time‐frequency plane. Thus, in this section we show the results of a more clinically relevant analysis carried on to localize seizure onset in an epileptic patient.
The patient is an 18‐year‐old, right‐handed woman who started having seizures at the age of seven. The habitual seizures began with an impairment of consciousness and were followed by manual automatism and a rightward deviation of the eyes and the head. Seizure frequency was 5–12/week, often followed by secondary generalization. On admission, neurological examination and MRI were normal. Presurgical evaluation, including continuos video‐EEG recording, nuclear imaging, and neuropsychological testing indicated left frontal epilepsy. Invasive monitoring was demanded to precisely localize the epileptic focus and to differentiate it from eloquent cortex.
More than 12 seizures were recorded in this patient from 28 scalp electrodes (sampling rate 128 Hz). Two typical seizures are shown in Figures 4B and 5B. The same analysis procedure described before was applied to eight of the seizures that showed fewer artifacts. For the computation of the STFT, we used a Kaiser window of 128 points with an overlapping of 126 points, which is in practical grounds a more convenient selection than the Hanning window for the analysis of experimental data. Frequency resolution was again set to one Hz resulting in a temporal resolution of around 30 msec. For all eight seizures, we found very similar patterns for the energy in the time‐frequency plane. Typical time‐frequency patterns for the seizures are shown in Figures 4A and 5A, respectively. According to the plots, seizures start with a frequency of 10–11 Hz and the frequency slightly decrease afterwards. The periods of high energy are associated to periods were the scalp map simplicity test suggests reliable localization. Note that there is a perceptible shift in time between the seizures plots and their time‐frequency representation that is due to the use of a sliding window for the computation of the time‐frequency representation. This implies that the initial 64 samples of the seizure are not reflected in the time‐frequency plots.
Figure 4.
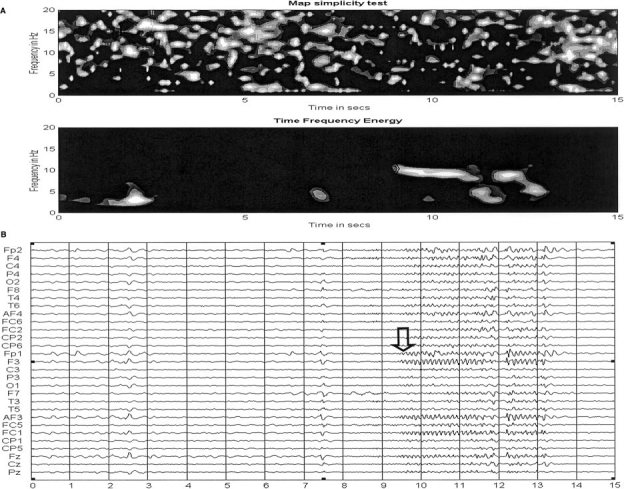
A: Scalp Map simplicity test and time‐frequency energy for the seizure. B: A typical seizure for the patient. Note that the time‐frequency plots are slightly shifted (64 frames) with respect to the seizure plot due to the use of a sliding window in the computation of the time‐frequency representation. Despite the shift, spikes and seizure onset are clearly detected by the time‐frequency energy plot. The arrows mark the time of seizure onset in the time‐frequency energy (A) and the EEG (B).
Figure 5.
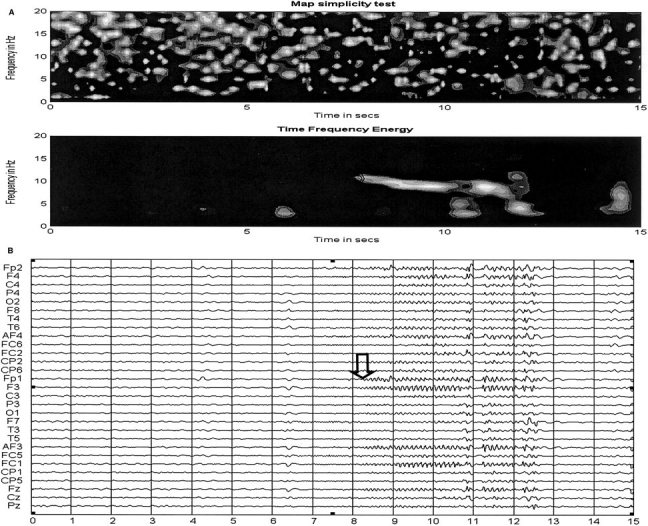
Idem to Figure 4 for a second seizure of the patient, i.e., (A) Scalp Map simplicity test and time‐frequency energy for the seizure shown in (B). Note that the pattern at seizure onset on the time‐frequency energy plot is nearly identical to that of a different seizure shown in Figure 4A.
Localization was carried out on the individual patient MRI using ELECTRA. The point marked by an arrow on the time‐frequency energy plot in Figures 4A and 5A were considered as the start of the seizure as suggested by the emergence of a sustained rhythm. The localization results for these pairs are shown in Figures 6 and 7. The lighter colors indicate the electrical activation detected by the inverse solution, confined in this case to the left frontal lobe. The gray scale representation of the solution impedes the differentiation between positive and negative potentials. A color representation plate will show positive polarity at the upper frontal site with a posterior negativity in the slice below. No significant activity is observed in other MRI slices except for the neighborhood of the maxim, which can be explained in terms of the natural blurring inherent to distributed inverses. In the analysis over time for this frequency, we observed that the inverse solution results remained identical for the next 150 msec. Such stability of the localization results over time and the absence of additional activation spots on other MRI slices corroborate the simplicity of the scalp map detected by the simplicity test. Note that the localization algorithm suggests as the epileptogenic area the left frontal lobe, which coincides with the invasive electrocorticographical findings. Figure 8 shows the results of directly applying ELECTRA to the scalp potential map visually identified as the time of seizure onset for the seizure shown in Figure 4B (marked with an arrow). It is noticeable that several functionally different areas seem to be simultaneously activated. Although, the maxima of the activity at this time coincides with the one found with the source isolation approach, we observe a more widespread activation including bilateral activation of frontal lobes. Also, contrasting with the stability of the localization results over time observed for the source isolation approach, in the temporal estimation the position of the maxima abruptly changes from one hemisphere to the other for the maps corresponding to the subsequent 150 msec.
Figure 6.
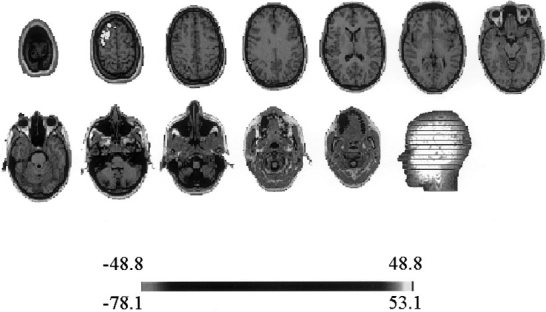
ELECTRAs localization results using the source isolation approach at time‐frequency pair marked with an arrow in the time‐frequency energy plot shown in Figure 4A and identified as time of seizure onset. Lighter colors indicate strongest electrical activation that is restricted for this time‐frequency pair to the left frontal lobe.
Figure 7.
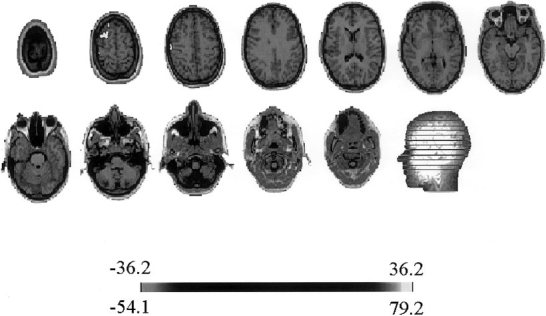
ELECTRAs localization results using the source isolation approach at time‐frequency pair marked with an arrow in the time‐frequency energy plot shown in Figure 5A and identified as time of seizure onset. Note that except for the intensity of the activity (see scale) the localization results are identical to.
Figure 8.
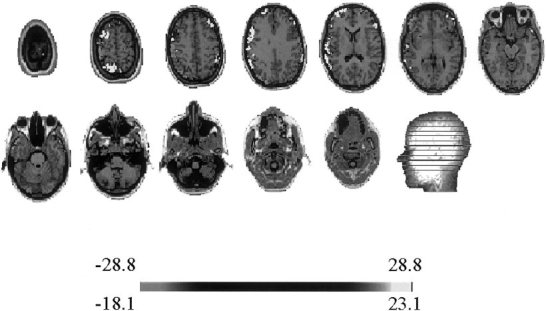
ELECTRA solution for the raw EEG data at the time of seizure onset marked with an arrow in Figure 4B. Note the more sparse character of the solution when compared with the solution shown in Figures 6 and 7 with bilateral activation in frontal lobes and other cortical sites.
DISCUSSION
Until recently, spectral analysis of brain activity was limited to signals without major temporal changes or that are slowly changing with time. The development of signal processing techniques able to deal with non‐stationary signals has broadened the range of applications of this technique. It is evident that time‐frequency analysis is a more general approach to study spontaneous or evoked brain activity than temporal or spectral analysis alone. The enormous amount of data generated by this processing, however, is overwhelming. This problem is avoided here by using a summarizing measure, the time‐frequency energy that indicates the energy of each (estimated) potential map in the time‐frequency plane. In practice, this plot although based on the estimated maps, looks nearly identical to the average of the squared STFT over channels. There are several reasons to believe that this plot could become a useful summarizing tool to differentiate (if possible) epileptic seizures according to their frequencies. First, time and frequency at seizure onset were adequately detected by this single plot. This is certainly not easy by simple visual EEG inspection or spatial analysis alone. Furthermore, isolated spikes or transient events are reflected as energy spots in this map. In classical spectral analysis this events are smeared over the spectrum and therefore non‐longer recognizable. There is an obvious price to pay for compressing all this information in a single measure. Weak rhythmic events with very focal localization will be hardly seen in the measure that is, however, capable of detecting focal strong events such as the epileptic spikes in the examples shown in Figures 4 and 5.
Time‐frequency analysis provides a powerful alternative for isolating signal components of interest from contaminating noise components. Noise can be identified much more easily in the joint time‐frequency domain than in either the time or the frequency domain alone. Although noise tends to spread widely in the time‐frequency plane, neurophysiological signals are often concentrated [Gonzalez et al., 2000]. This explains why the approach proposed here constitute a solution to the problem of separating signal components of interest from the noisy data. Rhythmic activity of the generators arrives simultaneously to all sensors because dielectric effects are negligible in brain tissues at the frequencies of interest. Consequently, the signal's time‐frequency characteristics associated to brain responses must be similar in all channels. In contrast, individual sensors noise will be hardly seen in the time‐frequency energy plot because the averaging will suppress activity not highly correlated over channels. Consequently, the maps selected on the basis of this approach should be less noisy and complex than the corresponding maps in the temporal domain, which suggests that localization of events buried into spontaneous activity could be possible. Obviously, if signal and noise share simultaneously similar frequencies no reliable localization will be obtained.
There are different possibilities to use time‐frequency analysis for simplifying maps to consider for source localization. The approach described here is computationally less expensive than filtering the data at given frequency bands and localizing afterwards the generators at each time frame. In such an approach there is no clear way to decide which frequency band and times should be of interest to essay source localization. Equation (1) represents a factorization of the scalp measured data into spatial and temporal patterns that is also at the basis of methods such as PCA or its generalization to non‐gaussian data known as ICA. These methods have been also used to decompose the scalp maps before applying source localization algorithms. Although the basic limitations of PCA have been known for a while, the number of applications combining ICA decomposition and inverse solutions is increasing. In this combination, ICA is used to separate the multichannel EEG data into activation maps due to temporally independent stationary sources. The inverse solution is afterward applied to the different activation maps. The basic difficulty we see in this procedure is the strong hypothesis underlying the ICA method itself: generators composing a neural network have statistically independent temporal behavior. This hypothesis somehow contradicts the idea of short‐lived periods of frequency synchronization, which establish explicit non‐stationary temporal dependencies among the temporal courses of the network components. There is no guarantee that the ICA estimated activation maps (correctly determined up to a constant factor) are generated by a simple generator configuration neither there is test to evaluate their simplicity. There is consequently, no reason to expect a better behavior of a distributed inverse than when applying such inverse to the original measured maps. Previous arguments explain why do we consider more neurophysiologically appealing the source isolation technique described in this study accompanied by the simplicity test to help to reduce the amount of maps to localize.
There are, however, limitations that we have to be aware of. First, test for the simplicity of the patterns can produce false positive results. Second, as happens with many methods of analysis in functional neuroimaging, there is no clear way to select a threshold in the value of r to confirm that a map is simple. So far, we have no definitive answer to this question unless we restrict our definition of simple patterns to those generated by single dipoles. Only in that case, could we carry out a sequence of simulations to statistically select a threshold based on an empirical distribution of the r‐values. For more general sources distributions we would have to define first the meaning of simple (we are using a rather intuitive definition) and such definitions end sometimes in rather cumbersome or philosophical problems. For this reasons we prefer to use a very practical (empirical approach) in which we localize potential maps where the combination of both measures, i.e., time‐frequency energy and simplicity test suggest chances to succeed. In addition, the simplicity test described in this study relies on two assumptions: a) the selected time‐frequency representation is linear, and b) the coefficients of the TFR have an imaginary part. These assumptions somehow limit the use of time‐frequency representations different from the STFT or the S‐transform. Still, these TFRs can be seen as complementary because the S‐transform have resolution properties similar to the wavelet transform whereas the STFT is a simple but more convenient representation for signals whose energy is concentrated in the low frequency band. Although we have not extensively tested the S‐transform, its resemblance to the wavelet transform allows to infer that this transformation will succeed in achieving high temporal resolution for the high frequency band but poorer resolution than the STFT for the low frequency band. Because seizures basically arise in the delta‐theta‐alpha bands, there is no theoretical reason to expect that the results described in this study could be improved by employing the S‐transform. The same does not hold for the analysis of single trials event related potentials where the S‐transform could be more effective to detect short lived periods of synchronization on the low or high gamma bands. In any case, the trade off between time and frequency resolution is inherent to all time‐frequency representations. The more it is refined the resolution in time the worse will the resolution in frequency be and vice versa. Because it is now accepted that human neuronal networks synchronize over short time intervals on particular frequency bands we consider this approach more neurophysiologically sound that localization at single time frames or at specific frequencies alone and we expect that the resolution in time‐ frequency attainable with the STFT or the S‐transform should suffix to characterize most of the studied processes at least for the classically defined EEG frequency bands. Further research in this direction is still required.
Although illustrated here in the analysis of epileptic seizure onset with a predefined inverse solution, the applicability of the method extends far beyond these limits. Any arbitrary inverse solution could be applied to the maps obtained after applying the source isolation technique, which could be particularly interesting for inverses that assume the existence of a single generator. The results obtained with real data suggest that the method could be applied to the tracing over time of the generators responsible for specific brain rhythms. This is of major importance for many drug studies [Dierks et al., 1993; Michel et al., 1993]. In addition, many psychiatric diseases are characterized by frequency changes [Galderisi et al., 1992]. In the particular case of epileptic seizures, the fact that this approach can detect quite precisely the time and frequency of the seizure (ictal) onset constitutes its enormous advantage over the classical FFT. Nevertheless, the most appealing application of this technique is in our opinion the localization of the generators of single trial evoked responses.
CONCLUSIONS
We have described a method to simplify the localization of distributed generators based on isolating patterns in the data that are simple enough in the time‐frequency domain to expect a reliable performance of the inverse solution. The key to this method is the transformation of the recorded data to the time‐frequency domain by means of the Short Time Fourier Transform, i.e., the method can deal with data with spectra changing over time. An automatic test to evaluate how simple are the potential patterns to be localized was also developed. The performance of the method in synthetic and experimental data is shown to be adequate. The distributed source isolation technique is applicable to non‐stationary electric and magnetic recordings of the CNS activity eliminating a major limitation of previous methods to localize sources in the frequency domain.
REFERENCES
- Achim A, Richer F, Saint‐Hilaire J. 1991. Methodological considerations for the evaluation of spatio‐temporal source models. Electroencephalogr Clin Neurophysiol 79: 227–240. [DOI] [PubMed] [Google Scholar]
- Blanke O, Lantz G, Seeck M, Spinelli L, Grave de Peralta Menendez R, Thut G, Landis T, Michel CM. 2000. Temporal and spatial determination of EEG seizure onset in the frequency domain. Clin Neurophysiol 111: 763–772. [DOI] [PubMed] [Google Scholar]
- Boudreaux‐Bartel GF. 1996. Mixed time‐frequency signal transformations In: Poularikas A, editor. The transforms and applications handbook. Boca Raton: CRC Press; p 887–963. [Google Scholar]
- Cabrera Fernandez D, Grave de Peralta R, Gonzalez Andino S. 1995. Some limitations of spatio temporal source models. Brain Topogr 7: 233–243. [DOI] [PubMed] [Google Scholar]
- Dierks T, Engelhart W, Maurer K. 1993. Equivalent dipoles of FFT data visualize drug interaction at benzodiazepine receptors. Electroencephalogr Clin Neurophysiol 86: 231–237. [DOI] [PubMed] [Google Scholar]
- Eckhorn R, Schanze T, Borsch M, Salem W, Bauer R. 1992. Stimulus‐specific synchronizations in cat visual cortex: multiple microelectrode and correlations studies from several cortical areas In: Basar E, Bulloch TH, editors. Brain dynamics: progress and perspectives. Berlin: Springer; p 47–82. [Google Scholar]
- Fries P, Roelfsema PR, Engel AK, Konig P, Singer W. 1997. Synchronization of oscillatory responses in visual cortex correlates with perception in interocular rivalry. Proc Natl Acad Sci USA 94: 12699–12704. [DOI] [PMC free article] [PubMed] [Google Scholar]
- Friston KJ, Ashburner J, Poline JB, Frith CD, Heather JD, Frackowiak RSJ. 1995. Spatial registration and normalization of images. Hum Brain Mapping 2: 165–189. [Google Scholar]
- Fuchs M, Wagner M, Kohler T, Wischmann HA. 1999. Linear and nonlinear current density reconstructions. J Clin Neurophysiol 16: 267–295. [DOI] [PubMed] [Google Scholar]
- Galderisi S, Mucci A, Mignone ML, Maj M, Kemali D. 1992. QEEG mapping in drug‐free schizophrenics: differences from healthy subjects and changes induced by haloperidol treatment. Schizophr Res 6: 15–24. [DOI] [PubMed] [Google Scholar]
- Gersch W. 1987. Non‐stationary multichannel time series analysis In: Gevins AS, Remond A, editors. Handbook of electroencephalography and clinical neurophysiology. Vol. 1 Methods of analysis of brain electrical and magnetic signals. Amsterdam, New York, Oxford: Elsevier; p 261–296. [Google Scholar]
- Gonzalez Andino SL, Grave de Peralta Menendez R, Thut G, Spinelli L, Blanke O, Michel CM, Landis T. 2000. Measuring the complexity of time series: an application to neurophysiological signals. Hum Brain Mapping 11: 46–57. [DOI] [PMC free article] [PubMed] [Google Scholar]
- Grave de Peralta Menendez R, Gonzalez Andino SL. 1998b. Distributed source models: standard solutions and new developments In: Uhl C, editor. Analysis of neurophysiological brain functioning. Heidelberg: Springer Verlag; p 176–201. [Google Scholar]
- Grave de Peralta Menendez R, Gonzalez Andino SL. 1998a. A critical analysis of linear inverse solutions. IEEE Trans Biomed Eng 45: 440–448. [DOI] [PubMed] [Google Scholar]
- Grave de Peralta Menendez R, Gonzalez S, Morand S, Michel CM, Landis T. 2000. Imaging the electrical activity of the brain: ELECTRA. Hum Brain Mapping 9: 1–12. [DOI] [PMC free article] [PubMed] [Google Scholar]
- Grave de Peralta Menendez R, Gonzalez SL. 2000. Discussing the capabilities of Laplacian minimization. Brain Topogr 13: 97–104. [DOI] [PubMed] [Google Scholar]
- Gray CM, Singer W. 1989. Stimulus‐specific neuronal oscillations in orientation columns of cat visual cortex. Proc Natl Acad Sci USA 86: 1698–702. [DOI] [PMC free article] [PubMed] [Google Scholar]
- Lehmann D, Michel CM. 1990. Intracerebral dipole source localization for FFT power maps. Electroencephalogr Clin Neurophysiol 76: 271. [DOI] [PubMed] [Google Scholar]
- Lin Z, Chen JD. 1996. Advances in time‐frequency analysis of biomedical signals. Crit Rev Biomed Eng 24: 1–72. [DOI] [PubMed] [Google Scholar]
- Lütkenhöner B. 1992. Frequency domain localization of intracerebral dipolar sources. Electroencephalogr Clin Neurophysiol 82: 112–118. [DOI] [PubMed] [Google Scholar]
- Michel CM, Henggeler B, Lehmann D. 1990. Correlation between original‐ and single‐dipole approximated power maps. Brain Topogr 3: 255–256. [Google Scholar]
- Michel CM, Grave de Peralta R, Lantz G, Gonzalez Andino S, Spinelli L, Blanke O, Landis T, Seeck M. 1999. Spatio‐temporal EEG analysis and distributed source estimation in presurgical epilepsy evaluation. J Clin Neurophysiol 16: 239–267. [DOI] [PubMed] [Google Scholar]
- Michel CM, Koukkou M, Lehmann D. 1993. EEG reactivity in high and low symptomatic schizophrenics, using source modeling in the frequency domain. Brain Topogr 5: 389–394. [DOI] [PubMed] [Google Scholar]
- Raz J, Turetsky B, Fein G. 1992. Frequency domain estimation of the parameters of human brain electrical dipoles. J Am Stat Assoc 87: 69–77. [Google Scholar]
- Roelfsema PR, Engel AK, Konig P, Singer W. 1997. Visuomotor integration is associated with zero time‐lag synchronization among cortical areas. Nature 385: 157–161. [DOI] [PubMed] [Google Scholar]
- Scherg M, Von Cramon D. 1985. A new interpretation of the generators of BAEP waves I–V: results of spatio‐temporal dipole model. Electroencephalogr Clin Neurophysiol 62: 290–299. [DOI] [PubMed] [Google Scholar]
- Schmidt RO. 1981. A signal subspace approach to multiple emitter location and spectral estimation. PhD thesis. Stanford, California: Stanford University.
- Sekihara K, Nagarajan S, Poeppel D, Miyashita Y. 1999. Time‐frequency MEG‐MUSIC algorithm. IEEE Trans Biomed Eng 18: 92–97. [DOI] [PubMed] [Google Scholar]
- Seeck M, Lazeyras F, Michel CM, Blake O, Gericke CA, Ives J, Delavelle J, Golay X, Haenggeli CA, de Tribolet N, Landis T. 1998. Non‐invasive epileptic focus localization using EEG‐triggered functional MRI and electromagnetic tomography. Electroencephalogr Clin Neurophysiol 106: 508–512. [DOI] [PubMed] [Google Scholar]
- Stockwell RG, Mansinha L, Lowe RP. 1996. Localization of the complex spectrum: the S‐transform. IEEE Trans Signal Processing 44: 998–1001. [Google Scholar]
- Tallon‐Baudry C, Bertrand O, Delpeuch C, Pernier J. 1997. Oscillatory gamma‐band (30–70 Hz) activity induced by a visual search task in humans. J Neurosci 17: 722–734. [DOI] [PMC free article] [PubMed] [Google Scholar]
- Tesche C, Kajola M. 1993. A comparison of spontaneous neuromagnetic activity in the frequency and time domains. Electroencephalogr Clin Neurophysiol 87: 408–416. [DOI] [PubMed] [Google Scholar]
- Valdes P, Bosch J, Rieral J, Grave de Peralta R. 1992. Frequency domain models for the EEG. Brain Topogr 4: 309–331. [DOI] [PubMed] [Google Scholar]


