

Abstract
Chinese bilinguals performed a delayed naming task, reading both Chinese characters and English words, while EEGs were recorded by a 128‐channel system. Principle component analysis (PCA) of Event Related Potentials (ERP) from the onset of the stimulus suggested a temporal unfolding of graphic, phonological, and semantic processing that depended on both language and word frequency. At 150 msec, Chinese produced an earlier and higher amplitude shift (N150) than English. At 250 msec, frequency effects were significant for both Chinese and English, but at 450 msec, only the English frequency effect was reliable. Source localization analysis by Low Resolution Electromagnetic Tomography (LORETA) showed bilateral occipital (left BA 17, right BA 18) visual processing of Chinese characters with left occipital only (left BA 17) for English high‐frequency words. Low‐frequency English words showed activation bilaterally, but with a more diffused and extended temporal pattern. Right prefrontal area (BA 10) was found to be strongly activated in the mid latency (300–400 msec) period of Chinese character naming, whereas English word naming showed more medial frontal (BA 8, and 10) activation. A post 450‐msec visual verification was found to be general for both writing systems. Hum. Brain Mapping 18:167–175, 2003. © 2003 Wiley‐Liss, Inc.
Keywords: PCA, source analysis, LORETA, frequency
INTRODUCTION
Brain mapping studies have identified widely distributed brain networks that support the orthographic, phonological, and meaning processes associated with word reading. These areas include, among others, left occipital and occipitotemporal cortex, the left frontal operculum, bilateral primary motor cortex, superior and middle temporal cortex, and medial regions such as the supplementary motor area and anterior cingulate as brain areas that support word reading [Fiez and Petersen, 1998]. An important question is the extent to which the identified areas are universal, supporting reading across very different writing systems, rather than specific to alphabetic writing.
Chinese provides a case of high contrast for alphabetic systems, because its graphic units, characters, do not represent phonemes, but rather morphemic (meaning‐bearing) syllables. Nevertheless, behavioral studies lead to the conclusion that automatic activation of both meaning and pronunciation occurs in reading Chinese characters, as it does in English [Chua, 1999; Perfetti and Tan, 1998; Perfetti and Zhang, 1995; Xu et al., 1999; Zhang et al., 1999]. Thus, despite the differences in their input units (characters vs. letters) and their mapping functions (syllables vs. phonemes), Chinese and alphabetic systems of reading are similar at this general level, with important processing differences in details [Perfetti et al., 2002].
Recent studies of brain mapping of Chinese have added to the conclusion that universal mechanisms are involved in reading, observing most regions found in English reading [Chee et al., 1999, 2000; Tan et al., 2000, 2001]. However, these studies have identified additional brain areas not often observed in alphabetic studies, especially left middle frontal areas (BA 9), additional right hemisphere cortical regions (BAs 47/45, 7, 40/39), and the right visual system [Tan et al., 2000, 2001].
To map the functions of both the universal and writing‐system specific brain areas, information is needed on the time‐course of reading. Although PET and fMRI provide no information during the less than 500 msec required to read a word, ERP records provide millisecond‐level temporal resolution during simple word reading. ERP recordings produce characteristic voltage shifts (components) that have been associated with reading processes, including the N200, which is sensitive to orthographic and phonological level processing [Kramer and Donchin, 1987], and the N400 (N450), which is sensitive to both phonology and meaning [Kutas and Hillyard, 1980; Rugg, 1984]. Bentin et al. [ 1999] have identified a fuller range of time points associated with inferred brain regions.
An alternative to visual identification of pre‐defined shifts in the ERP waveform is Principle Component Analysis (PCA), which extracts independent components based on the correlation matrix of all sample points. Because the variance of the full data pattern defines the components, PCA allows cognitively important components to emerge in the context of the overall variance pattern [Chapman and McCrary, 1995; van Boxtel, 1998].
The electromagnetic inverse problem [Koles, 1998], identifying the underlying brain sources for surface recorded voltage shifts, has limited the value of ERP for brain mapping. However, recent approaches to the inverse problem may permit at least limited information on brain sources of ERP activity. LORETA is a procedure that does not require assumptions about the location of dipoles. It also can identify deep cortical sources more reliably than other inverse solutions [Pascual Marqui et al., 1994; Vitacco et al., 2002], and may be especially suitable for mapping candidate reading areas at a coarse level.
We used ERP recordings, supplemented by source localization, to study the reading of Chinese and English by Chinese–English bilinguals (native language Chinese, second language English). We used delayed naming, a task that (1) allows the examination of a single word reading event and (2) requires a specific reading process, namely the preparation of a spoken word form for reading out loud. This task assures that orthographic and phonological processes are engaged implicitly and may be detected in the 1,000 msec prior to the signal to name the word. Furthermore, if ERP records are sensitive to word reading, then we should see a specific ERP indicator of a well‐established word processing variable such as word frequency for both Chinese and English. Finally, in addition to the 128‐channel recordings, source analysis (LORETA) can link coarsely mapped brain areas to the temporal data.
SUBJECTS AND MATERIALS
Subjects
Nineteen (11 men; 8 women) Chinese graduate students at the University of Pittsburgh were paid to participate. Their English proficiency exceeded the entrance criterion of a 550 score on the Test of English as Foreign Language (TOEFL).
Stimuli
Four experimental conditions were defined by language and frequency: high‐ (583.9/million) and low‐frequency (2.1/million) Chinese characters [Li and Liu, 1988]; high‐ (136.1/million) and low‐frequency (1.2/million) English words [Kucera and Francis, 1967]. The radical and stroke numbers were matched between high‐ and low‐frequency Chinese characters. Word length of high‐ and low‐frequency English words were matched. Thirty‐two experimental stimuli and eight fillers of the same type appeared in each condition. One Chinese and one English block were presented, each randomly mixed with high‐ and low‐frequency words.
Procedure
Participants named 20% of the stimuli in all conditions, with the English and Chinese blocks counter‐balanced across subjects. Each trial began with a waiting signal (∼***∼) that remained in the center of the screen until the subject initiated the trial. Subjects were told not to move their eyes or blink them once a trial had begun, but were encouraged to blink between trials. When the subject pressed the space bar, a fixation “+” appeared on the screen for 500 msec, followed by the stimulus, which was exposed for 1,500 msec. Subjects were told to have the pronunciation of the word in mind, ready to produce when the naming signal appeared. In 20% of the trials (fillers), a naming signal appeared 1,500 msec after the onset of the stimulus, followed in 2 sec by the waiting signal of the next trial. For the other 80% of the trials (experimental stimuli), a 2‐sec blank interval occurred instead of a naming signal indicating naming was not required.
EEG recording and averaging
A 15‐inch CRT monitor working at 60‐Hz refresh rate presented stimuli. A 128‐channel Geodesic Sensor Net (Electrical Geodesics, Eugene, OR) recorded the EEG data. All impedances were kept below 40KΩ [Ferree et al., 2001]. A vertex reference was used in the recording and the data were recomputed off‐line against the average reference. Six eye channels allowed rejection of trials with eye movements and blinks. The signals were recorded at 500 Hz. The hardware filter was between 0.1 and 200 Hz. ERPs were averaged off‐line over the experimental trials in each condition after the elimination of artifacts followed by a baseline correction and 30‐Hz software low‐pass filter.
Data analyses
Fifteen subjects provided data for ERP analysis (data from four subjects with a high percentage of artifact trials were rejected). The grand averaged ERP waveforms were calculated for each condition, based on the recordings from experimental trials only, from target onset to 1,000‐msec post‐onset. A temporal PCA was carried out on subject averages, based on 250 4‐msec time samples. Input for the PCA was a data matrix of 129 electrodes, 15, subjects and 4 stimuli types or 7,740 observations for each 4‐msec time sample, using the correlation matrix with Varimax rotation [Picton et al., 2000]. PCA scores were used as dependent measures in ANOVAs to test differences among experimental conditions.
RESULTS
Grand averaged outputs from 13 electrodes (F3, Fz, F4, C3, Cz, C4, P3, Pz, P4, T3, T4, O1, and O2 in 10–20 system) are shown in Figure 1 (μV).
Figure 1.
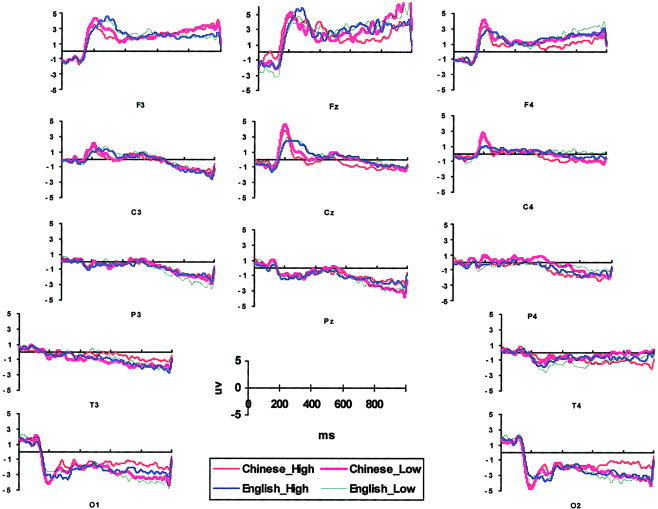
Grand average ERP waveform of 13 10–20 system electrodes.
PCA components
The PCA extracted a small number of independent components from the 250 variables corresponding to each 4‐msec ERP time period. Ten components had eigenvalues larger than 1, explaining 95.5% of the total variance. The eigenvalue dropped sharply from component 5 to 6 (11.13 vs. 2.62), suggesting that five components justified further analysis. The fourth component loading was mostly negative and did not match any ERP amplitude change. Accordingly, only the first, second, third, and fifth components (82.2% of total variance) were included in further statistical tests. (Note that “component” does not refer to voltage shifts but to a PCA component.)
Component 1 (39.8% explained variance), a slow‐wave component, rose slowly from 200 msec to its maximum at 1,000 msec. This slow‐wave component is widely found in PCA on ERP, sometimes a result of the autocorrelated nature of ERP data [Wastell, 1981].
Component 2 (23.2% explained variance) rose from 200 msec with a peak loading at 468 msec. The average component scores were positive except for four temporal and occipital electrodes. The peak matched the negative shift in the EEG data on F3, Fz, F4, C3, and Cz (Fig. 1). This component was called N450 to reflect its peak latency and shape.
Component 3 (14.9% explained variance) rose quickly from 150 msec, reaching a peak at 260 msec. The average component scores were positive for frontal and central electrodes and negative at parietal, temporal, and occipital electrodes. There was a 150–300‐msec occipital negative shift and a frontal and central positive shift in the ERP waveform (Fig. 1). This component was named N250.
Component 5 (4.5% explained variance) rose sharply from 130 through 250 msec, with a peak at 156 msec. The polarity of its scores changed across electrodes and conditions, mostly positive at frontal and negative at occipital. This component represented an earlier part of the 150–300‐msec shift and was named N150.
ANOVA
We carried out two ANOVAs, one testing the PCA scores for three medial electrodes (Fz, Cz, and Pz) and one for 10 lateral electrodes (F3, F4, C3, C4, P3, P4, T3, T4, O1, and O2). Each was a repeated‐measure ANOVA with language (Chinese and English), frequency (high and low), and site (frontal, central, and occipital) as factors. The ANOVA for the lateral electrodes added hemisphere as a fourth factor. The Greenhouse and Geisser [ 1959] correction was applied when the variance sphericity assumption was not satisfied, and the corrected P value and Epsilon used to adjust the degrees of freedom are reported. Post hoc t‐tests between conditions (without adjustment for multiple comparisons) were carried out (t values not presented here) when the overall ANOVA showed reliable condition effects.
The slow wave, N450, N250, and N150 components produced reliable differences among conditions, as described below.
Slow wave component
The slow wave was more positive at medial frontal (Fz) than medial central and parietal (Cz and Pz) (medial site effect, F(2,28) = 10.66, P < 0.01, MSE = 1.748, ϵ = 0.617). It was more negative for low‐frequency stimuli at medial parietal electrode Pz (medial frequency × site, F(2,28) = 7.380, P < 0.01, MSE = 0.17, ϵ = 0.681).
N450
Compared with the high‐frequency English words, low‐frequency English words elicited more negative N450 at right hemisphere electrodes (lateral language × frequency × hemisphere, F(1,14) = 5.85, P < 0.05, MSE = 0.447).
N250
This component was positive at frontal and central electrodes and negative at posterior electrodes (medial site effect, F(2,14) = 14.26, P < 0.01, MSE = 2.707, ϵ = 0.561; lateral site effect, F(4,56) = 17.67, P < 0.001, MSE = 1.757, ϵ = 0.441). For English, N250 component scores were more positive at bilateral frontal and left central electrodes, and more negative at occipital electrodes than for Chinese (lateral language × site, F(4.56) = 7.91, P < 0.01, MSE = 0.32, ϵ = 0.461). Chinese low‐frequency characters were more positive than high‐frequency characters at bilateral frontal electrodes, and English high‐frequency words were more negative than low‐frequency words at bilateral occipital electrodes (lateral language × frequency × site, F(4,56) = 10.46, P < 0.001, MSE = 0.08, ϵ = 0.551).
N150
This early component was more positive at frontal and central sites, and more negative at occipital sites for both writing systems (lateral site effect, F(4,56) = 4.16, P < 0.05, MSE = 3.62, ϵ = 0.323). For Chinese, the N150 was more positive at frontal electrodes and more negative at occipital electrodes than for English (medial language × site, F(2,28) = 24.83, P < 0.001, MSE = 0.179; lateral language × site, F(4,56) = 27.01, P < 0.001, MSE = 0.308, ϵ = 0.487).
Source analysis
LORETA was used to locate the source of ERP activity. LORETA finds the “smoothest” of all possible solutions consistent with the scalp distribution [Pascual Marqui et al., 1994]. Its solution space consists of 2,394 pixels with 7‐mm resolution. The LORETA‐KEY software (Pascual‐Marqui, retrieved November, 2000, online at http://www.unizh.ch/keyinst/loreta.htm) used in the analysis was registered to the Talairach brain atlas [Talairach and Tournoux, 1988].
The input for LORETA was the grand averaged ERP, sampled across time points from 100 to 500 msec from the onset of the stimulus at 50‐msec intervals. The outputs were 3D maps of activity value for each of 2,394 cortex pixels, based on the scalp distribution of each time point, with a subtraction of the averaged scalp distribution during the 100 msec prior to stimulus onset (corresponding to the “+” baseline). Those pixels among the top 5% in activation value of each 3D map were treated as “active” pixels and shown in red in LORETA maps (Fig. 2) to allow focusing on a reduced set of highly activated brain regions.
Figure 2.
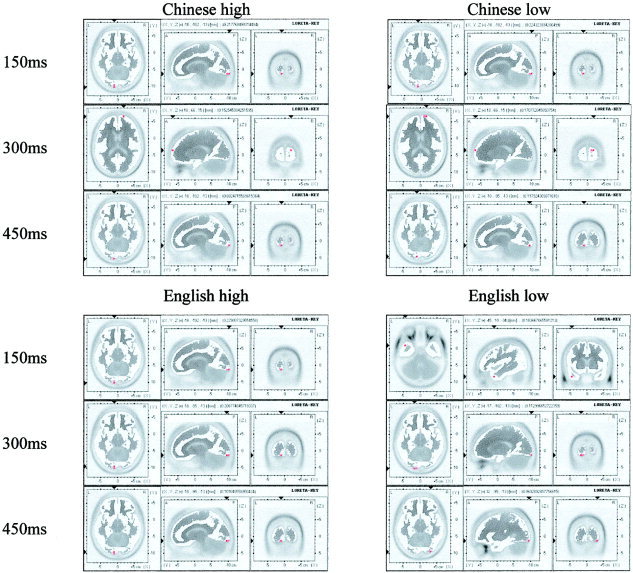
The LORETA maps for four experiment conditions with 150‐msec interval. Each map consists of axial, sagittal, and coronal planes showing the same activation area. Axial: left‐left, top‐anterior; sagittal: left‐anterior, top‐superior; coronal: left‐left, top‐superior. (A 50‐msec interval version of this figure can be accessed online at http://www.pitt.edu/~liuying/loreta_hbm_01.jpg and http://www.pitt.edu/~liuying/loreta_hbm_02.jpg.)
Table I is a summary of those highly activated areas across time windows from 100 to 500 msec, according to language and word frequency. Across the entire 400‐msec time window, Chinese produced the highest level of activation in bilateral occipital areas (BA 17 and 18), left SMA (BA 6), superior parietal (BA 40), and right prefrontal (BA 10) areas. English produced the highest level of activation in bilateral occipital (BA 17 and 18), medial inferior frontal (BA 11), left anterior middle temporal (BA 21), and medial superior frontal (BA 8) areas. Thus, the general pattern was that bilateral occipital areas (BA 17 and 18) were highly activated by both English and Chinese, while Chinese showed more activation in SMA (BA 6), superior temporal (BA 40), and right pre‐frontal cortex (BA 10); English showed more activation in medial inferior and superior frontal (BA 8; BA 11) and left anterior middle temporal (BA 21) regions.
Table I.
Brodmann areas activated for four conditions across 100–500‐msec time window with 50‐msec interval (x, y, z coordinates were also given)
| msec | Chinese high | Chinese low | English high | English low |
|---|---|---|---|---|
| 100 | Right BA 10 | Left BA 17 | Medial BA 11 | Left BA 21 |
| 18 66 15 | −10 −102 −13 | −3 45 −20 | −45 10 −34 | |
| 150 | Left BA 17 | Left BA 17 | Left BA 17 | Left BA 21 |
| −10 −102 −13 | −10 −102 −13 | −10 −102 −13 | −45 10 −34 | |
| 200 | Right BA 18 | Right BA 18 | Medial BA 11 | Left BA 17, 18 |
| 32 −88 −13 | 32 −88 −13 | −3 45 −20 | −10 −102 −13 | |
| right BA 18 | ||||
| 32 −95 −13 | ||||
| 250 | Left BA 6 | Left BA 17 | Left BA 17 | Left BA 17, 18 |
| −3 −11 71 | −10 −102, −13 | −10 −102 −13 | −10, 102 −13 | |
| right BA 18 | ||||
| 32 −95 −13 | ||||
| 300 | Right BA 10 | Right BA 10 | Left BA 17 | Left BA 17 |
| 18 66 15 | 18 66 15 | −10 −95 −13 | −17 −102 −13 | |
| 350 | Right BA 10 | Right BA 10 | Medial BA 11 | Right BA 18 |
| 18 66 15 | 18 66 15 | −3 45 −20 | 32 −95 −13 | |
| Left BA 17, 18 | ||||
| −17 −102 −13 | ||||
| 400 | Left BA 40 | Right BA 10 | Medial BA 11 | Medial BA 8 |
| −45 −39 50 | 18 66 15 | −3 45 −20 | −3 45 43 | |
| 450 | Left BA 17 | Left BA 17 | Left BA 17 | Right BA 18 |
| −10 −102 −13 | −10 −95 −13 | −10 −95 −13 | 32 −95 −13 | |
| 500 | Left BA 17 | Right BA 10 | Left BA 17 | Left BA 17, 18 |
| −10 −95 −13 | 18 66 15 | −10 −102 −13 | −10 −95 −13 |
To focus on the changes over time, we consider first Chinese:
100–200 msec. Chinese characters produce bilateral occipital activation, with a shift by 200 msec from the left to right visual areas. High‐frequency characters show early right prefrontal activation, but low‐frequency characters show only occipital areas throughout this time period. High‐frequency words show diminished visual area activation by 200 msec, while low‐frequency characters continue to show visual activation to 250 msec.
250–350 msec. Visual area activation gives way to activation in the anterior portions of the reading network. For Chinese, regardless of frequency, activation shifts by 300 msec to right prefrontal. However, prior to this, a frequency effect is seen at 250 msec, at which point high‐frequency characters show SMA activation, while low‐frequency characters continue to show visual area activation until 300 msec.
400–500 msec. By 400 msec, high‐frequency Chinese shows a shift to left superior parietal activation, while low‐frequency Chinese continues to show right prefrontal activation. This right prefrontal area (BA 10) shows only for Chinese and is activated longer for low than high frequency. (Note the 300–400 msec continuous activation of BA 10 for low‐frequency Chinese.) Activation shifts back to the left occipital area at 450 msec. At 500 msec, low‐frequency characters, but not high‐frequency, shift forward again to the right prefrontal area.
For English, the pattern across these time windows is as follows:
100–200 msec. Left occipital areas are activated first for high‐frequency words at 150 msec, followed by low‐frequency words at 200 msec in bilateral visual areas. High‐frequency words show a shift to medial superior frontal at 200 msec.
250–350 msec. Visual areas continue to show activation at 250 and 300 msec with some frequency differences: high‐frequency words again show only left occipital areas, whereas low‐frequency words continue to show bilateral activations through 350 msec. By 350 msec, high‐frequency words show medial inferior frontal activation again.
400–500 msec. At 400 msec, activation in anterior parts of the reading network are dominant, but with frequency differences. High‐frequency words continue to show activation in medial inferior frontal, while low‐frequency words show activation in medial superior frontal areas. A shift occurs at 450 msec and is maintained through 500 msec, with occipital areas again showing activation, left for high frequency and right for low frequency.
To summarize some of the main results: First, there are reasonable temporal orderings for parts of the reading network, with posterior regions that support visual analysis or word form identification activated early (within 200 msec) and more anterior regions generally activated later. The duration of visual area activation depends on familiarity, with low‐frequency words producing 50‐msec longer activation in occipital areas than high frequency for both languages. Furthermore, visual area activation persists longer for the less familiar (English) writing system, especially for low‐frequency words, diminishing only beyond 350 msec (beyond 300 msec for high frequency).
DISCUSSION
The results revealed language and frequency effects that are visible rapidly and unfold over time. The PCA showed differences between Chinese and English within 150 msec of exposure to a word, and the 13‐electrode analysis showed that the peak latencies of the N150 and N250 occurred earlier for Chinese than English words. A longer period of occipital activation was observed for the less familiar language (English) and for low‐frequency compared with high‐frequency Chinese words.
Beyond temporal differences are interesting comparisons of the brain networks that support reading. English fMRI and PET studies have tended to find left‐lateralized occipital areas in word reading [Fiez and Petersen, 1998], and our results were that left occipital areas are also activated by Chinese. However, we also found right occipital activation (BA 18) at 200 msec following left occipital activation (BA 17) at 150 msec. Further, this result was consistent across frequency. Our finding of right occipital activation for Chinese characters may be compared with the fMRI results of Chee et al. [ 2000], who found bilateral occipital activation in Chinese–English bilinguals, and with Tan et al. [ 2000, 2001], who found greater right than left activation in occipital cortex. (The bilateral pattern may reflect stronger English among Singapore bilinguals in Chee et al.'s [ 2000] study compared with Tan et al.'s [ 2000, 2001] sample of Chinese students studying in the United States.) Our data included both patterns, depending on the time window involved, bilateral overall, with left and then right visual areas early in processing.
More generally, this temporal pattern may suggest shifts in visual area functions over time. Other studies have suggested that right occipital functions specialize in global and low spatial frequency information, whereas the left occipital area functions for local and high spatial frequency information processing [Hellige, 1995]. In our study, activation shifted from left to right occipital between 150 and 200 msec. One functional possibility for such a shift is that the linguistic structure, e.g., the recognition of radicals, is carried out in the left occipital cortex, while additional visual analysis, e.g., two‐dimensional spatial relationships of radicals, which serves discrimination among visually similar characters, is carried out in right occipital areas.
Turning to frequency effects, high‐frequency English words, as they do in PET and fMRI studies, produced only left occipital activation; however, for low‐frequency words we found bilateral activations. It may be that bilateral activations reflect the “Chinese mode,” a mode used when Chinese‐dominant readers identify low‐frequency English words as well as Chinese characters. It is interesting that this bilateral mode extended to 350 msec, indicating that something beyond simple visual recognition was involved. An English frequency effect also was observed in the primary ERP analysis, which showed an N250 frequency difference in occipital areas. This is consistent with the source analysis, which showed later and longer activation in visual areas for low‐frequency English words.
For Chinese characters, the source analysis suggests that low‐frequency characters showed an early (100 msec) occipital activation. Somewhat later, at 250 msec, there was more activation for high‐frequency words in a left superior frontal area (BA 6) at a time when low‐frequency words were still activating visual areas. This left supplementary motor area has been found in both English and Chinese experiments to be related to articulatory preparation [Fiez and Petersen, 1998; Tan et al., 2000]. Thus, our Chinese bilinguals were able to prepare the pronunciation of high‐frequency Chinese words as early as 250 msec. Activation then shifted for both high‐ and low‐frequency Chinese characters to the right prefrontal area (BA 10), an area identified in imaging studies of both English and Chinese [Fiez et al., 1999; Tan et al., 2001]. This result adds to the conclusion that Chinese may produce more right hemisphere processing than English [Tan et al., 2001].
One final result of interest, because of its relation to behavioral strategies in word tasks, is the re‐activation of visual areas from 450 msec, observed for both Chinese and English and for both high‐ and low‐frequency words. We suggest this re‐activation reflects a visual verification of the graphic form following the identification of the word and the preparation of a pronunciation.
CONCLUSION
We draw attention to both a methodological conclusion and substantive conclusions about the study of reading. First, ERP recordings not only provide information about the time course of word processing, but, when supplemented by coarse‐grain spatial information, they can also connect when processes occur to where they occur, providing a bridge to finer‐grain fMRI and PET imaging data. On the substantive questions of the time course of word reading, the results suggest that Chinese and English reading involve shared processes. Early encoding of graphic form occurs in any writing system, carried out in visual areas, and gives way to phonological and meaning coding, carried out in anterior portions of a reading network. Clear in this study is evidence for frequency‐modulated processes, with the timing of both posterior graphic analysis and anterior meaning and phonological analyses dependent on word frequency. In addition to these generalizations across writing systems, we see differences in the timing of processes for reading Chinese and English, and in some of the brain areas that are activated. For Chinese–English bilinguals, Chinese more quickly initiates processing of graphic form and more quickly shifts to processing of pronunciation and meaning than does English.
REFERENCES
- Bentin S, Mouchetant Rostaing Y, Giard MH, Echallier JF, Pernier J (1999): ERP manifestations of processing printed words at different psycholinguistic levels: Time course and scalp distribution. J Cogn Neurosci 11: 235–260. [DOI] [PubMed] [Google Scholar]
- Chapman RM, McCrary JW (1995): EP component identification and measurement by principal components analysis. Brain Cogn 27: 288–310. [DOI] [PubMed] [Google Scholar]
- Chee MW, Tan EWL, Thiel T (1999): Mandarin and English single word processing studied with functional magnetic resonance imaging. J Neurosci 19: 3050–3056. [DOI] [PMC free article] [PubMed] [Google Scholar]
- Chee MW, Weekes B, Lee KM, Soon CS, Schreiber A, Hoon JJ, Chee M (2000): Overlap and dissociation of semantic processing of chinese characters, english words, and pictures: evidence from fMRI. Neuroimage 12: 392–403. [DOI] [PubMed] [Google Scholar]
- Chua FK (1999): Phonological recoding in Chinese logograph recognition. J Exp Psychol Learn Mem Cogn 25: 876–891. [Google Scholar]
- Ferree TC, Luu P, Russell GS, Tucker DM (2001): Scalp Electrode Impedance, Infection Risk, and EEG Data Quality. J Clin Neurophysiol 112: 536–544. [DOI] [PubMed] [Google Scholar]
- Fiez JA, Petersen SE (1998): Neuroimaing studies of word reading. Proc Natl Acad Sci U S A 95: 914–921. [DOI] [PMC free article] [PubMed] [Google Scholar]
- Fiez JA, Balota DA, Raichle ME, Petersen SE (1999): Effects of lexicality, frequency, and spelling‐to‐sound consistency on the functional anatomy of reading. Neuron 24: 205–218. [DOI] [PubMed] [Google Scholar]
- Greenhouse SW, Geisser S (1959): On methods in the analysis of profile data. Psychometrika 24: 95–112. [Google Scholar]
- Hellige JB (1995): Hemispheric asymmetry for components of visual information processing In: Davidson RJ, Hugdahl K, editors. Brain asymmetry. Cambridge, MA: MIT Press; p 99–121. [Google Scholar]
- Koles ZJ (1998): Trends in EEG source localization. Electroencephalogr Clin Neurophysiol 106: 127–137. [DOI] [PubMed] [Google Scholar]
- Kramer AF, Donchin E (1987): Brain potentials as indices of orthographic and phonological interaction during word matching. J Exp Psychol Learn Mem Cogn 13: 76–86. [DOI] [PubMed] [Google Scholar]
- Kucera, Francis WN (1967): Computational analysis of present‐day American English: Providence: Brown University Press. [Google Scholar]
- Kutas M, Hillyard SA (1980): Reading senseless sentences: brain potentials reflect semantic incongruity. Science 207: 203–205. [DOI] [PubMed] [Google Scholar]
- Li G, Liu R, editors (1988): A dictionary of Chinese character information. Beijing: Science Press. [Google Scholar]
- Pascual Marqui RD, Michel CM, Lehmann D (1994): Low resolution electromagnetic tomography: a new method for localizing electrical activity in the brain. International J Psychophysiol 18: 49–65. [DOI] [PubMed] [Google Scholar]
- Perfetti CA, Liu Y, Tan LH (2002): How the mind meets the brain in reading: a comparative writing systems approach In: Kao HSR, Leong CK, Gao DG, editors. Cognitive neuroscience studies of the Chinese language. Hong Kong: Hong Kong University Press. [Google Scholar]
- Perfetti CA, Tan LH (1998): The time course of graphic, phonological, and semantic activation in Chinese character identification. J Exp Psychol Learn Mem Cogn 24: 101–118. [DOI] [PubMed] [Google Scholar]
- Perfetti CA, Zhang S (1995): Very early phonological activation in Chinese reading. J Exp Psychol Learn Mem Cogn 21: 24–33. [Google Scholar]
- Picton TW, Bentin S, Berg P, Donchin E, Hillyard SA, Johnson R Jr Miller GA, Ritter W, Ruchkin DS, Rugg MD, et al (2000): Guidelines for using human event‐related potentials to study cognition: recording standards and publication criteria. Psychophysiology 37: 127–152. [PubMed] [Google Scholar]
- Rugg MD (1984): Event‐related potentials in phonological matching tasks. Brain Lang 23: 225–240. [DOI] [PubMed] [Google Scholar]
- Talairach J, Tournoux P (1988): Co‐planar sereotaxc atlas of the human brain. Rayport M, translator. New York: Thieme Medical Publishers. [Google Scholar]
- Tan LH, Spinks JA, Gao JH, Liu HL, Perfetti CA, Xiong J, Stofer KA, Pu Y, Liu Y, Fox PT (2000): Brain activation in the processing of Chinese characters and words: a functional MRI study. Hum Brain Mapp 10: 16–27. [DOI] [PMC free article] [PubMed] [Google Scholar]
- Tan LH, Liu H‐L, Perfetti CA, Spinks JA, Fox PT, Gao J‐H (2001): The neural system underlying Chinese logograph reading. Neuroimage 13: 836–846. [DOI] [PubMed] [Google Scholar]
- van Boxtel GJM (1998): Computational and statistical methods for analyzing event‐related potential data. Behav Res Methods Instrum Comput 30: 87–102. [Google Scholar]
- Vitacco D, Brandeis D, Pascual Marqui RD, Martin E (2002): Correspondence of event‐related potential tomography and functional magnetic resonance imaging during language processing. Hum Brain Mapp 17: 4–12. [DOI] [PMC free article] [PubMed] [Google Scholar]
- Wastell DG (1981): On the correlated nature of evoked brain activity: Biophysical and statistical considerations. Biol Psychol 13: 51–69. [DOI] [PubMed] [Google Scholar]
- Xu Y, Pollatsek A, Potter MC (1999): The activation of phonology during silent Chinese word reading. J Exp Psych Learn Mem Cogn 25: 838–857. [DOI] [PubMed] [Google Scholar]
- Zhang S, Perfetti CA, Yang H (1999): Whole word, frequency‐general phonology in semantic processing of Chinese characters. J Exp Psychol Learn Mem Cogn 25: 858–875. [Google Scholar]