

Abstract
This work tests the hypothesis that a network of areas involving bilateral premotor cortex and right parietal cortex subserves the analysis of sound movement. The components of this network have been examined at the level of individual subjects in a study where 720 fMRI scans were acquired per subject. Additionally, the effect of movement direction was investigated by varying this property systematically. Linear sound ramps that are perceived as movement toward one side of the head or the other were used in an experiment in which the principal contrast was between movement, and a stationary control stimulus made up of identical component interaural phase and amplitude cues. In a group analysis, the network of bifrontal and right parietal areas suggested by previous work was confirmed. The frontal activation included both dorsal premotor activity in the region of the frontal eye fields and discrete ventral premotor activation in an area corresponding to primate areas for multimodal spatial analysis and motor planning. The right parietal activation included both superior and inferior parietal cortex. Analysis of the individual data showed a similar pattern of activation in each subject, with the greatest variability within the right parietal area. The pattern of activation did not vary when the direction of movement was varied, suggesting that both directions of movement are represented in the network we have demonstrated. Hum. Brain Mapping 9:72–80, 2000. © 2000 Wiley‐Liss, Inc.
Keywords: human, sound, movement
INTRODUCTION
Previous functional imaging work using positron emission tomography (PET) and functional magnetic resonance imaging (fMRI) has demonstrated a network of areas that are active during the perception of sound movement [Griffiths et al., 1998]. The network includes bilateral premotor areas and the right parietal cortex. The previous work used a stimulus containing amplitude and phase ramps that could be combined in different ways to produce either a strong perception of movement from the midline toward one side, or a stationary midline stimulus. Comparison between these two stimuli allowed areas to be defined that are active during the perception of auditory movement, rather than the simple detection of the component binaural cues. The previous work used stimuli in which there were movements toward one side or the other, in equal proportions, and did not address the effect of movement direction.
The first aim of the present fMRI study was to confirm that the network demonstrated in the previous experiment subserves sound movement analysis, in a further experiment generating a much larger dataset, and to relate individual patterns of activation to the anatomy of individual subjects. The anatomical analysis was facilitated by the use of a larger number of scans per subject than in the previous study. The second aim of this study was to investigate the effect of movement direction on the pattern of activity observed. In the previous study, a 50:50 mixture of ramp movement to the right and left, in random order, was used in the movement activation condition. Studies of movement‐selective neurons in the primary auditory cortex suggest that more units are preferentially activated by sound moving from the ipsilateral to the contralateral hemifield [Ahissar et al., 1992]. No similar data are available on sound directional preferences in areas outside the primary auditory cortex.
Any study in which the predominant direction of movement is varied is potentially confounded by covariation of the spatial attentional set of the subject. Consider the case where a subject listens to sounds moving in entirely one direction during an fMRI epoch; this may produce a shift of spatial attention toward one side in addition to fixing the direction of perceived movement. Therefore, in this epoch‐mode study, we have varied the predominant direction of motion by varying the proportion of ramps moving to either side in order to look for asymmetries in the response to different perceived directions. The use of a mixture of ramps is designed to control for shifts of spatial attention over the epoch as a whole. We have avoided extreme mixtures of ramp direction (e.g., 95% in one direction and 5% in the other), which might produce a response to the novelty of the infrequent stimulus.
METHODS
Subjects
Four right‐handed male subjects, ages 30–45, took part in the study. All gave informed consent to take part in the study, which was approved by the local ethical committee. All subjects were neurologically normal.
Stimuli
In both movement and control conditions, subjects listened to sounds containing linear changes in interaural phase and intensity [Griffiths et al., 1998]. The stimuli were presented by an acoustically isolated system of speakers and tubes where the acoustic isolation achieved an improvement in signal‐to‐noise ratio under scanning conditions of ∼︁50dB. The carrier frequency was 500Hz, the sound duration 1s, and the sounds were delivered at 50dB sensation level, set when the scanner was running. Considered alone, both the phase and intensity ramps produce a perception of movement of the sound from the midline toward one side. In the control condition, the perception due to each of these individual cues is in opposite directions, but when heard together, the percept is of a stationary sound. Each subject underwent detailed psychophysics before scanning [Griffiths et al., 1998] to define the necessary phase and amplitude ramp parameters to produce exact cancellation in the control condition. The amplitude excursion (the proportion by which the amplitude was increased in one ear and decreased in the other in 1 sec) was 0.1 for all subjects. The phase excursion in radians (the advance in phase at one ear and retardation at the other in one second) was 0.11, 0.17, 0.22, and 0.14 for subjects 1–4, respectively. In the movement conditions, the phase and amplitude ramp excursions were the same as in the control condition, but signalled the same direction of perceptual movement. The percept due to the two components added in this case to produce a strong resultant perception of movement from the midline toward either side. Thus the control and movement conditions represent sounds containing the same component interaural amplitude and phase changes, but producing very different perceptions.
During the 42 s fMRI epochs when sound was presented, subjects heard one of four sound conditions. During all sound epochs, subjects heard 33 stimuli lasting 1 sec each. In the control epochs, subjects heard stimuli producing no perception of movement. During the movement epochs, subjects heard moving stimuli, all of which moved from the midline toward one side. In the balanced condition, subjects heard a 50:50 mixture of sound moving to the right or the left in a random order. In the left condition, subjects heard a 80:20 mixture of sounds moving to the left and right, respectively, and in the right condition, subjects heard a 20:80 mixture of sounds moving to the left and right, respectively.
Scanning/paradigm
BOLD contrast image volumes were acquired at 2.0 T (Siemens, VISION, Erlangen, UK) with gradient echo planar imaging (TR/TE = 4200 ms/40 ms). Each volume comprised 48 contiguous 4 mm slices, with an in plane resolution of 3 × 3 mm. Each subject underwent three consecutive scanning sessions during which 732 volumes were acquired. The first six volumes of each session were excluded from the analysis to avoid T1 saturation effects. During epochs of 10 volumes (∼︁42 sec), subjects were presented with one of the four sound conditions above (control, balanced movement, left movement, right movement) alternating with rest epochs. The sound conditions were presented in a fixed order.
Apart from detailed psychophysics before the scanning session to establish the trade parameters, the ability of each subject to perceive the direction of sound movement was also established, during the scanning session with the scanner running, by forced‐choice interrogation about stimulus direction. During the scans when data were acquired, the subjects carried out no output task, but were required to concentrate on any changes in the sound that were perceived. Subjects were required to fixate a visual crosspiece during the scan to control for eye movements. Electro‐oculogram recording, carried out during a separate session of stimulus presentation outside the scanner, demonstrated no eye movements. Horizontal recordings revealed potential deflections <1/1,000 of those due to maximal lateral deviation of the eyes.
Analysis
For each subject separately, the T2* image was realigned to the first image, stereotactically normalised, and smoothed with an isotropic Gaussian kernel of 8 mm FWHM [Friston et al., 1995a,b]. The entire imaging time series for each subject was used for a group analysis, representing 2,880 image volumes in total. Condition‐specific effects were estimated using the general linear model and theory of Gaussian fields as implemented in SPM 97 [Friston et al., 1996a,b]. A high pass filter with a cutoff period of 320 sec modelled and excluded low‐frequency confounding effects in the time series. A fixed‐response boxcar model was used to characterise condition effects, using general linear contrasts to test hypotheses about regionally specific condition effects, The SPM{Z} for the comparisons between the sound conditions with rest and with each other was thresholded at a Z value of 3.09 (P = 0.001 uncorrected for multiple comparisons).
In addition to the group analysis, the same contrasts between conditions were looked at for each subject and compared with individual anatomy in the form of the normalised T1 weighted structural image for each subject.
RESULTS
Perceptual report
As in the previous study [Griffiths et al., 1998], subjects were able to indicate reliably the direction of sound movement on every trial for the sound‐movement stimuli, under scanning conditions. Subjects performed at chance level for the identification of sound‐movement direction in the control condition and perceived a stationary midline sound image.
Comparison between movement and control condition in group analysis
The contrast between all the movement epochs and the control sound epochs showed significant activation in three clusters in the right premotor cortex, left premotor cortex, and the right parietal cortex (Table I, Figs. 1 and 2). The Talaraich coordinates of previously determined maxima in the fMRI experiment were taken as a prior anatomical hypothesis for the network for the analysis of sound movement. These coordinates are right‐left, anterior‐posterior, and superior‐inferior distances in millimetres from the anterior commisure. The prespecified coordinates were right premotor area 58 8 46, left premotor area −36 0 58, and right parietal area 32 −42 50. Based on these predefined coordinates, the two frontal areas were activated at a significance level of P < 0.001 and the right parietal area at a level of P < 0.05 (spatial extent method of Friston [1997], Z threshold 2.5).
Table I.
Group analysis: all movement scans minus control‐sound scans
| Region | Area | Coordinates (mm) | z score | ||
|---|---|---|---|---|---|
| x | y | z | |||
| R premotor (dorsal) | BA6 | 57 | 6 | 36 | 7.22 |
| BA6 | 48 | 3 | 48 | 6.55 | |
| R premotor (ventral) | BA6 | 51 | 9 | 6 | 5.79 |
| BA6 | 60 | 9 | 3 | 5.62 | |
| L premotor (dorsal) | BA6 | −36 | 6 | 54 | 6.71 |
| BA6 | −24 | −3 | 48 | 5.48 | |
| BA6 | −45 | 3 | 51 | 5.38 | |
| L premotor (ventral) | BA6 | −42 | 9 | 3 | 4.16 |
| R parietal | BA40/2 | 57 | −21 | 48 | 4.51 |
| BA5 | 33 | −39 | 66 | 4.15 | |
| BA40 | 42 | −30 | 42 | 3.99 | |
| L parietal | BA40 | −48 | −27 | 42 | 4.04 |
| ant. cingulate | BA24 | 0 | 12 | 45 | 6.59 |
| post cingulate | BA5 | 0 | −36 | 51 | 4.24 |
| BA7 | 3 | −54 | 60 | 4.24 | |
| BA5 | −15 | −48 | 69 | 4.17 | |
| L cerebellum | −42 | −54 | −33 | 4.46 | |
| L post. temporal | BA22 | −60 | −54 | 12 | 4.31 |
| BA37 | −57 | −63 | 3 | 3.63 | |
| BA37 | −51 | −69 | 6 | 3.63 | |
| Inferomed. front./temp. | BA28/38 | −24 | 12 | −27 | 3.76 |
| BA38 | −24 | 21 | −21 | 3.35 | |
Figure 1.
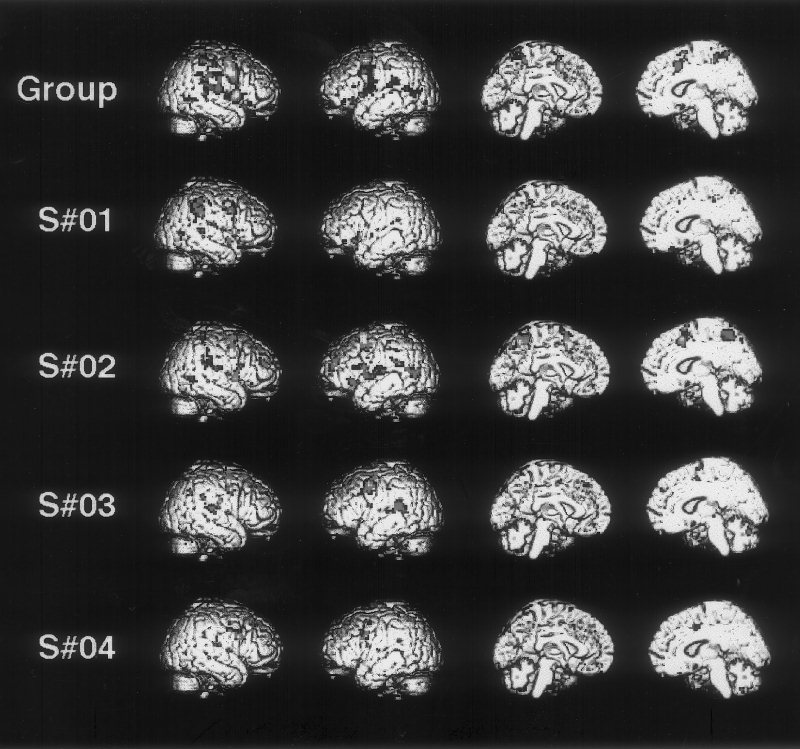
Areas demonstrated by movement minus rest contrast rendered onto T1 brain template. Group analysis based on four subjects, and single‐subject analyses are shown.
Figure 2.
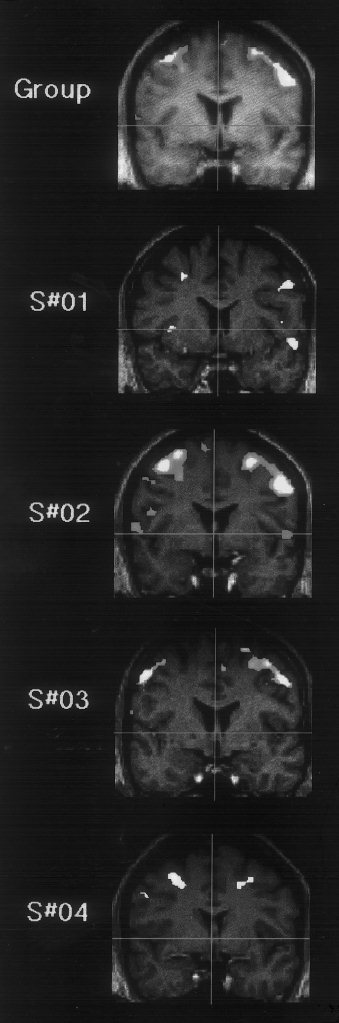
Premotor areas demonstrated by movement minus rest contrast shown as coronal sections through the premotor areas of maximal activation. Group analysis shown based on four subjects shown rendered onto average T1 image for the four subjects. Individual‐subject analyses also shown rendered onto each subject's own T1 image.
The cluster of activation in the right premotor area overlapped the 95% confidence limits for the right frontal eye fields. The cluster of activation in the left premotor area was situated outside the 95% confidence limits for the left frontal eye fields [Paus, 1996], in a slightly superior position. Additionally, a second distinct cluster of activation was demonstrated bilaterally in the premotor cortex, more ventrally. The activation in the right parietal cortex included both the superior parietal cortex (BA5) and the inferior parietal lobule (BA40).
Other areas of significant activation, which were not specified a priori, are shown in Table I and Figure 1. Less spatially extensive activation was also shown in the left posterior parietal area, with only a single peak of activation compared to the three on the right. Other areas of activation demonstrated were in the anterior and posterior cingulate cortices, left cerebellum, left posterior temporal cortex, and left inferior frontal cortex.
Examination of the SPM{Z} at a cluster level, taking spatial extent into account independently of any prior hypothesis, showed the right premotor cluster to be significantly activated at a level of P < 0.001, the left premotor cluster at a level of P < 0.005, and the posterior cingulate area at a level of P < 0.05. No other clusters of activation were significant at the P < 0.05 level, although the right posterior parietal cluster of activation was just outside this significance level (P = 0.052).
Comparison between movement and control condition in individual subjects
Table II shows the individual data for the contrast between the total movement epochs and the control sound epochs. The nearest peak of activation to our three anatomically prespecified coordinates is listed. The right peak premotor activations were all situated within ∼︁12 mm of the prespecified coordinate. The left peak premotor activations were are all within 12 mm of the prespecified coordinate, except for the peak for subject 1, which was separated by 19 mm. The variation in position of the right parietal activation was more marked, with the nearest peak activations to the prespecified coordinate separated by between 14 and 38 mm.
Table II.
Individual data considered by area: all movement scans minus control‐sound scans*
| Area | Coordinates (mm) | Distance (mm) | z score | ||
|---|---|---|---|---|---|
| x | y | z | |||
| Subject 1 | |||||
| R premotor | 57 | 9 | 36 | 10 | 3.97 |
| L premotor | −27 | 6 | 42 | 19 | 4.09 |
| R parietal | 63 | −45 | 42 | 32 | 5.08 |
| Subject 2 | |||||
| R premotor | 51 | 3 | 39 | 11 | 5.74 |
| L premotor | −36 | 6 | 54 | 7 | 7.37 |
| R parietal | 36 | −39 | 63 | 14 | 3.75 |
| Subject 3 | |||||
| R premotor | 54 | 0 | 42 | 10 | 4.81 |
| L premotor | −42 | −3 | 57 | 7 | 5.67 |
| R parietal | 54 | −39 | 30 | 30 | 3.98 |
| Subject 4 | |||||
| R premotor | 51 | 3 | 48 | 9 | 3.78 |
| L premotor | −30 | 3 | 48 | 12 | 4.00 |
| R parietal | 48 | −21 | 21 | 38 | 3.69 |
In each subject, the nearest peak of activation to the three specified prior coordinates and its significance is reported. The specified coordinates, based on a previous experiment [Griffiths et al., 1998], are right frontal area 58 8 46, left frontal area −36 0 58, right parietal area 32 −42 50. Distance refers to the distance from the prespecified coordinate.
Inspection of the individual data rendered onto a brain surface (Fig. 1) shows the variation in the position of activation, particularly in the right posterior parietal area. With respect to the right parietal activation in individual subjects shown in Figure 1, subject 1 activated the central region of BA40, subject 2 activated both superior (BA5) and inferior (BA40) parietal cortices, subject 3 activated the inferior parietal cortex, and subject 4 activated an area within the upper part of the Sylvian fissure not visible on the external rendered section.
Inspection of the premotor data for each subject rendered onto the corresponding structural MRI section (Fig. 2) shows that all subjects activated the premotor cortex in the posterior part of the middle frontal gyrus. Additionally, distinct bilateral activation in ventral premotor cortex, in the posterior part of the inferior frontal gyrus, is also shown by subjects 1, 2 and 3.
Effect of movement direction
Table III and Figure 3 show areas of significant activation for left movement and right movement conditions considered separately as contrasts with the control sound condition. The results for the two different movement directions, considered separately in this way, are strikingly similar. For both directions of movement, activation is demonstrated in the right premotor cortex, left premotor cortex, and right parietal cortex, with less extensive activation in the left parietal cortex. The cluster level significance for all of the premotor activations was P < 0.005 for the right superior premotor activation and P < 0.01 for the left. The cluster level significance for the right parietal activation was P < 0.10 in both cases. Other areas of activation were shown in the anterior and posterior cingulate areas as in the group analysis for all directions.
Table III.
Group analysis: right movement minus control sound and left movement minus control sound considered separately
| Area | Right movement minus control sound | Left movement minus control sound | ||||||
|---|---|---|---|---|---|---|---|---|
| Coordinates (mm) | z score | Coordinates (mm) | z score | |||||
| R premotor | 57 | 6 | 36 | 6.84 | 57 | 3 | 36 | 6.72 |
| 54 | 0 | 42 | 6.29 | |||||
| 45 | 0 | 51 | 6.07 | 30 | 0 | 51 | 4.42 | |
| 51 | 9 | 6 | 5.44 | 51 | 9 | 6 | 5.67 | |
| 60 | 6 | 0 | 4.87 | |||||
| 42 | 9 | 15 | 3.19 | |||||
| L premotor | −36 | 6 | 54 | 5.91 | −36 | 6 | 54 | 5.98 |
| −24 | −6 | 45 | 5.13 | −24 | −6 | 48 | 4.94 | |
| −45 | 3 | 51 | 5.10 | −27 | 6 | 45 | 4.54 | |
| −63 | −6 | 12 | 4.23 | −63 | −3 | 24 | 3.26 | |
| R parietal | 30 | −39 | 66 | 4.30 | 33 | −39 | 66 | 3.89 |
| 45 | −27 | 42 | 4.27 | 42 | −30 | 42 | 3.87 | |
| 57 | −21 | 48 | 3.95 | 57 | −21 | 48 | 3.89 | |
| L parietal | −54 | −24 | 42 | 4.07 | −48 | −27 | 42 | 3.76 |
| ant. cingulate | 0 | 12 | 45 | 5.79 | 0 | 12 | 45 | 5.99 |
| 6 | 15 | 33 | 3.46 | −9 | 21 | 30 | 3.69 | |
| 6 | 6 | 63 | 3.60 | |||||
| post cingulate | 0 | −36 | 51 | 4.05 | 0 | −36 | 51 | 4.67 |
| 3 | −54 | 60 | 3.95 | 9 | −57 | 63 | 4.31 | |
| 3 | −42 | 60 | 3.94 | 18 | −63 | 63 | 3.79 | |
| Inferomed. front./temp. | −24 | 15 | −24 | 4.00 | −24 | 12 | −27 | 4.17 |
| 3 | 12 | −12 | 3.70 | −24 | 21 | −21 | 3.85 | |
| −6 | 12 | −12 | 3.38 | −15 | 12 | −15 | 3.81 | |
| 21 | 27 | −21 | 3.81 | |||||
Figure 3.
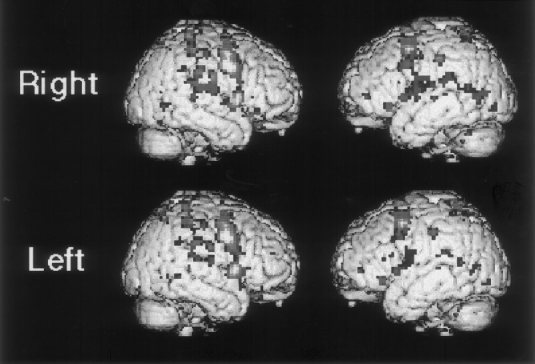
Areas demonstrated by movement minus rest for two different directions considered separately (group analysis). Legend shows predominant direction of movement in this epoch‐mode analysis.
The comparison between the balanced sound condition and the control condition demonstrated a similar network of activation to the analyses for left and right movement. A particular focus of this analysis was to consider whether anterior cingulate activation was decreased for the balanced analysis compared with the right and left analyses, where the imbalance of conditions might, to some extent, produce an oddball response. This was not the case, and anterior cingulate activation occurred in the balanced movement condition at a similar location and significance level to the directional analyses (0 12 45, z = 6.06).
Examination of individual subject data did not show any deviation from this pattern, with the same pattern of activation being shown for both directions of movement in the individual subjects. A further group analysis was carried out with the two directions of movement as contrasts against each other. No significant differences were demonstrated in any part of the fronto‐parietal network shown in the contrasts between sound conditions and rest.
DISCUSSION
This study is a direct test of the hypothesis that sound movement analysis is subserved by a network involving the premotor cortex bilaterally and the right parietal cortex. The study has replicated and qualified the previous findings. A bifrontal and predominantly right parietal network of activated areas has again been demonstrated, both at a group level of analysis and within individual subjects. The primary auditory cortex has again been shown not to be differentially activated by the moving and stationary sound conditions. Individual analyses have shown consistent activation of the premotor areas in the region of the frontal eye fields, with additional activation in the ventral premotor cortex in most subjects. The right parietal activation shows more variation from subject to subject. Analysis of the activation due to movement in one direction or the other shows a strikingly similar pattern, with no alteration of the lateralisation of activation seen with the predominant direction of movement.
Convergent evidence for a network for sound‐movement analysis
We have demonstrated a network of activation during sound movement analysis in multimodal cortex in the right parietal and bilateral premotor areas. Extensive interconnection between these areas [Cavada and Goldman‐Rakic, 1989; Petrides and Pandya, 1984], demonstrated by animal neuroanatomy, provide an anatomical basis for such a network. The component areas of this network might a priori subserve perception of the stimulus, preparation of saccadic eye movements or limb movements in response to the stimulus, or attention to the stimulus; we consider these aspects in turn.
A role for the posterior parietal cortex in the perception of space in several modalities is strongly suggested by a number of animal and human studies [Andersen, 1995; Husain, 1991; Mountcastle, 1995], whereas human lesion work shows deficits in the perception of interaural cues for auditory spatial analysis due to right parietal cortex lesions [Bisiach et al., 1984; Griffiths et al., 1996]. We do not dismiss the possibility that the premotor areas may also have a perceptual role.
Motor planning in the posterior parietal cortex, including saccade and limb‐movement preparation, is suggested by a number of studies [Andersen, 1995; Husain, 1991; Mountcastle, 1995]. The superior activation in the right premotor cortex overlapped with the frontal eye fields and the superior activation in the left premotor cortex was close to, but superior to, the right frontal eye fields [Paus, 1996]. The group analyses and three of the four individual analyses also show bilateral activation in the ventral premotor cortex, distinct from the dorsal activation discussed above.
Neurophysiological studies of cells in this area [Fogassi et al., 1996; Graziano et al., 1997a,b] reveal responses to visual, auditory, and tactile stimulation, with many cells having spatially tuned receptive fields that are fixed in body‐centred coordinates. The auditory spatial receptive fields have not been characterised in terms of responses to movement cues (Graziano, personal communication). This area may be involved in the coding of sensory space in a coordinate system suitable for the execution of movement.
Motor planning is, therefore, also a possible explanation for activation in both the posterior and anterior parts of the network we describe, despite the control of actual eye or limb movements in this experiment. Interaction between perceptual and motor processes is a third possible factor. This process involves auditory spatial attention; indeed, such attentional processes may be causally dependent on motor preparation [Sheliga et al., 1994]. Similar parietal and premotor cortex activation has been demonstrated in several functional imaging studies of visuospatial attention [Corbetta et al., 1993; Coull and Nobre, 1998; Nobre et al., 1997, 1998].
Other areas of activation
The group analyses and individual analyses have all demonstrated activation of the anterior and posterior cingulate cortices. The anterior cingulate cortex activation may reflect increased attentional load in the movement condition, an explanation that would be compatible with activation in this area in a range of different studies [e.g., Vogt et al., 1992]. Posterior cingulate cortex has been implicated in studies of spatial orientation and eye movement control [Olson et al., 1993; Vogt et al., 1992].
Effect of movement direction
The analysis seeking an effect of direction is striking for the absence of any effect and the consistency of activation in the fronto‐parietal network that we have observed. This is consistent with the analysis of both directions of movement within the network we describe. It is possible that subtle differences between the hemispheres may have been obscured by the need to use a mixture of stimulus directions in this epoch mode study. Further work using single trial analysis will clarify this point.
Acknowledgements
This work is entirely funded by the Wellcome Trust (UK). We thank R.S.J. Frackowiak for helpful comments on this work.
REFERENCES
- Ahissar M, Ahissar E, Bergman H, Vaadia E. 1992. Encoding of sound source location and movement: activity of single neurons and interactions between adjacent neurons in the monkey auditory cortex. J Neurophysiol 67:203–215. [DOI] [PubMed] [Google Scholar]
- Andersen RA. 1995. Encoding of intention and spatial location in the posterior parietal cortex. Cereb Cortex 5: 457–469. [DOI] [PubMed] [Google Scholar]
- Bisiach E, Cornacchia L, Sterzi R, Vallar G. 1984. Disorders of perceived auditory lateralisation after lesions of the right hemisphere. Brain 107: 37–52. [DOI] [PubMed] [Google Scholar]
- Cavada C, Goldman‐Rakic PS. 1989. Posterior parietal cortex in rhesus monkeys: II Evidence for segregated corticocortical networks linking sensory and limbic areas with the frontal lobe. J Comp Neurol 28: 422–445. [DOI] [PubMed] [Google Scholar]
- Corbetta M, Miezin FM, Shulman GL, Petersen SE. 1993. A PET study of visiospatial attention. J Neurosci 13: 1202–1226. [DOI] [PMC free article] [PubMed] [Google Scholar]
- Coull JT, Nobre AC. 1998. Where and when to pay attention: the neural systems for directing attention to spatial locations and to time intervals as revealed by both PET and fMRI. J Neurosci 18: 7426–7435. [DOI] [PMC free article] [PubMed] [Google Scholar]
- Fogassi L, Gallese V, Fadiga L, Luppino G, Matelli M, Rizzolatti G. 1996. Coding of peripersonal space in inferior premotor cortex (area F4). J Neurophysiol 76: 141–157. [DOI] [PubMed] [Google Scholar]
- Friston KJ. 1997. Testing for anatomically specified regional effects. Hum Brain Mapp 5: 133–136. [DOI] [PubMed] [Google Scholar]
- Friston KJ, Ashburner J, Frith CD, Poline J‐B, Heather JD, Frackowiak RSJ. 1995. Spatial registration and normalisation of images. Hum Brain Mapp 2: 165–169. [Google Scholar]
- Friston KJ, Holmes A, Poline J‐B, Price CJ, Frith CD. 1996. Detecting activations in PET and fMRI: levels of inference and power. Neuroimage 40: 223–235. [DOI] [PubMed] [Google Scholar]
- Friston KJ, Holmes AP, Worsley KJ, Poline J‐B, Frith CD, Frackowiak RSJ. 1995b. Statistical parametric maps in functional imaging: a general linear approach. Hum Brain Mapp 2: 189–210. [Google Scholar]
- Friston KJ, Williams S, Howard R, Frackowiak RSJ, Turner R. 1996. Movement‐related effects in fMRI time series. Mag Res Med 35: 346–355. [DOI] [PubMed] [Google Scholar]
- Graziano MSA, Hu XT, Gross CG. 1997a. Coding the locations of objects in the dark. Science 277: 239–241. [DOI] [PubMed] [Google Scholar]
- Graziano MSA, Hu XT, Gross CG. 1997b. Visuospatial properties of ventral premotor cortex. J Neurophysiol 77: 2268–2292. [DOI] [PubMed] [Google Scholar]
- Griffiths T, Rees G, Rees A, Green G, Witton C, Rowe D, Buechel C, Turner R, Frackowiak RSJ. 1998. Right parietal cortex is involved in the perception of sound movement in humans. Nature Neurosci 1: 74–79. [DOI] [PubMed] [Google Scholar]
- Griffiths TD, Rees A, Witton C, Shakir RA, Henning GB, Green GGR. 1996. Evidence for a sound movement centre in the human cerebral cortex. Nature 383: 425–427. [DOI] [PubMed] [Google Scholar]
- Husain M. 1991. Visiospatial and visiomotor functions of the posterior parietal lobe In: Stein JF, editor. Vision and visual dysfunction. Basingstoke, UK: MacMillan, p 12–43. [Google Scholar]
- Mountcastle VB. 1995. The parietal cortex and some higher brain functions. Cereb Cortex 5: 377–390. [DOI] [PubMed] [Google Scholar]
- Nobre AC, Dias EC, Gitelman DR, Mesulam MM. 1998. The overlap of brain regions that control saccades and covert visual spatial attention revealed by fMRI. Neuroimage 7: S9. [Google Scholar]
- Nobre AC, Sebetyen GN, Gitelman DR, Mesulam MM, Frackowiak RSJ, Frith CD. 1997. Functional localisation of the system for visuospatial attention using positron emission tomography. Brain 120: 515–533. [DOI] [PubMed] [Google Scholar]
- Olson CR, Musil SY, Goldberg ME. 1993. Posterior cingulate cortex and visiospatial cognition: properties of single neurons in the behaving monkey In: Vogt BA. Gabriel M, editors. Neurobiology of cingulate cortex and limbic thalamus: a comprehensive handbook. Boston: Birkhauser, p 366–380. [Google Scholar]
- Paus T. 1996. Location and function of the human frontal eye fields: a selective review. Neuropsychologia 34: 475–483. [DOI] [PubMed] [Google Scholar]
- Petrides M, Pandya DN. 1984. Projections to the frontal lobe from the posterior parietal region in the rhesus monkey. J Comp Neurol 20: 249–262. [DOI] [PubMed] [Google Scholar]
- Sheliga BM, Riggio L, Rizzolatti G. 1994. Orienting of attention and eye movements. Exp Brain Res 98: 507–522. [DOI] [PubMed] [Google Scholar]
- Vogt BA, Finch DM, Olson CR. 1992. Functional heterogeneity in cingulate cortex: the anterior executive and the posterior evaluative regions. Cereb Cortex 2: 435–443. [DOI] [PubMed] [Google Scholar]