

Abstract
Human brain mapping allows the systematic assessment of interindividual differences in functional brain anatomy. Functional transcranial Doppler sonography (fTCD) is an imaging tool that allows for fast and mobile assessment of hemispheric lateralization of task‐related brain activation. It is ideal to screen large cohorts of subjects. The goal of the present study was to investigate whether fTCD and functional magnetic resonance imaging (fMRI) determine hemispheric lateralization of brain activation related to visuospatial attention concordantly. Used together, fMRI and fTCD may then open up a wide range of potential applications in neuroscience. Fifteen subjects were examined both with fTCD and fMRI while they judged accuracy of line bisections (Landmark task). For fTCD, the maximal mean difference in stimulus‐related relative cerebral blood flow velocity changes in the left and right middle cerebral arteries was assessed as the lateralization index LIfTCD. For fMRI, two approaches were used to determine hemispheric dominance. First, we measured brain activity as the extent of the activated region, i.e., the number of activated voxels above a statistical threshold. Second, we calculated the magnitude of the fMRI signal change between the activation and the control task within a region of interest. Results of fTCD and fMRI were concordant in every single case. Therefore, scanning large cohorts with fTCD for hemispheric dominance during Landmark task will provide results consistent with fMRI. FMRI can then be used for in depth assessment of the specific patterns of activation. Hum Brain Mapp 23:168–180, 2004. © 2004 Wiley‐Liss, Inc.
Keywords: fMRI, fTCD, spatial attention, cerebral lateralization, Landmark task
INTRODUCTION
Functional imaging has not only provided elaborate brain activation maps, but has also increased awareness for the variability in the relation between brain function and brain structure. This variability is most striking for lateralized brain functions. Neuroimaging and neuropsychological research indicate that the left hemisphere is specialized for language and the right for control of spatial attention in most individuals [Bookheimer, 2002; Mesulam, 1999; Ojemann, 1991]. However, this is not an invariable principle. There are occasional patients with aphasias after right hemispheric lesions or with neglect after left hemispheric lesions [Dronkers and Knight, 1989]. The same hemisphere can even be dominant in control of both language and spatial attention [Alexander and Annett 1996; Fischer et al., 1991; Osmon et al., 1998; Trojano et al., 1994].
In the past decade, a considerable body of data has been collected on the variability of the language system. It has been established that language can be produced and perceived by predominantly the left hemisphere, predominantly the right one, or by both hemispheres, unrelated to gender or linguistic performance [Frost et al., 1999; Knecht et al., 2000a, 2001; Pujol et al., 1999].
Unlike language, little is known about the lateralization of the neural substrate that underlies shifting of attention. Up to now, it is neither known how the hemispheric dominance for attention varies in the general population, nor how strongly the extent of lateralization varies. By providing information on the differences between individuals in brain activation, functional imaging helps constrain theories about the variable brain–behavior relationship.
One way of obtaining a broader view on the variability of attention related functional brain lateralization is the use of functional transcranial Doppler sonography (fTCD) [for an in‐depth review of the technique, see Deppe et al., 2003]. FTCD compares stimulus‐related blood flow velocity increases within the vascular territories of cerebral arteries and allows for determination of the hemispheric dominance for a cognitive function. FTCD is noninvasive and cost–effective. It is an easily applicable and mobile technique allowing for the determination of lateralization of a cognitive function in large series of subjects. Therefore, fTCD has been successful in determining the distribution of language lateralization in the general population [Knecht et al. 2000a, b]. In a similar vein, fTCD should be capable to contribute to the understanding of spatial attention.
However, the spatial resolution of fTCD is limited to the vascular territory of the insonated artery. Ideally, fTCD should be complemented by other non‐invasive functional imaging techniques with high spatial resolution, e.g., functional magnetic resonance imaging (fMRI). Functional MRI is particularly helpful in imaging spatially localized brain tissue oxygenation changes. However, this technique has its own unique set of problems, limiting its general applicability to subjects able to lie still in the scanner for an extended period of time and cooperate adequately with the cognitive task.
The goal of the present study was to investigate whether fTCD and fMRI determine hemispheric dominance of brain activation related to visuospatial attention concordantly. Therefore, we directly compared fTCD with fMRI for determination of lateralization of brain activation in 15 healthy volunteers during the Landmark task. This task is based on a frequently used visuospatial neglect task, in which subjects had to decide whether a pretransected line is divided in the exact center, or slightly to the right or left of the center [Harvey et al., 1995]. We assessed whether the hemisphere dominant for the Landmark activation is concordantly determined by both techniques.
SUBJECTS AND METHODS
Subjects
Fifteen healthy volunteers (7 men; age 24–30 years, mean age: 26 years) participated in the study. All subjects had completed the equivalent of a high school degree (“Gymnasium”). Nine of the volunteers were right handed and six were left handed by the Edinburgh handedness inventory [Oldfield, 1971]. None had a serious history of medical, neurological or psychiatric illnesses, brain pathology, or abnormal brain morphology on T1‐weighted MR images. All subjects gave their written informed consent prior to participation.
Based on their language dominance, subjects were selected from a cohort of 326 healthy volunteers previously assessed for language dominance by fTCD [Knecht et al. 2000a, b]. One third of the subjects had an atypical right‐hemisphere representation for language. This was done so as to increase the possibility to also include subjects with an atypical left‐hemisphere representation for spatial attention.
Paradigm
For the purpose of functional imaging studies, hemispheric lateralization for attention may be assessed in a number of ways [for review, see Cabeza and Nyberg 2000]. In the present study, we chose to examine lateralization for spatial attention by the Landmark task. Subjects had to decide whether pretransected horizontal lines were correctly bisected (Fig. 1). Although this task is not without criticism [Ferber and Karnath 2001], it was chosen because it corresponds to deficits frequently encountered in patients suffering from visuospatial neglect after stroke [Harvey et al. 1995; Heilman, 1997; Marshall 1998; Mesulam, 1999]. The Landmark task allows for robust brain activation amenable to assessment by perfusion sensitive functional imaging [Fink et al., 2000, 2001; Floel et al., 2001, 2002].
Figure 1.
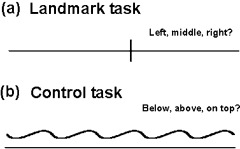
Paradigm design. a: Activation task. Subjects were presented with a horizontal line, bisected by a vertical line either in the exact middle or slightly deviating to the left or the right. They had to decide where the horizontal line was bisected. b: Control task (fMRI only). As in the activation task, a horizontal line was shown, together with a waveform shaped line. Subjects had to decide whether the line was overlapping with, above or below the horizontal line.
Functional Transcranial Doppler Ultrasonography
Experimental design
Five seconds after a cueing tone, a horizontal line was presented for 10 s on a computer screen (visual angle 9.3°). A vertical line bisected the horizontal line either in the exact middle or slightly deviating to the left or the right (Fig. 1a). Subjects silently decided where the horizontal line was bisected. Task compliance was ensured by having subjects report the decision verbally (middle, left, or right) after another auditory signal, following the presentation of the bisected line. A third auditory signal, 5 s later, marked the beginning of a resting condition, which lasted 20 s and during which subjects were instructed to imagine a night sky. The next Landmark task was presented in the same way. Twenty epochs were recorded in total.
FTCD data acquisition
Using a commercially available 2‐MHz transcranial Doppler ultrasonography device (Multidop T; DWL Sipplingen, Germany) the blood flow velocities within both MCAs were measured continuously (Fig. 2A,B). Details of the technique, especially the identification of the MCAs, are described elsewhere [Ringelstein et al., 1990]. The spectral envelope curves of the Doppler signal were stored for offline analysis.
Figure 2.
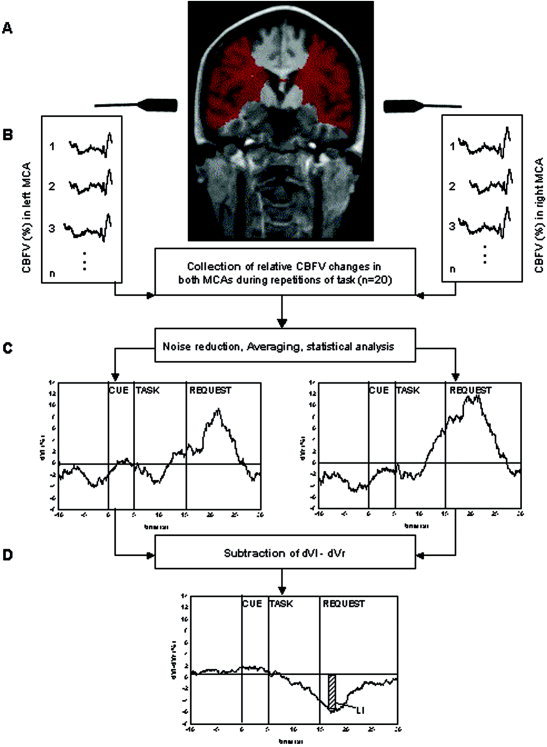
Collection and analysis of CBFV changes measured by fTCD during the Landmark task. A: The territory of both MCAs marked in red. B: The collection of relative CBFV changes during individual repetition of task (n=20). C: The relative CBFV changes of the left and right MCA after off‐line analysis by AVERAGE. D: The calculation of the LIfTCD during the Landmark task: after subtraction of averaged relative CBFV changes in the right from the left MCA (dVl–dVr), the maximum was taken and integrated over a period of 2 s during the interval of 10 to 20 s after the cueing tone.
FTCD data analysis
Analysis was performed using the software package AVERAGE [Deppe et al., 1997]. After automatic artefact rejection, like probe displacement, data were integrated over the corresponding cardiac cycles, segmented into epochs that related to the first cueing tone and averaged (Fig. 2C). The mean velocity in the 15‐s precueing interval (Vpre.mean) was taken as a baseline value. The relative CBFV changes (dV) were calculated by the formula
where V(t) is the CBFV over time and Vpre.mean the mean velocity in the pre‐cueing interval.
Differences in the velocity between both MCAs were statistically analyzed using the Wilcoxon test for each sample point. (See Figure 4 for examples of dV change related to visuospatial attention.)
Figure 4.
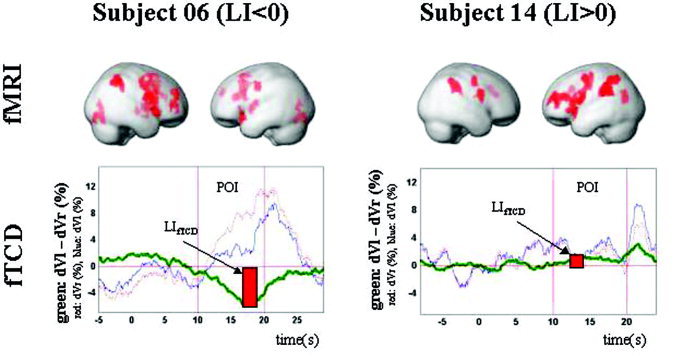
fMRI and fTCD results of two representative subjects. Top: fMRI activation pattern for representative subjects with typical right hemispheric (Subject 06) and atypical left hemispheric (Subject 14) dominance for spatial attention. Depicted are relative increases in neural activity associated with the Landmark task relative to the control task. Activations are rendered on the surface of the standard SPM99‐template (pvoxel = 0.001, pcluster < 0.05, corrected for multiple comparisons). Bottom: fTCD lateralization pattern. The green curve represents the relative CBFV difference between the right (red) and left (blue) MCA during the line bisectioning task. The red bar illustrates the fTCD lateralization index, calculated within the predefined “period of interest” (POI).
Functional Magnetic Resonance Imaging
Experimental design
Five seconds after a short colour change (duration 0.5 s), subjects were presented with a horizontal line for 5 s on a computer screen (visual angle 9.3°). The horizontal line was either bisected by a vertical line in the exact middle or slightly deviating to the left or the right (Landmark task) or presented together with a waveform‐shaped line (control task) (Fig. 1). Subjects silently decided where the horizontal line was bisected (Landmark task) and where the waveform‐shaped line was presented (control task), respectively. After this period, subjects were instructed to report their decision by pressing corresponding buttons on a response pad with both hands. After 2 s, another colour change marked the beginning of the next epoch. Six Landmark tasks were followed by six control tasks. This sequence was repeated seven times.
MRI data acquisition
All MRI data were acquired on a neuro‐optimized GE 1.5T whole body scanner equipped with a standard circular polarized head coil. Functional images were acquired using a T2* weighted gradient echo EPI sequence (TE = 40 ms, TR = 2 s, flip angle 90°, slice thickness 7 mm, 1 mm gap, matrix 64 × 64, FOV 200 mm, in‐plane resolution 3.125 × 3.125 mm). Sixteen axial slices orientated parallel to the AC–PC line covering the whole head were taken. Additional high‐resolution T1 weighted anatomical images were acquired (TE = 8 ms, TR = 24 ms, flip angle 30°, matrix 256 × 256, FOV 250 mm, 124 sagittal slices, slice thickness 1.5 mm).
MRI data analysis
SPM99 (available online at http://www.fil.ion.ucl.ac.uk/spm) was used for realignment, normalization, smoothing, and statistical analysis to create statistical parametric maps of significant relative regional BOLD response changes [Friston et al., 1995].
The first five images of each session, during which the MR signal reaches a steady state, were discarded. The remaining scans of each individual were realigned to the first image (corresponding to the sixth acquired image of the time series) to correct for movement artifacts. Sinc interpolation was used in the transformation. A mean functional image volume was constructed for each subject from the realigned images and co‐registered with the anatomical image. The functional images were normalized to a template brain image created by the Montreal Neurological Institute (MNI) [Evans et al., 1994]. The coregistered anatomical image was used to determine the parameters for the spatial normalization process [Friston et al., 1995]. The resulting pixel size in standard stereotactic coordinates was 2 × 2 × 2 mm3. The normalized images were smoothed using an isotropic Gaussian kernel (FWHM 6 mm).
The time series was filtered with the hrf as lowpass filter. Statistical analysis was performed on individual data. The experimental conditions (Landmark task, control task) were modeled using a boxcar function convolved with a hemodynamic response function (hrf) [Friston et al., 1994]. Fitting this boxcar function to the time series at each voxel results in a parameter estimate image. This image indicates how strongly the waveform fits to the fMRI data at each voxel. By dividing the parameter estimate by its standard error, the parameter estimate image is converted to a t‐statistic image. These t‐statistics constitute a statistical parametric map (SPM) and can be interpreted by referring to the probabilistic behavior of Gaussian random fields.
Determination of Hemispheric Dominance
Calculation of LIfTCD
The LIfTCD was computed by
where
is the difference between the relative CBFV changes in the left and right MCA (Fig. 2D). The time point t max represents the latency of the absolute maximum of ΔV(t) within the activation interval (10–20 s). As integration interval, a time period of t int = 2 s was chosen. A positive value of the LIfTCD indicates left hemispheric processing for spatial attention; a negative value stands for right hemisphere dominance. The magnitude represents the degree of lateralization. The accuracy of the LIfTCD of each individual is determined by its stochastically estimated confidence interval. A graphic illustration of the LIfTCD is given in Figure 2D.
Calculation of LIfMRI
How to best calculate the laterality index for fMRI is still a matter of considerable debate. Typically, two approaches have been taken in fMRI studies. The first is to measure brain activity based on the extent of the activated brain region, i.e., the number of active voxel in a predefined region of interest (ROI) at a chosen statistical threshold [Binder et al., 1996; Desmond et al., 1995; Deppe et al., 2000]. The second is to measure the magnitude of the fMRI signal change within a region of interest [Adcock et al., 2003; Cohen and DuBois, 1999]. The choice of the methods may significantly influence the laterality index. Therefore, we investigated both methods of quantifying brain activity in order to assess the best way to determine the hemispheric lateralization.
For fMRI, a lateralization index was calculated by the formula
where AL and AR refer to measures of fMRI‐measured activity for equal regions of interest (ROI) within the left (L) and right (R) hemispheres. According to the definition of LIfTCD a positive value of the LIfMRI represents left‐hemisphere dominance for spatial attention; a negative value represents right‐hemisphere dominance. We chose to assess three different approaches, similar to the proceedings of Adcock et al. [2003].
-
1
AL and AR were calculated by the volume of significantly activated brain, above a given statistical threshold Pvoxel and achieving a cluster significance threshold of Pcluster < 0.05 (corrected for multiple comparisons) in a large, anatomically defined ROI, including all cerebral regions within one hemisphere and excluding the cerebellum. To assess the effect of the statistical threshold Pvoxel, the laterality index was calculated for a range of statistical thresholds (P = 10–2 to P = 10–7). The lower limit (P < 0.01) is a common statistical threshold in many fMRI studies, the upper limit (P < 0.0000001) was higher than is conventionally chosen.
-
2
Spatial attention is a distributed function in the brain. It is subserved by a large‐scale neurocognitive network, with cortical epicentres located in the parietal and frontal cortex [Fink et al., 2000, 2001; Mesulam, 1999]. Regions within this network might show different extents of lateralization. Therefore, we calculated separate indices of laterality for the frontal and the parietal region. A ROI was derived from those voxels that were active (at Pvoxel < 0.01 and Pcluster < 0.05, corrected for multiple comparisons) in at least 70% of the subjects with the typical pattern of lateralization (language left, spatial attention right). Those commonly activated regions were predominantly right hemispheric (Fig. 3). A corresponding left hemispheric ROI was generated that was homologous to that of the right hemisphere by reflection of the right hemispheric ROI through the midline. As in approach 1, the measure of activity was based on the volume of significantly activated brain applying the same statistical thresholds.
-
3
AL and AR were based on the magnitude of task‐induced mean signal intensity change within the same functionally defined ROI as described in 2. No choice of threshold is involved in calculating these indices.
Figure 3.
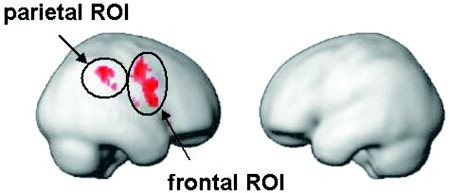
Graphic depiction of the functionally defined ROIs.
The fMRT‐laterality indices derived from the extent of significant activity within anatomical and functional ROIs (approach 1 and 2) are labelled LIext,anat and LIext,func, respectively. The laterality indices derived from the magnitude of the mean signal change within the functional ROI (approach 3 is labelled LImag,func).
RESULTS
FTCD
During the Landmark task interval, fTCD established in all subjects significant differences between CBFV in the MCAs (P < 0.05, Wilcoxon test). Averaged perfusion differences of two representative subjects are shown in Figure 4. In 12 subjects, lateralization was to the right, and in three subjects, it was to the left side (Table I).
Table I.
fTCD results: laterality index LIfTCD and hemispheric dominance
| Subject ID | LIfTCD | Hemispheric dominance |
|---|---|---|
| 01 | −4.1 ± 0.6 | R |
| 02 | −3.6 ± 0.8 | R |
| 03 | −1.7 ± 0.6 | R |
| 04 | −5.5 ± 0.5 | R |
| 05 | −3.2 ± 0.8 | R |
| 06 | −4.4 ± 0.7 | R |
| 07 | −4.8 ± 0.4 | R |
| 08 | −5.5 ± 0.7 | R |
| 09 | −4.5 ± 0.5 | R |
| 10 | −3.6 ± 0.9 | R |
| 11 | −2.9 ± 0.7 | R |
| 12 | −3.2 ± 0.5 | R |
| 13 | 4.0 ± 0.9 | L |
| 14 | 0.9 ± 0.4 | L |
| 15 | 3.8 ± 0.9 | L |
fMRI
Functional MRI analysis showed that the Landmark task activates a large neurocognitive network. The main activation centers are located in the anterior cingulate cortex (BA 24/32), the lateral parietal cortex (BA 7/40), and the fronto‐temporal cortex (BA 45/10). Activation pattern of two representative subjects with right and left hemispheric dominance for spatial attention, respectively, are provided in Figure 4.
The laterality indices for all subjects are summarized in Tables II, III, IV. In all but three subjects, hemispheric dominance could be determined unambiguously, independent of the chosen approach. Hemispheric dominance is at first view rather ambiguous for subjects 02, 13, and 15.
Table II.
fMRT results: Laterality index based on the extent of activation (LIext,anat), using the number of voxels in a large, anatomically defined ROI (including the cerebrum and excluding the cerebellum) for a range of statistical thresholds pvoxel
| Subject ID | LIext,anat | Hemispheric dominance | |||||
|---|---|---|---|---|---|---|---|
| 10−2 | 10−3 | 10−4 | 10−5 | 10−6 | 10−7 | ||
| 01 | −0.3 | −0.5 | −0.6 | −0.7 | −0.8 | −0.8 | R |
| 02 | −0.4 | −0.8 | −1 | −1 | −1 | −1 | R |
| 03 | −1 | −1 | −1 | n.s. | n.s. | n.s. | R |
| 04 | −0.6 | −0.6 | −1 | −1 | −1 | −1 | R |
| 05 | −1 | −1 | −1 | −1 | −1 | −1 | R |
| 06 | −0.3 | −0.5 | −0.6 | −0.6 | −0.6 | −0.8 | R |
| 07 | −0.3 | −0.4 | −0.5 | −0.5 | −0.5 | −0.6 | R |
| 08 | −0.7 | −0.7 | −0.8 | −1 | −1 | −1 | R |
| 09 | −0.6 | −0.8 | −0.9 | −0.9 | −1 | −1 | R |
| 10 | −0.8 | −1 | −1 | −1 | −1 | −1 | R |
| 11 | −0.2 | −0.3 | −0.5 | −1 | −1 | n.s. | R |
| 12 | −0.1 | −0.2 | −0.3 | −0.3 | −0.4 | −0.4 | R |
| 13 | 0.1 | 0.2 | 0.3 | 0.1 | −0.1 | −0.2 | — |
| 14 | 0.2 | 0.6 | 0.7 | 0.8 | 1 | 1 | L |
| 15 | 0.2 | 0.3 | 0.4 | 0.4 | 0.5 | 0.6 | L |
Values are expressed as Pvoxel.
n.s., no significant activation
Table III.
fMRT results: laterality index based on the extent of activation (LIext,func), using the number of voxels in the most significantly activated brain regions in the frontal (ROIfrontal) and parietal (ROIparietal) cortex for a range of statistical thresholds pvoxel
| Subject ID | pvoxel | Hemispheric dominance | |||||
|---|---|---|---|---|---|---|---|
| 10−2 | 10−3 | 10−4 | 10−5 | 10−6 | 10−7 | ||
| LIext,func (ROIfrontal) | |||||||
| 01 | −0.4 | −0.4 | −0.4 | −0.4 | −0.4 | −0.4 | R |
| 02 | −1 | −0.9 | −1 | −1 | −1 | n.s. | R |
| 03 | −1 | −1 | −1 | n.s. | n.s. | n.s. | R |
| 04 | −1 | −1 | −1 | n.s. | n.s. | n.s. | R |
| 05 | −1 | −1 | −1 | −1 | −1 | −1 | R |
| 06 | −0.9 | −1 | −1 | −1 | −1 | −1 | R |
| 07 | −0.7 | −0.9 | −1 | −1 | −1 | −1 | R |
| 08 | −1 | −1 | −1 | −1 | −1 | −1 | R |
| 09 | −1 | −1 | −1 | −1 | −1 | −1 | R |
| 10 | −1 | −1 | n.s. | n.s. | n.s. | n.s. | R |
| 11 | −0.8 | −0.8 | n.s. | n.s. | n.s. | n.s. | R |
| 12 | −0.2 | −0.2 | −0.3 | −0.4 | −0.5 | −0.5 | R |
| 13 | 1 | 1 | 1 | 1 | 1 | n.s. | L |
| 14 | 0.0 | 0.1 | 0.3 | 0.6 | 0.9 | 1 | L |
| 15 | 0.6 | 0.9 | 1 | 1 | 1 | 1 | L |
| LIext,func (ROIparietal) | |||||||
| 01 | −0.6 | −0.9 | −1 | −1 | −1 | −1 | R |
| 02 | −1 | −1 | n.s. | n.s. | n.s. | n.s. | R |
| 03 | −1 | −1 | n.s. | n.s. | n.s. | n.s. | R |
| 04 | −1 | −1 | n.s. | n.s. | n.s. | n.s. | R |
| 05 | −1 | −1 | −1 | −1 | −1 | n.s. | R |
| 06 | −1 | −1 | −1 | n.s. | n.s. | n.s. | R |
| 07 | −1 | −1 | −1 | −1 | −1 | −1 | R |
| 08 | −1 | −1 | −1 | −1 | −1 | n.s. | R |
| 09 | −0.8 | −1 | −1 | −1 | −1 | n.s. | R |
| 10 | −1 | −1 | n.s. | n.s. | n.s. | n.s. | R |
| 11 | −0.4 | −0.8 | −1 | −1 | n.s. | n.s. | R |
| 12 | 0.0 | 0.0 | 0.0 | 0.0 | 0.0 | 0.0 | Bilateral |
| 13 | 1 | 1 | 1 | 1 | n.s. | n.s. | L |
| 14 | 0.0 | 0.0 | 0.2 | 0.7 | 1 | 1 | L |
| 15 | 0.0 | −0.1 | −0.2 | −0.4 | 0.4 | 1 | — |
n.s., no significant activation in left and right ROI
Table IV.
fMRT results: Laterality index based on the magnitude of the mean signal intensity change in the most significantly activated brain regions in the frontal (ROIfrontal) and parietal (ROIparietal) cortex
| Subject ID | LImag,func | Hemispheric dominance | |
|---|---|---|---|
| ROIfrontal | ROIparietal | ||
| 01 | −0.4 | −0.6 | R |
| 02 | 7.3 | −2.4 | — |
| 03 | 0.0 | −0.5 | Bilateral/R |
| 04 | −0.6 | −1.5 | R |
| 05 | −0.6 | −0.8 | R |
| 06 | −0.5 | −0.5 | R |
| 07 | −0.6 | −1.2 | R |
| 08 | −0.3 | −0.3 | R |
| 09 | −0.3 | −0.6 | R |
| 10 | −1.4 | −0.2 | R |
| 11 | −0.1 | −0.1 | R |
| 12 | −0.4 | 0.0 | R/Bilateral |
| 13 | 1.1 | 1.8 | L |
| 14 | 0.0 | 0.2 | Bilateral/L |
| 15 | 0.3 | 0.1 | L |
FTCD and fMRI in Comparison
FTCD and fMRI results are summarized in Figure 5. The fTCD and fMRI examinations were unambiguously concordant in 12 of 15 cases in determining the hemisphere dominant for spatial attention. For three subjects, fMRI results indicated at first view an ambiguous hemispheric dominance, depending on the chosen approach. These discrepancies will be explained in the following by a more detailed analysis of their activation pattern.
Figure 5.
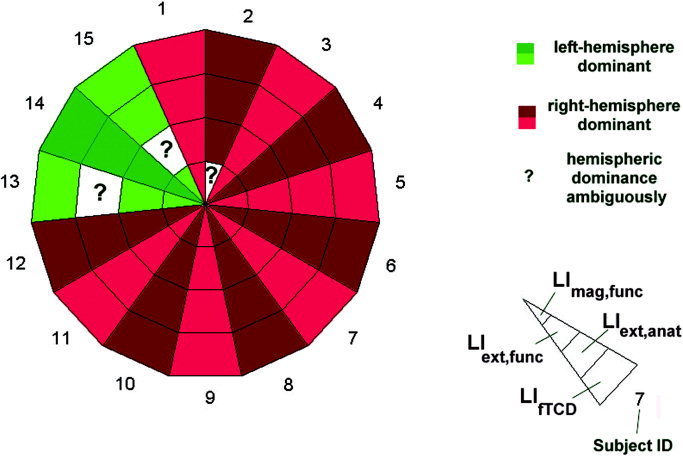
Summary of results: Hemispheric dominance as determined by fTCD and fMRI. The latter was determined using three different methods (LIext.anat, LIext.func, LImag.func). In all but three subjects, hemispheric dominance could be determined unambiguously by both methods. In the remaining three cases, fMRT data indicated an ambiguous hemispheric dominance. As discussed in the text, fTCD and fMRT nevertheless provide concordant information about hemispheric dominance for spatial attention.
Case 1: subject 02
Based on LIext,anat, subject 02 is classified as right‐hemisphere dominant. This is supported by LIext,func, indicating right‐hemisphere dominance for both the frontal and the parietal ROI (see activation pattern in Fig. 6). In contrast, LImag,func suggests left‐hemisphere dominance for the frontal ROI.
Figure 6.
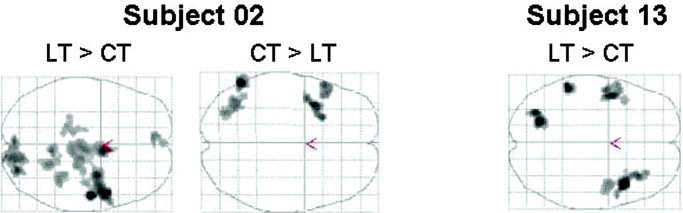
Activation pattern for Subjects 02 and 13. Left: Based on the extent of activation, using the number of activated voxels above a statistical threshold, subject 02 is right hemispheric dominant for spatial attention. This is illustrated in the activation pattern above (LT > CT, Landmark task > Control task). If the laterality index is calculated by the magnitude of the mean signal intensity change in the most significantly activated ROIs in the frontal and parietal cortex, Subject 02 displays left hemispheric dominance for the frontal ROI. A more detailed analysis of its activation pattern reveals that this does not describe the “true” hemispheric dominance. The implicit assumption was that one deals with activation in the left as well as in the right ROI. As one can see in the reverse contrast (CT > LT, Control task > Landmark task), there is a strong deactivation, i.e., stronger activation in the control task than in the actual activation task. Right: For Subject 13, the majority of the activation centres is located in the left hemisphere; however, the most significant activated cluster is in the right fronto‐temporal cortex. At low statistical thresholds, the activation pattern displays left hemispheric dominance, at high thresholds right hemispheric dominance. Activated areas are shown as through‐projections onto a transversal representation of standard stereotactic space (pvoxel = 0.001, pcluster < 0.05, corrected for multiple comparisons). The abbreviations used were LT = Landmark task, CT = Control task.
Implicit assumption for the calculation of laterality indices based on signal changes is that one deals with activations. This is clearly the case for, e.g., word generation tasks, where there is activation in Broca's area as well as in its homologue [Adcock et al., 2003]. This assumption was not met in our study. In five subjects there was a deactivation in at least one of the ROIs in the subdominant hemisphere, i.e., there was stronger activation in the control task than in the actual activation task. At best, this led to laterality indices greater than 1 (Subjects 04, 11, 15, 16) (Table III), at worst, when the deactivation is greater than the activation, this led to a reversal of laterality (Subject 02). For this subject, the laterality index based on the magnitude of the mean signal intensity change does not describe “true” hemispheric dominance (Fig. 6, left). Subject 02 is clearly right‐hemisphere dominant for spatial attention. Therefore, fTCD and fMRI results are concordant in this case as well.
Case 2: subject 13
For subject 13, LIext,func and LImag,func indicate clear left‐hemisphere dominance for spatial attention; however, LImag,func does reflect a rather ambiguous hemispheric dominance. At low thresholds, it indicates left‐hemisphere dominance and at high thresholds right‐hemisphere dominance. This discrepancy can be explained by a more detailed analysis of the activation pattern (Fig. 6, right). The majority of the activation centres is located in the left hemisphere, while the most significant activated cluster is in the right fronto‐temporal cortex, a bit apart from the functional defined ROIs. Therefore, Subject 13 has at low thresholds more activated brain volume in the left hemisphere. At high thresholds, only the most significant activated cluster survives, now indicating right hemispheric dominance.
One might consider this subject as being right hemisphere dominant, because the most significant activated brain region is in the right hemisphere. Nevertheless, the majority of the activation centres is located on the left side. While the fMRI activation pattern is severely influenced by the chosen statistical threshold, fTCD is more concerned about CBFV changes, and they do not disappear by applying rigid thresholds. Therefore, also in this case fMRT and fTCD results must be considered as concordant.
Case 3: subject 15
Based on LIext,anat and LImag,func, Subject 15 is clearly classified as left‐hemisphere dominant. This is illustrated in Figure 7, where the activation in the left hemisphere is more extended than in the right hemisphere. However, LIext,func indicates an ambiguous hemispheric dominance for the parietal ROI. Subject 15 shows at high statistical thresholds left hemispheric dominance, but is classified at more liberal thresholds as rather bilateral or right hemisphere dominant. The extent of activation in the parietal cortex is more or less evenly distributed over the hemispheres, although the more significant activation is located in the left hemisphere. Nevertheless, the right hemispheric activation “fits better” to the functionally defined ROI, whereas the left hemispheric activation is a bit out of place. Thus, LIext,func indicates at liberal statistical thresholds right hemispheric dominance.
Figure 7.
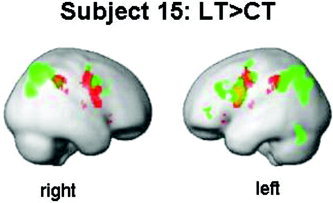
Activation pattern for Subject 15. Marked in green are those brain regions associated with the Landmark task (LT) relative to the control task (CT). Marked in red are the functionally defined ROIs. Activations are rendered on the surface of the standard SPM99 template (pvoxel = 10‐5, pcluster < 0.05, corrected for multiple comparisons). The left hemispheric activation is more extended than the activation in the right hemisphere. Therefore, LIext.anat indicates left hemispheric dominance. The extent of the activation in the parietal cortex is more or less evenly distributed over the hemispheres. But, as is demonstrated here, the right hemispheric activation “fits better” to the functionally defined ROI, whereas the left hemispheric activation is a bit out of place. Thus LIext.func indicates at liberal statistical thresholds right hemispheric dominance.
Though spatial‐attention is a distributed function in the brain, its distribution is selective, and regions within its network may show different extents of lateralization. Lumping all regions into one lateralization index might lead to a “messy” measure, unlikely to reflect any systematic pattern of lateralization in the key participating brain regions. Therefore, LIext,func might be better suited to describe the hemispheric lateralization regarding spatial attention itself. Nevertheless, fTCD is not just restricted to specific attention‐related brain regions, but measures CBFV changes over the whole vascular territory of the insonated artery. Therefore, for a formal comparison between both techniques, LIext,anat is better suited to describe hemispheric dominance. From this viewpoint, Subject 15 must be considered as left‐hemisphere dominant, in accordance with the fTCD results.
Taken together, fTCD and fMRI provide concordant results about the hemispheric dominance of spatial attention in every single case.
DISCUSSION
FTCD and fMRI examinations provided concordant information in the assessment of hemispheric dominance for spatial attention in every single case. In three cases, however, hemispheric dominance could not be determined unambiguously by fMRI using standard calculation methods for hemispheric dominance. A more detailed analysis of their respective activation pattern had to be performed to assess hemispheric dominance properly.
Properties of fTCD
Analysis of cerebral functional lateralization by fTCD, as performed by AVERAGE, constitutes a fully automated procedure and does not depend on arbitrary or adjustable parameters. Particularly, the quantitative measures obtained by fTCD are not biased by defining variable statistical thresholds. For a language task as well as for the Landmark task, fTCD has been shown to provide highly reproducible results over repeated measurements [Floel et al., 2002; Knecht et al., 1998b]. Therefore, for the purpose of this study, hemispheric dominance as determined by fTCD was considered the “gold standard.”
In a number of previous studies, it has been demonstrated that blood flow increases in the middle cerebral arteries associated with word generation allow for calculation of an index of language lateralization that correlates closely with data from the amobarbital procedure and from fMRI [Knecht et al., 1998a; Knake et al., 2003; Rihs et al., 1999]. Intermethod validation between fTCD and fMRI has already been conducted for the assessment of hemispheric lateralization for language [Deppe et al., 2000]. Intermethod validation between fTCD and the Wada procedure [Wada and Rasmussen, 1960] has not been conducted so far for attentional lateralization. However, the validity of fTCD for measuring another lateralized function, assessed with a similar overall paradigm [Knecht et al., 1998a], strongly suggests that fTCD is not only reliable but also valid in assessing hemispheric dominance for attention.
Properties of fMRI
As opposed to fTCD, fMRI has a high spatial resolution. For a comparison of both techniques, fMRI data have to be collapsed into an index, LIfMRI, that also describes both hemispheric dominance and the degree of lateralization. There are several approaches to quantify brain activity from the fMRI data in order to describe hemispheric dominance. Typically, two approaches have been taken in fMRI studies. The first is to measure brain activity by the extent of the activated region, i.e., the number of activated voxels above a statistical threshold (LIext,anat, LIext,func). The second is to measure the magnitude of the fMRI signal change between two tasks within a region of interest (LImag,func).
For a long time, the most popular approach in practice has been to count the number of voxels in a ROI (LIext,anat, LIext,func) [Binder et al., 1996; Deppe et al., 2000; Lehericy et al., 2000]. A serious drawback of this measure is its dependence on the (arbitrarily chosen) statistical threshold. At low thresholds (high P values), the occurrence of false positive voxels in both hemispheres leads typically to a bilateral activation pattern, moving LI towards zero. At higher thresholds (low P values) the number of active voxels decreases, false‐positive voxels as well as “truly” activated voxels are excluded. LI approaches ± 1. Furthermore, for a language task, a number of recent studies showed that the reproducibility of this measure (with respect to the degree of lateralization, not the hemispheric dominance) is relatively poor [Adcock et al., 2003; Cohen and DuBois, 1999; Nagata et al., 2001; Ramsey et al., 2001; Rutten et al., 2002].
There have been several attempts to assess fMRI activation magnitudes to describe hemispheric dominance readily across trials. One approach has been to combine several different activation tasks. This approach is geared toward identifying brain regions that are generically involved in a cognitive function rather than regions that are specific to a single task. For a language task it has been shown that this method allows assessment of language lateralization with some variation of tasks and statistical thresholding, but also yields reliable and reproducible results [Ramsey et al., 2001; Rutten et al., 2002]. In our case, the combination of several spatial attention‐related tasks was not implementable. We are interested in using fTCD as a screening method, which means fTCD must be reliable and fast. The use of several different tasks would be too time consuming.
A yet different method was to calculate the laterality index by the magnitude of the fMRI signal change between two tasks within a region of interest (LImag,func). Although this method has been shown to produce more robust and reproducible results in other studies using a word generation paradigm [Adcock et al., 2003] or visual and motor tasks [Cohen and DuBois, 1999], it proved to be not fully appropriate in the present study. It proved that there has to be activation in both the left‐ and right‐hemispheric ROI. If a subject has deactivation in the subdominant hemisphere, i.e., stronger activation in the control task than in the activation task, indices of laterality become ±1 and thus not interpretable at best. If the deactivation in the subdominant hemisphere is even higher than the activation in the dominant hemisphere, this approach leads even to a reversal of the sign of the laterality index, therefore producing a misleading hemispheric dominance.
Taken together, the present data suggest that for a description of hemispheric dominance of a cognitive function in fMRI, an index of laterality that is based on just one method of calculation is not always sufficient to describe the “true” pattern of lateralization. It might be necessary to apply different evaluation strategies, combined with a careful and detailed analysis of the specific activation pattern.
Application Fields of fTCD
Used together, fMRI and fTCD may open up a wide range of application in neuroscience. One important question is how the brain organizes in the case of atypical lateralization of a cognitive function. For language, a recent fMRI study showed that in atypical, right‐hemisphere language dominance, there is a mirror reverse pattern without discongruencies of activation in right‐ as compared with left‐hemisphere dominant subjects for a task of phonetic word generation [Knecht et al., 2003]. It is not known if this is a general principle of brain organization, holding true for all cognitive functions, or is just valid for language. The answer to this question will not only advance our knowledge about the constraints underlying brain organization, but will also be of clinical relevance. Differences in the extent of attentional lateralization might cause differences in susceptibility to attentional deficits after a unihemispheric lesion, similar to what is known about the language system [Knecht et al., 2002]. It is also unknown how the presence of two, normally in different hemispheres residing cognitive functions affect each other. For example, atypical right‐hemisphere lateralization of language may interact with “normally” right hemispheric lateralized processes like attention, leading to increased recruitment of left hemispheric areas in attentional processing.
The question then arises how to recruit subjects with an atypical lateralization. Functional MRI investigations are costly and time consuming. Unlike fTCD measurements, they are not suited to study large cohorts of subjects to screen for subjects with atypical lateralization. Ideally, fTCD can be used to screen large cohorts of subjects for hemispheric dominance of a cognitive function, e.g., to recruit subjects with an atypical, left‐hemisphere lateralization for spatial attention, whilst fMRI can subsequently be used to obtain more detailed intrahemispheric information about the foci of activation.
Another newly emerged application field of fTCD is the study of genetic cohorts. Hemispheric lateralization of higher cognitive functions may be genetically determined [Annett and Alexander, 1996; McManus, 1985]. To investigate whether the lateralization of a cognitive function is a genetic trait, the investigation of large cohorts is necessary, making fTCD the ideal tool to do so. In the last years, preliminary data have been collected on the patterns of inheritance of language lateralization, which promise insights into its genetic basis [Anneken et al., 2001, 2003]. In a similar vein, fTCD should be capable to contribute to the understanding of spatial attention.
CONCLUSION
Functional MRI and fTCD complement each other in the noninvasive and reliable assessment of the hemispheric dominance for spatial attention. FTCD can be used to screen large cohorts of subjects for hemispheric dominance of spatial attention, e.g., to recruit subjects with an atypical, left‐hemisphere lateralization, whilst fMRI can subsequently be used to obtain more detailed intrahemispheric information about the foci of activation and thus the implementation of cognitive functions in the brain.
Acknowledgements
This work was supported in part by Nordrhein‐Westfalen (Bennigsen‐Foerder‐Preis IVA 6‐400 302 97 and Nachwuchsgruppe: Hemispheric specialization). We thank V. Besmens and J. Sommer for invaluable comments and technical support.
REFERENCES
- Adcock JE, Wise RG, Oxbury JM, Oxbury SM, Matthews PM (2003): Quantitative fMRI assessment of the differences in lateralization of language‐related brain activation in patients with temporal lobe epilepsy. Neuroimage 18: 423–438. [DOI] [PubMed] [Google Scholar]
- Alexander MP Annett M (1996): Crossed aphasia and related anomalies of cerebral organization: case reports and a genetic hypothesis. Brain Lang 55: 213–239. [DOI] [PubMed] [Google Scholar]
- Anneken K, Breitenstein C, Dräger B, Konrad C, Deppe M, Knecht S (2001): Preliminary evidence for a genetic factor involved in determining the degree of hemispheric language lateralization. Neuroimage 13: S496. [Google Scholar]
- Anneken K, Konrad C, Dräger B, Breitenstein C, Kennerknecht I, Knecht S (2004): Familial aggregation of strong hemispheric language lateralisation. Submitted for publication. [DOI] [PubMed]
- Annett M, Alexander MP (1996): Atypical cerebral dominance: predictions and tests of the right shift theory. Neuropsychologia 34: 1215–1227. [DOI] [PubMed] [Google Scholar]
- Binder JR, Swanson SJ, Hammeke TA, Morris GL, Mueller WM, Fischer M, Benbadis S, Frost JA, Rao SM, Haughton VM (1996): Determination of language dominance using functional MRI: a comparison with the Wada test. Neurology 46: 978–984. [DOI] [PubMed] [Google Scholar]
- Bookheimer S (2002): Functional MRI of language: new approaches to understanding the cortical organization of semantic processing. Annu Rev Neurosci 25: 151–188. [DOI] [PubMed] [Google Scholar]
- Cabeza R Nyberg L (2000): Imaging cognition II: An empirical review of 275 PET and fMRI studies. J Cogn Neurosci 12: 1–47. [DOI] [PubMed] [Google Scholar]
- Cohen MS DuBois RM (1999): Stability, repeatability, and the expression of signal magnitude in functional magnetic resonance imaging. J Magn Reson Imag 10: 33–40. [DOI] [PubMed] [Google Scholar]
- Deppe M, Knecht S, Henningsen H, Ringelstein EB (1997): AVERAGE: a Windows program for automated analysis of event related cerebral blood flow. J Neurosci Methods 75: 147–54. [DOI] [PubMed] [Google Scholar]
- Deppe M, Knecht S, Papke K, Lohmann H, Fleischer H, Heindel W, Ringelstein EB, Henningsen H (2000): Assessment of hemispheric language lateralization: a comparison between fMRI and fTCD. J Cereb Blood Flow Metab 20: 263–268. [DOI] [PubMed] [Google Scholar]
- Deppe M, Ringelstein E‐B, Knecht S (2003): The investigation of functional brain lateralization by transcranial doppler sonography. Neuroimage 21: 1124–1146. [DOI] [PubMed] [Google Scholar]
- Desmond JE, Sum JM, Wagner AD, Demb JB, Shear PK, Glover GH, Gabrieli JD, Morrell MJ (1995): Functional MRI measurement of language lateralization in Wada‐ tested patients. Brain 118: 1411–1419. [DOI] [PubMed] [Google Scholar]
- Dronkers NF Knight RT (1989): Right‐sided neglect in a left‐hander: evidence for reversed hemispheric specialization of attention capacity. Neuropsychologia 27: 729–735. [DOI] [PubMed] [Google Scholar]
- Evans AC, Kamber M, Collins DL, MacDonald D. (1994): An MRI‐based probabilistic atlas of neuroanatomy. New York: Plenum Press; p 263–274. [Google Scholar]
- Ferber S Karnath HO (2001): How to assess spatial neglect: line bisection or cancellation tasks? J Clin Exp Neuropsychol 23: 599–607. [DOI] [PubMed] [Google Scholar]
- Fink GR, Marshall JC, Shah NJ, Weiss PH, Halligan PW, Grosse‐Ruyken M, Ziemons K, Zilles K, Freund HJ (2000): Line bisection judgments implicate right parietal cortex and cerebellum as assessed by fMRI. Neurology 54: 1324–1331. [DOI] [PubMed] [Google Scholar]
- Fink GR, Marshall JC, Weiss PH, Zilles K (2001): The neural basis of vertical and horizontal line bisection judgments: an fMRI study of normal volunteers. Neuroimage 14: S59–S67. [DOI] [PubMed] [Google Scholar]
- Fischer RS, Alexander MP, Gabriel C, Gould E, Milione J (1991): Reversed lateralization of cognitive functions in right handers. Exceptions to classical aphasiology. Brain 114: 245–261. [PubMed] [Google Scholar]
- Floel A, Knecht S, Lohmann H, Deppe M, Sommer J, Dräger B, Henningsen H, Ringelstein EB (2001): Language and spatial attention can lateralize to the same hemisphere in healthy humans. Neurology 57: 1018–1024. [DOI] [PubMed] [Google Scholar]
- Floel A, Lohmann H, Breitenstein C, Dräger B, Buyx A, Henningsen H, Knecht S (2002): Reproducibility of hemispheric blood flow increases during line bisectioning. Clin Neurophysiol 113: 917–924. [DOI] [PubMed] [Google Scholar]
- Friston KJ, Jezzard P, Turner R (1994): Analysis of functional MRI time‐series. Human Brain Mapping 1: 153–171. [Google Scholar]
- Friston KJ, Holmes A, Worsley KJ, Poline J‐B, Frith CD, Frackowiak RSJ (1995): Statistical parametric maps in functional imaging: A general linear approach. Hum Brain Mapp 2: 189–210. [Google Scholar]
- Frost JA, Binder JR, Springer JA, Hammeke TA, Bellgowan PS, Rao SM, Cox RW (1999): Language processing is strongly left lateralized in both sexes. Evidence from functional MRI. Brain 122: 199–208. [DOI] [PubMed] [Google Scholar]
- Harvey M, Milner AD, Roberts RC (1995): An investigation of hemispatial neglect using the Landmark Task. Brain Cogn 27: 59–78. [DOI] [PubMed] [Google Scholar]
- Heilman KM. (1997): Neglect. Clinical and anatomic aspects In: Feinberg TEFMJ, editor. New York: McGraw‐Hill; p 309–317. [Google Scholar]
- Knake S, Haag A, Hamer HM, Dittmer C, Bien S, Oertel WH, Rosenow F (2003): Language lateralization in patients with temporal lobe epilepsy: a comparison of functional transcranial Doppler sonography and the Wada test. Neuroimage 19: 1228–1232. [DOI] [PubMed] [Google Scholar]
- Knecht S, Deppe M, Ebner A, Henningsen H, Huber T, Jokeit H, Ringelstein EB (1998a): Non‐invasive determination of hemispheric language dominance using functional transcranial Doppler sonography: A comparison with the Wada test. Stroke 29: 82–86. [DOI] [PubMed] [Google Scholar]
- Knecht S, Deppe M, Ringelstein EB, Wirtz M, Lohmann H, Dräger B, Huber T, Henningsen H (1998b): Reproducibility of functional transcranial Doppler sonography in determining hemispheric language lateralization. Stroke 29: 1155–1159. [DOI] [PubMed] [Google Scholar]
- Knecht S, Deppe M, Dräger B, Bobe L, Lohmann H, Ringelstein EB, Henningsen H (2000a): Language lateralization in healthy right‐handers. Brain 123: 74–81. [DOI] [PubMed] [Google Scholar]
- Knecht S, Dräger B, Deppe M, Bobe L, Lohmann H, Floel A, Ringelstein EB, Henningsen H (2000b): Handedness and hemispheric language dominance in healthy humans. Brain 123: 2512–2518. [DOI] [PubMed] [Google Scholar]
- Knecht S, Dräger B, Floel A, Lohmann H, Breitenstein C, Deppe M, Henningsen H, Ringelstein EB (2001): Behavioural relevance of atypical language lateralization in healthy subjects. Brain 124: 1657–1665. [DOI] [PubMed] [Google Scholar]
- Knecht S, Floel A, Dräger B, Breitenstein C, Sommer J, Henningsen H, Ringelstein EB, Pascual‐Leone A (2002): Degree of language lateralization determines susceptibility to unilateral brain lesions. Nat Neurosci 5: 695–699. [DOI] [PubMed] [Google Scholar]
- Knecht S, Jansen A, Frank A, Van Randenborgh J, Sommer J, Kanowski A, Heinze HJ (2003): How atypical is atypical language dominance? Neuroimage 18: 917–927. [DOI] [PubMed] [Google Scholar]
- Lehericy S, Cohen L, Bazin B, Samson S, Giacomini E, Rougetet R, Hertz‐Pannier L, Le Bihan D, Marsault C, Baulac M (2000): Functional MR evaluation of temporal and frontal language dominance compared with the Wada test. Neurology 54: 1625–1633. [DOI] [PubMed] [Google Scholar]
- Marshall JC (1998): Line bisection and neglect severity. Brain Cogn 38: 275–280. [DOI] [PubMed] [Google Scholar]
- McManus IC (1985): Handedness, language dominance and aphasia: a genetic model. Psychol Med Monogr Suppl 8: 1–40. [PubMed] [Google Scholar]
- Mesulam MM (1999): Spatial attention and neglect: parietal, frontal and cingulate contributions to the mental representation and attentional targeting of salient extrapersonal events. Phil Trans R Soc Lond B Biol Sci 354: 1325–1346. [DOI] [PMC free article] [PubMed] [Google Scholar]
- Nagata SI, Uchimura K, Hirakawa W, Kuratsu JI (2001): Method for quantitatively evaluating the lateralization of linguistic function using functional MR imaging. AJNR Am.J.Neuroradiol 22: 985–991. [PMC free article] [PubMed] [Google Scholar]
- Ojemann GA (1991): Cortical organization of language. J Neurosci 11: 2281–2287 [DOI] [PMC free article] [PubMed] [Google Scholar]
- Oldfield RC (1971): The assessment and analysis of handedness: the Edinburgh inventory. Neuropsychologia 9: 97–113. [DOI] [PubMed] [Google Scholar]
- Osmon DC, Panos J, Kautz P, Gandhavadi B (1998): Crossed aphasia in a dextral: a test of the Alexander‐Annett theory of anomalous organization of brain function. Brain Lang 63: 426–438. [DOI] [PubMed] [Google Scholar]
- Pujol J, Deus J, Losilla JM, Capdevila A (1999): Cerebral lateralization of language in normal left‐handed people studied by functional MRI. Neurology 52: 1038–1043. [DOI] [PubMed] [Google Scholar]
- Ramsey NF, Sommer IE, Rutten GJ, Kahn RS (2001): Combined analysis of language tasks in fMRI improves assessment of hemispheric dominance for language functions in individual subjects. Neuroimage 13: 719–733. [DOI] [PubMed] [Google Scholar]
- Rihs F, Sturzenegger M, Gutbrod K, Schroth G, Mattle HP (1999): Determination of language dominance: Wada test confirms functional transcranial Doppler sonography. Neurology 52: 1591–1596. [DOI] [PubMed] [Google Scholar]
- Ringelstein EB, Otis SM, Niggemeyer E, Kahlscheuer B (1990): Transcranial Doppler sonography: anatomical landmarks and normal velocity values. Ultrasound Med Biol 16: 745–761. [DOI] [PubMed] [Google Scholar]
- Rutten GJ, Ramsey NF, van Rijen PC, van Veelen CW (2002): Reproducibility of fMRI‐Determined Language Lateralization in Individual Subjects. Brain Lang 80: 421–437. [DOI] [PubMed] [Google Scholar]
- Trojano L, Balbi P, Russo G, Elefante R (1994): Patterns of recovery and change in verbal and nonverbal functions in a case of crossed aphasia: implications for models of functional brain lateralization and localization. Brain Lang 46: 637–661. [DOI] [PubMed] [Google Scholar]
- Wada J Rasmussen T (1960): Intracarotid injection of sodium amytal for the lateralization of cerebral speech dominance. J Neurosurg 17: 266–282. [DOI] [PubMed] [Google Scholar]