

Abstract
At present, functional magnetic resonance imaging (fMRI) of cortical language functions favors “silent” task paradigms with no overt speaking, due to severe motion artifacts in MR images induced by vocalization. To the extent that the neural substrate of silent speaking might differ from that of overt speaking, this is a problem for understanding spoken language. The present study combined event related fMRI methodology with a set of techniques for motion reduction, detection, and correction to further investigate overt speech and compare it to silent speech. The purpose of the study was two‐fold. We aimed to test a multiple‐step image processing protocol involving discrimination and separation of motion‐induced signals from activation‐induced signals and we aimed to use this multi‐step image processing protocol to compare the similarity of activation of cortical pathways potentially relevant to language production during silent and overt speech, focusing on Broca area and primary motor cortex as test cases. If the problem of motion artifact can be handled effectively, fMRI can add greatly to the tools available to investigate human language. Hum. Brain Mapping 15:39–53, 2001. © 2001 Wiley‐Liss, Inc.
Keywords: cortical activation, motion artifact, speech, Broca area, motor output for speech, aphasia
INTRODUCTION
At present, functional magnetic resonance imaging (fMRI) of cortical language functions favors “silent” task paradigms with no overt speaking. This is due to the possibility that vocalization might induce severe motion artifacts in MR images [Birn et al., 1998; Hinke et al., 1993; Yetkin et al., 1995]. As a consequence, investigators frequently adopt passive listening, silent reading, silent judgment tasks such as lexical decision or category membership with manual rather than vocal responses, and silent generation of internal speech. Overt speech generation, overt repetition of heard speech, oral reading, and overt picture naming are rarely used in fMRI investigations, despite the importance of these kinds of tasks in linguistics, psycholinguistics, aphasiology, and everyday life.
Perhaps this is not a problem. Results obtained during silent speaking could be extrapolated rather directly to the problem of understanding overt speaking if the neuronal networks of speech production were organized in a straightforward hierarchical fashion. Suppose, for example, that overt speech equals silent speech plus an optional motor execution process that can be turned on or off as needed without much altering the rest of the system or its operation. This idea is appealing in its simplicity, but it may be wrong. A direct comparison of cortical activation during four tasks, silent vs. overt word reading and silent vs. overt picture naming, by Bookheimer et al. [1995] using positron emission tomography (PET) found complex differences among the four tasks. These differences defied description in terms of either a simple hierarchical relation between silent and overt speaking or even a single final cortical motor pathway held in common by overt reading and overt picture naming. The findings of Bookheimer et al. [1995] make it an empirical question to what extent “the little voice in the head” shares neural substrate with speaking out loud.
One widely‐studied example of “the little voice in the head” is verbal rehearsal in working memory, the so‐called “phonological loop” [Baddeley, 1986, 1992; Baddeley et al., 1998]. Neuroimaging studies of verbal working memory identify neural circuitry including regions of dorsolateral prefrontal cortex, parietal cortex, and temporal cortex that, though left‐lateralized to a significant extent and sometimes also including Broca area, bears little resemblance to classical conceptions of the language areas of the brain required for overt speech [Jonides et al., 1997; Postle et al., 1999; Smith and Jonides, 1999]. Furthermore, aphasic patients often complain that the words they speak bear a poor correspondence to the words they think and intend to say [Marshall et al., 1994, 1998]. Because these complaints can arise in the absence of specifically motoric involvements such as dysarthria and speech apraxia, they suggest dissociations between silent and overt speech that are more profound than motor distortion at the output end of an otherwise similar series of neural events. Thus it would be quite valuable both theoretically and practically to apply fMRI to comparisons of silent and overt speech in neurologically normal language users and aphasics. These goals cannot be pursued if overt speech cannot be imaged because of motion artifact.
Several sources of artifact need to be considered. During speaking, people tend to nod or bob their heads, producing movement in the sagittal plane that can induce false signal changes correlated with the language task [Hinke et al., 1993; Yetkin et al., 1995]. In addition, muscles of the mouth, lips, tongue, jaw, and face are moved, which can disturb the B0 magnetic field, changing the phase and intensity of MR signals in the field of view even if the muscle movements are actually occurring outside the field of view [Birn et al., 1998].
In block‐design paradigms, with no way to separate influences arising on one trial from influences arising on the next few trials within a block, true BOLD signals that emerge over several seconds after speaking each word are contaminated by false signal changes caused by head and vocal‐tract movements while speaking the following few words. As a consequence, it is quite difficult to differentiate true BOLD signal changes from false positive signals in a block‐design study.
Progress can be made by switching to single‐trial or event‐related fMRI (ER‐fMRI). In ER‐fMRI, each trial begins with performance of the task. Task performance is followed by an extended period of rest that allows the hemodynamic response function (HRF) to develop to its maximum and return to baseline before the next trial begins. In such a paradigm, a false signal change caused by head or vocal‐tract movement while speaking is likely to occur quite early in the trial timeline. The hemodynamic response to the neural activity that creates the speaking is delayed, not rising significantly above baseline for 2–4 sec and not reaching its peak until 5–7 sec after speaking. Birn et al. [1999] demonstrated the possibility of using the different temporal profiles of the movement‐induced signal vs. the HRF to discriminate motion‐induced false positives from true BOLD signal changes. This study established the potential for studying overt speech paradigms with event‐related fMRI. Now, it is essential to try to develop, evaluate, and eventually standardize a feasible and effective experimental protocol and image processing strategy to improve the quality and reliability of functional images to support wider employment of fMRI in the study of overt speech. The present study takes a step toward this goal.
We combined ER‐fMRI methodology with a set of techniques for motion reduction, detection, and correction to further investigate overt speech and compare it to silent speech. The purpose of the study was two‐fold. We aimed to test a multiple‐step image processing protocol involving discrimination and separation of motion‐induced signals from activation‐induced signals and we aimed to use this multi‐step image processing protocol to compare the similarity of activation of cortical pathways potentially relevant to language production during silent and overt speech, focusing on Broca area and primary motor cortex as test cases. If the problem of motion artifact can be handled effectively, then the spatial resolution of fMRI relative to PET, and ER‐fMRIs advantages relative to block‐design fMRI for tracing the intra‐trial temporal dynamics of activation, can add greatly to the tools available to investigate human language.
MATERIALS AND METHODS
Subjects
Seven normal right‐handed native English speakers (4 male, 3 female, age from 20–35 years) participated in the study, whose procedures were approved by the University Committee on Research Involving Human Subjects at Michigan State University. Handedness was assessed by the Edinburgh Inventory [Oldfield, 1971], and status as a native speaker of English was self‐professed. Before this study, written informed consent was obtained from all subjects.
Paradigms
Each subject performed four language paradigms, each during a separate functional scan: 1) silently naming a visually‐presented letter of the alphabet; 2) overtly naming a visually‐presented letter; 3) silently generating an animal name starting with a given visually‐presented letter; and 4) overtly speaking an animal name starting with a given visually‐presented letter. The two letter‐naming paradigms were always administered before the two cued animal‐name‐generation paradigms. The orders of performance between silently and overtly naming a letter and between silently and overtly generating an animal name were counter‐balanced across subjects. Two groups of letters, each consisting of 13 letters without duplication between the groups, were used for the study. Construction of these groups began by eliminating nine letters for which two pre‐test subjects found it difficult to generate animal names (I, K, N, Q, U, V, X, Y and Z). The remaining 17 letters were divided into two groups with nine in one group and 8 in the other. Four letters in the first group and five letters in the second group were presented twice each (for these letters pretesting showed it was easy to generate more than one animal name). During each functional scan, one of the resulting groups of 13 letters was presented to a subject in a random order, using Integrated Functional Imaging Systems (Psychology Software Tools, Inc.). Each letter was displayed for 1 sec, followed by a 31 sec long fixation point. The subject was asked to perform one of the four tasks immediately when a letter was presented, and then to remain still until the next letter appeared. Silent and overt speech tasks were always carried out by using different groups of letters, and assignment of letters to tasks was counter‐balanced across subjects. No subject reported any trouble in generating animal names in response to a post‐scan inquiry.
Before functional scanning, every subject received a training session in the magnet. The subject's head was padded by foam to reduce lateral movement and restrained by a piece of tape across the forehead to reduce sagittal movement. During training, the subject lay on the scanner bed and practiced holding his or her head still while speaking letter names and words overtly, until no obvious head movement was noticed by the experimenter.
MRI
Sagittal T2* weighted functional images of the whole head were acquired with a gradient echo Echo‐Planar‐Imaging pulse sequence on an NV/i 1.5 T clinical scanner (General Electric Medical Systems). Flip angle was 90° and TR/TE were 2,000/50 msec. Field‐of‐view (FOV) was 240 mm with a 64 × 64 image matrix, yielding an in‐plane resolution of 3.75 × 3.75 mm. Slice thickness was 7 mm. Because of the image volume's anisotropic spatial resolution, uncertainty for correcting in‐plane motion (in the higher‐resolution direction) was smaller than for out‐of‐plane motion (in the lower‐resolution direction). Therefore, anticipating that the largest task‐correlated motion was likely to be caused by head‐nodding, the sagittal plane was chosen for image acquisition. During each paradigm, a total of 208 image volumes were acquired. The first 16 image volumes acquired during the first (dummy) trial were discarded, yielding 192 functional image volumes for analysis.
T1 weighted images were acquired at the same anatomical locations as the functional images with a spin‐echo pulse sequence with 24 cm FOV, 256 × 192 matrix size, 7 mm slice thickness, and TR/TE = 500 msec/14 msec. Three‐dimensional volumetric images with voxel size 0.94 × 0.94 × 1.2 mm3 were also obtained, using a fast RF‐spoiled gradient‐echo pulse sequence.
Data Analysis
Head motion detection and correction
Functional images were assessed and corrected for possible in‐plane translations and rotations of the head [Cao et al., 1993]. For each slice, each image in the series was registered with the first image in the analyzed set of 192 images by applying a range of test transformations consisting of planar translations and rotations. The first image was subtracted, voxel‐by‐voxel, from the transformed image, and the summation of the absolute difference between the two images was computed. The transformation that minimized the summation was selected as the optimal correction for the subject's head movement. The magnitudes of the required optimal corrections were compared between silent and overt conditions.
Baseline correction
For each image series, the signal intensity time course was corrected for possible slow baseline drifts using 0, 1st, and 2nd order polynomials. After baseline correction, the signal intensity time course for each voxel was normalized to allow signal averaging over voxels and across subjects. For each voxel, the averaged absolute signal intensity over the time course was normalized to a constant but the percentage signal changes were maintained. This normalization removed the influence of voxel‐by‐voxel differences in absolute signal intensities in an average.
Assessment of articulatory motion
During overt speaking, muscles of the mouth, lips, tongue, jaw, and face move briefly. This articulatory motion ought to cause MR signal intensity changes in these muscle areas, particularly around their edges, and might also cause signal intensity changes in the brain, particularly in brain areas closer to the moving muscles. The signal intensity changes caused by any physical motion in or out of the FOV should occur earlier than the delayed BOLD signal changes within the brain. This difference in expected time course was tested by analyzing signal changes arising within the vocal‐tract musculature. The resulting time‐course profiles were used to assess the effect of articulatory motion on cortical activation, as described in the next section.
Statistical analysis of activation
Considering that the shape of the BOLD HRF can vary substantially across cortical regions, a complex temporal cross‐correlation approach was used to identify significant activation in functional images [Bandettini et al., 1993; Lee et al., 1995]. Before statistical analysis, to reduce noise, functional images of the 12 individual trials included for analysis from each paradigm were reconstructed to yield a new time series. Each reconstructed time series contained four trials, each averaged across three trials from the original set of 12.1 To make the reconstructed time courses close to sine and cosine functions, the last four data points in each of these four trials were discarded, which yielded 48 data points in each new time series. After adjustments to compensate for the systematic differences across slices in their time of acquisition during each TR, the signal intensities of the new time series were cross‐correlated with sine and cosine functions having periodicity equal to the trial duration of 12 TRs. This yielded a pair of cross‐correlation coefficients (CCCs), from which a magnitude and phase were further calculated [Lee et al., 1995]. A threshold level of significance for the magnitude of the CCC equal to or greater than 0.46 was chosen to yield an estimated Type I error rate of P < 0.001/voxel. The estimation was made based upon a Gaussian distribution, which is similar to Bandettini's work [Bandettini et al., 1993]. Considering that comparisons are being done on a large number of voxels, and that signals from one voxel to the next cannot be assumed to be completely independent measures, choosing a voxel‐wise alpha level of P < 0.001 is sufficiently conservative to justify multiple comparisons in an image. A rapid signal increase or decrease after a stimulus presentation, caused by vocalization, would have a CCC phase near 90° or −90°. The time delay of the hemodynamic signal increase will shift the CCC phase to be smaller than 90° with 30° per TR (2 sec). Anticipating that the precise time delay and the shape of the time course of activated voxels might vary from one cortical region to another, the range of CCC phases for inclusion in the analysis of BOLD HRF was chosen between 75° and −75°. Voxels with CCC phases closer to +90° or −90° than these cutoffs were assumed to be contaminated by vocalization and were excluded.
After the analysis of CCC magnitude and phase identified the pool of apparently activated voxels, a further screening analysis was applied. The time series from each activated voxel was examined manually to determine whether the maximum increases in signal intensity occurred during the first 4 sec after stimulus presentation, the time during which motion‐induced signals would peak and fall. Any voxel that showed such an early increase in signal intensity was considered to be candidate for motion artifacts and was eliminated from further analysis.
Functional anatomic localization
The voxels that passed the thresholds for magnitude and phase of CCC and showed no significant early increase from baseline in the functional images were overlaid on the spin echo T1 weighted MR images after the threshold functional images were reformatted by voxel replication to match the resolution of spin echo T1 weighted MR images. A 3D volumetric set of integrated functional and anatomic images was obtained in a similar fashion, and displayed in orthogonal axial, sagittal and coronal planes using AFNI [Cox, 1996]. Then, each activated voxel was localized to its specific anatomic location in each individual hemisphere by comparing the integrated volumetric images with a brain atlas of computerized images [Damasio, 1995].
Regions of interest analysis
A quantitative assessment of activated tissue volumes was made in three cortical regions of the left and the right hemispheres as shown in Figure 1. One region was Broca area, including the anterior half of Brodmann Area (BA) 44, and the posterior two‐thirds of BA 45 in the left hemisphere [ Kandel and Schwartz, 1985], and its homologous opposite in the right hemisphere (referred to as Broca right homologue). The other regions of interest (ROI) divided the middle‐inferior portion of the precentral gyrus into two areas generally thought to be involved in the control of vocalization [Geschwind, 1979; Ghez et al., 1991; Martin et al., 1992; Ojemann, 1979; Penfield and Roberts, 1959]. The more superior of these two ROIs covered approximately one‐third of the precentral gyrus in its middle‐inferior part. The classic “motor humunculus” identified by electrical stimulation [Penfield and Roberts, 1959] assigns to this region control of the face, mouth, and lips. Neuroimaging work by Cao et al. [1993] found this region activated during side‐to‐side tongue movements, suggesting that more interior portions of the vocal tract than the lips might also be controlled by this portion of primary motor cortex (PMC). Therefore we refer to this ROI as the “mouth, lips, and tongue” region of PMC, or MLT‐PMC. Ojemann et al. [1979] found that electrical stimulation in this region disrupted vocalization in 44% of tested epilepsy patients undergoing pre‐surgery functional mapping. The remaining ROI covered the most inferior portion of the precentral gyrus above the Sylvian fissure, extending from the point of maximum curvature at the edge of the fissure upward 10 mm. Penfield and Roberts motor humunculus assigns control of the tongue and jaw to this region [Penfield and Roberts, 1959], but the Cao et al. tongue‐movement experiment did not find activation to extend to this inferior portion of PMC [Cao et al., 1993]. Thus the anatomical correspondence of this region may be open to debate. Nevertheless, Ojemann et al. [1979] electrical cortical stimulation in this region produced disruption of vocalization in 79% of tested patients. Furthermore, this portion of PMC is immediately posterior to Broca area, suggesting that it could provide integration of motor control signals and communication between Broca area and more superior regions of PMC. We chose to refer to this ROI in generic terms as the “inferior vocalization” region of PMC, or IV‐PMC, to avoid commitment on the question of specific anatomical correspondence while acknowledging this region's importance to speaking. Our hope was that together, these ROIs, MLT‐PMC and IV‐PMC in the left hemisphere and their homologues in the right hemisphere, would include the most vocalization‐relevant structures in PMC.
Figure 1.
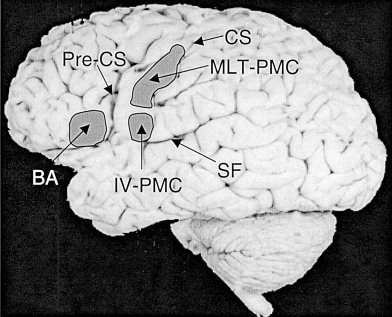
Topographically illustrates the three regions of interest, the Broca area (BA), the “mouth, lips, and tongue” region of the primary motor cortex (MLT‐PMC), and the “inferior vocalization” region of the primary motor cortex (IV‐PMC). CS, central sulcus; Pre‐CS, precentral sulcus; SF, Sylvian fissure.
Activated volumes in the three cortical ROIs in each hemisphere were calculated and compared between the silent and overt paradigms. These comparisons were done separately for letter naming and cued animal‐name generation. In addition, we calculated the area under a representative HRF within each ROI in each paradigm as a measure of amount of activation and compared them between the silent and overt paradigms in the same way. For the analysis of area under the HRF, we chose within each ROI the most activated cluster containing three contiguous activated voxels that was located near the center of the region of interest, which then served as a mask for that ROI in analyzing data from both the silent and the overt paradigms. As will be seen, Broca area was activated to its greatest degree in the silent paradigms rather than in the overt paradigms, whereas MLT‐PMC and IV‐PMC were activated substantially more in the overt paradigms than in the silent paradigms. Thus the masks in Broca area and its right homologue were delineated from the silent paradigms, whereas the masks in MLT‐PMC and IV‐PMC were delineated from the overt paradigms. An average HRF over the voxels within each mask was derived for each paradigm. The area under the resulting BOLD response curve was calculated by a sum of differences between the signal intensities at each point and the baseline intensity defined by the mean of the five points in the tail of the curve. A two‐tailed paired t‐test was used to test for a difference between the silent and overt conditions.
RESULTS
Head Motion Detection
In all seven subjects, in‐plane (sagittal) rotations but no translations were detected in images obtained during both silent and overt speaking conditions. For four subjects the detected rotations were less than 1° in all conditions. In the other three subjects, head rotation greater than 1° but smaller than 1.5° was detected in some images (<1% of the total number of images). These 1.0–1.5° rotations were found during overt animal‐name generation in all three of these subjects, during silent animal‐name generation in two of these three, and during overt letter‐naming in one subject. Thus none of the observed head movements were extreme, and even the larger ones were not strongly task‐dependent. Head rotation appears to vary more from subject to subject than as a function of task.
Assessment of Articulatory Motion
Signal intensity changes as large as 70% were observed in some voxels of the tongue and throat in the overt conditions, presumably induced by articulatory motion during overt speaking. A typical time course of the signal change in the tongue during overt speaking of a letter name is shown in Figure 2a (dashed line). For comparison, a typical time course of BOLD signal change in the left MLT‐PMC of the same subject under the same condition is also plotted in Figure 2a (solid line). The magnitude of the BOLD signal change was approximately 1.5%. Unlike the BOLD signal changes exhibiting at least 4 sec delay, the sharp signal changes induced by articulatory motion occurred during and right after speaking and quickly returned to baseline when motion ceased. Figure 2b shows the signal changes of the BOLD response and articulatory motion averaged over repeated trials.
Figure 2.
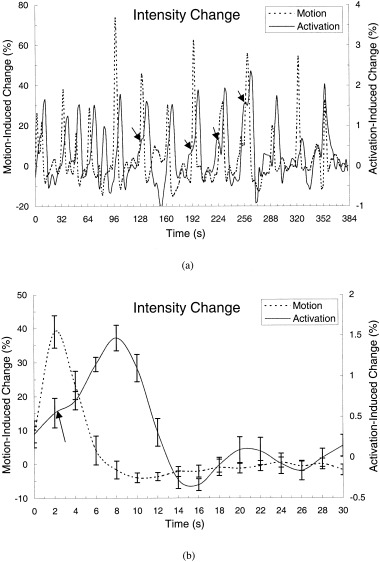
The time course of signal changes in a voxel of the primary motor cortex of a subject during 12 trials of speaking a letter overtly is plotted in panel a (solid line). For comparison, the time course of signal changes obtained in a voxel near the mouth during the same task in the same subject is also plotted (dashed line). Note that the BOLD signal changes occur 4–6 sec after the signal changes induced by articulatory motion. Also, the magnitude of the BOLD signal changes at peak response is approximately 1.5%, whereas the motion‐induced signal changes vary from 30–70%. Within the first 6 sec of each trial, there was no spike‐like signal change in the time course of the BOLD responses. In some of trials, e.g., Trials 5, 7, 8, and 9, there was a noticeable shoulder‐like signal increase (see arrows). The average time courses of the BOLD responses and articulatory motion averaging over the 12 repeated trials (a) are plotted in (b). Again, the peak of the BOLD response occurs 6 sec after the peak of signal changes induced by articulatory motion. Error bars = SEM.
The different temporal profiles of the signal changes evoked by neuronal activity and articulatory motion enabled us to assess whether functional signals within the brain were contaminated by articulatory motion. In general, voxels within the brain that passed the activation thresholds did not show any significant signal intensity changes within the first 4 sec (2 TRs) of the trial (Fig. 2a,b), though shoulder‐like intensity changes in the first 4 sec of the trial were observed in some individual trials (solid line, Fig. 2a). When examining the average time courses that passed the activation thresholds, no significant changes within the first 4 sec were observed in the left and right MLT‐PMC (Fig. 3), the left and right IV‐PMC (Fig. 4), the supramarginal and angular gyri, the posterior superior temporal gyrus, the middle temporal gyrus, or Broca area and its right homologue. During the ROI analysis of Broca area and its right homologue, however, a rapid signal decrease within the first 4 sec was observed in two subjects during overt animal‐name generation (see Fig. 5b). In both subjects, voxels within the masks, delineated during silent animal‐name generation, were identified as decreasing in activation during overt animal‐name generation. Because these two subjects contributed to the subject‐average time courses of the BOLD signals shown in Figure 5b, there is a small dip early in the animal‐name‐generation time course functions for Broca area and its right homologue that is not observed in any other condition.
Figure 3.
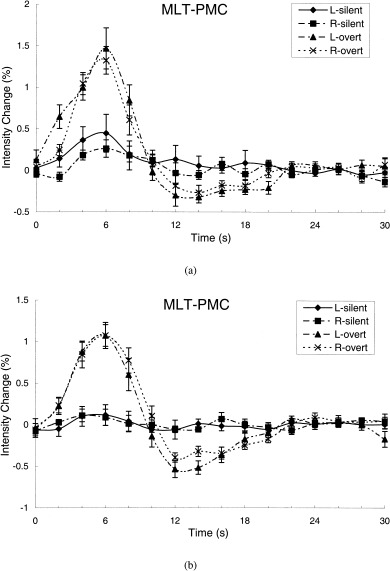
The average time courses of signal intensity changes over subjects in the left and right of the “mouth, lips, and tongue” region of the primary motor cortex obtained from the ROI analysis during speaking a letter name silently and overtly (a), and during generating an animal name silently and overtly (b). The ROI masks were delineated from the most activated clusters in the overt conditions. L, left; R, right.
Figure 4.
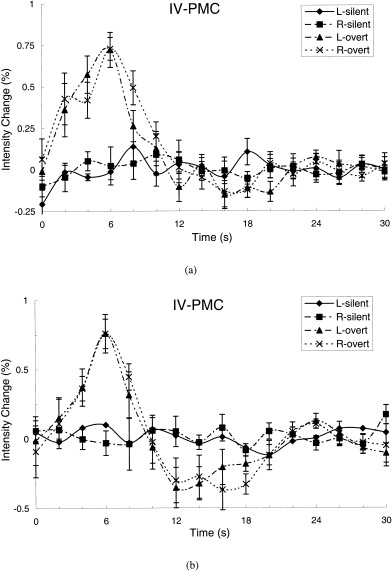
The average time courses of signal intensity changes over subjects in the left and right of the “inferior vocalization” region of the primary motor cortex obtained from the ROI analysis during speaking a letter name silently and overtly (a), and during generating an animal name silently and overtly (b). Note that the magnitudes of the BOLD responses were approximately 50% less than ones observed in the “mouth, lips, and tongue” region of the primary motor cortex during the same tasks (Fig. 3). The ROI masks were delineated from the most activated clusters in the overt conditions. L, left; R, right.
Figure 5.
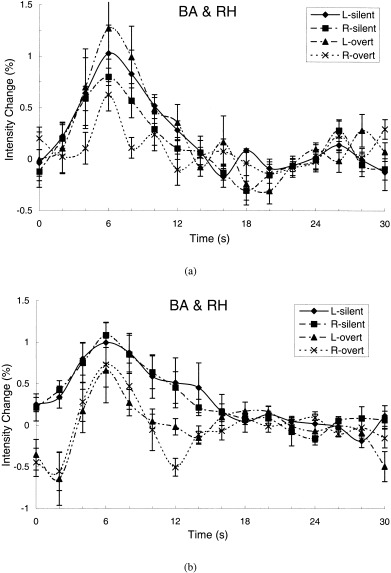
The average time courses of the signal intensity changes over subjects in Broca area and its right opposite homologue obtained from the ROI analysis during speaking a letter name silently and overtly (a), and during generating an animal name silently and overtly (b). Overtly speaking a letter name increased activity in Broca area but decreased activity in the right homologous region, compared to silently speaking a letter name (a). Conversely, overtly generating an animal name decreased activity in both Broca area and its right homologue (b). Note that the magnitude of the BOLD signal changes was small and the line‐width was narrow during overt animal‐name generation, compared to during silent animal‐name generation (b). The dip within the first 2 sec of the trial was artificial and possibly caused by articulatory motion. The ROI masks were generated from the most activated clusters in the silent conditions. L, left; R, right.
Activation Patterns
Both silent and overt speech activated widespread neuronal networks. Several activated cortical regions were common to all four speech paradigms. These included the supplementary motor area, lateral premotor area, anterior and posterior cingulate gyrus, supramarginal and angular gyri, superior parietal lobule, posterior superior temporal gyrus, middle temporal gyrus, insula, and occipital lobe. A marked difference as a function of task was observed in MLT‐PMC, which was activated bilaterally during both overt speech tasks, but was not activated above baseline during silent speech (Fig. 6). A similar pattern occurred in IV‐PMC (Fig. 6). We note in passing that an opposite pattern was observed in the middle frontal gyrus, where activation was substantial during the two silent paradigms, especially in the left hemisphere, but much less apparent during the two overt tasks. Finally, Broca area and Broca homologue produced a more complex response characterized by an interaction between silent vs. overt speaking and naming a letter vs. generating an animal name.
Figure 6.
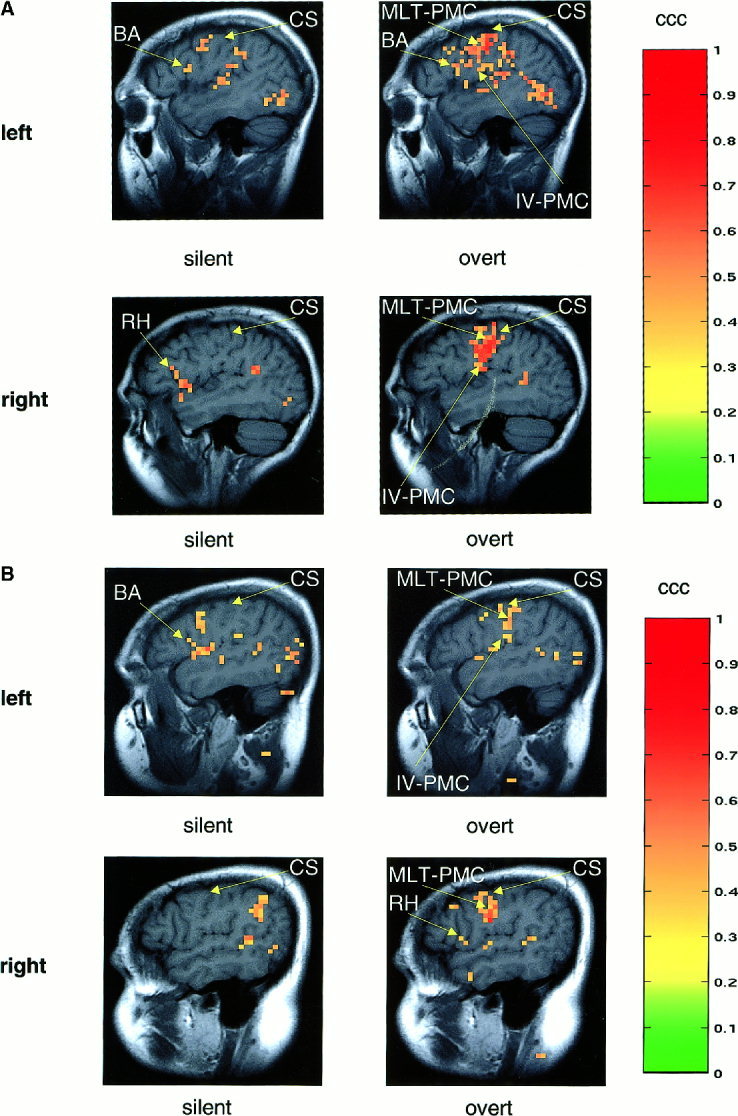
(a) Typical activation patterns obtained during silently speaking a letter name (two left panels), and overtly speaking a letter name (two right panels). Broca area was activated in both silent and overt condition, but with a large extent in the overt condition (right, top panel). The middle‐inferior potion of the primary motor cortex (PMC) was activated bilaterally during overtly speaking a letter name, but not during silently speaking a letter name. (b) Typical activation patterns observed during silently generating an animal name (two left panels) and overtly generating an animal name (two right panels). Note that Broca area was not activated during overt animal‐name generation (right, top panel), but activated to a large extent during silent animal‐name generation (left, top panel). The “mouth, lips, and tongue” region of the primary motor cortex was activated bilaterally during overt speech, but not during silent speech. In addition, overt speech activated the left most inferior portion of the primary motor cortex, and the activated cluster was disconnected from one in the middle portion of the primary motor cortex (right, top panel). MLT‐PMC, the “mouth, lips, and tongue” region of the primary motor cortex; IV‐PMC, the “inferior vocalization” region of the primary motor cortex; CS, central sulcus; BA, Broca area; RH, right homologue of Broca area.
Activation in MLT‐PMC
During both overt speech tasks, robust activation was observed in the left and right middle portions of the pre‐central gyrus, regions of PMC thought to control the musculature of the mouth, lips, tongue, and face (Figs. 3, 4). Conversely, the primary motor cortex was hardly activated during the two silent speech paradigms (Figs. 3, 4). The striking difference in activation between the overt and silent conditions was reflected in both the spatial extent of activation and the magnitude of the BOLD signals. In six of the seven subjects, the activated volumes in both left and right MLT‐PMC during the overt conditions were greater than during the silent conditions, resulting in a significant difference as a group (Table I). During overt letter naming, the average signal intensity change at peak response in left MLT‐PMC was 1.5%, compared to 0.5% during silent letter naming (Fig. 3a). These average peak signal intensity changes were significantly different (P < 0.003, paired t‐test). The corresponding peak signal intensity changes in right MLT‐PMC were 1.3% and 0.2% respectively, which also differed significantly (P < 0.001, paired t‐test). During overt animal‐name generation, the peak signal intensity change was 1.1% in both the left and the right MLT‐PMC (Fig. 3b), whereas the peak signal change during silent animal‐name generation was 0.1%. Again, these differences between overt and silent performance were significant (P < 0.01). After the peak response was reached during overt speaking, the BOLD responses in both left and right MLT‐PMC decreased to a negative value before returning to the baseline. The magnitude of this “overshoot” did not differ between left and right MLT‐PMC, but it did depend on task. The overshoot was −0.6% during overt animal‐name generation, larger than the overshoot of −0.3% observed during overt letter naming.
Table I.
Activated volume in the primary motor cortex*
| Silent | Overt | Difference(S vs. O) | Paired t | P | Silent | Overt | Difference (S vs. O) | Paired t | P | ||
|---|---|---|---|---|---|---|---|---|---|---|---|
| Letter name | |||||||||||
| L MLT‐PMC | 0.71 ± 0.29 | 17.86 ± 3.71 | −17.15 ± 3.90 | −4.395 | 0.005 | L IV‐PMC | 0.71 ± 0.36 | 4.57 ± 1.19 | −3.86 ± 1.37 | −2.815 | 0.031 |
| R MLT‐PMC | 2.29 ± 1.67 | 14.57 ± 4.22 | −12.29 ± 4.04 | −3.041 | 0.023 | R IV‐PMC | 0.86 ± 0.46 | 6.14 ± 1.72 | −5.29 ± 1.52 | −3.470 | 0.013 |
| Difference (L vs. R) | −1.57 ± 1.78 | 3.28 ± 3.74 | xx | xx | xx | Difference (L vs. R) | −0.14 ± 0.70 | −1.57 ± 1.32 | xx | xx | xx |
| Paired t | −0.881 | 0.879 | xx | xx | xx | Paired t | −0.203 | −1.186 | xx | xx | xx |
| P | 0.41 | 0.41 | xx | xx | xx | P | 0.85 | 0.28 | xx | xx | xx |
| Animal name | |||||||||||
| L MLT‐PMC | 3.29 ± 1.30 | 18.71 ± 3.41 | −15.43 ± 3.14 | −4.916 | 0.003 | L IV‐PMC | 0.43 ± 0.30 | 4.29 ± 0.89 | −3.86 ± 0.91 | −4.234 | 0.005 |
| R MLT‐PMC | 2.14 ± 1.08 | 17.57 ± 3.21 | −15.43 ± 2.65 | −5.815 | 0.001 | R IV‐PMC | 1.00 ± 0.72 | 3.71 ± 0.87 | −2.71 ± 0.87 | −3.138 | 0.02 |
| Difference (L vs. R) | 1.15 ± 0.1.58 | 1.14 ± 4.06 | xx | xx | xx | Difference (L vs. R) | −0.57 ± 0.53 | 0.57 ± 1.49 | xx | xx | xx |
| Paired t | 0.723 | 0.281 | xx | xx | xx | Paired t | −1.082 | 0.382 | xx | xx | xx |
| P | 0.50 | 0.79 | xx | xx | xx | P | 0.32 | 0.72 | xx | xx | xx |
Mean values of the numbers of activated voxels and standard errors of the means are listed. The size of one voxel is 3.75 × 3.75 × 7 = 98.4 mm3. MLT‐PMC, the “mouth, lips, and tongue” region of the primary motor cortex; IV‐PMC, the “inferior vocalization” region of the primary motor cortex; L, left; R, right; S, silent; O, overt. The difference is the mean of individual differences between the two conditions (not a difference of the two means).
Activation in IV‐PMC
The inferior portion of the PMC posterior to Broca area and immediately superior to the Sylvian fissure was profoundly activated during the two overt tasks, but unactivated during the two silent paradigms (Fig. 4a,b). This difference between overt and silent speaking was significant in both activated volume and magnitude of the signal change (Table I, Fig. 4). Although the pattern of IV‐PMCs activation was quite similar to that of MLT‐PMC, its extent and magnitude were only about half as great (Figs. 4, 6). This was true of negative overshooting as well as positive activation. In the IV‐PMC, significant overshoot was observed during overt animal‐name generation, but not during overt letter naming.
Activation in Broca Area and Broca Homologue
Activation patterns in these areas were complex, differing as a joint function of both overt vs. silent speech and letter naming vs. animal‐name generation.
During letter naming, Broca area was activated in both the overt and the silent condition (Figure 5a, Table II). The tissue volume activated in the overt condition was significantly greater than in the silent condition (P < 0.04, paired t‐test, Table II). The area under the average BOLD response curve was somewhat greater in absolute size in the overt condition than in the silent condition, but this difference was small and not significant (Table III, Fig. 5a). The right homologue of Broca area was also activated in both the overt and the silent condition. Activated tissue volume was approximately equal to the activated volume in Broca area during overt letter naming, but the areas under the average BOLD response curves were smaller (Fig. 5a, Table III), particularly during overt letter naming, where the hemisphere difference was significant (P = 0.037, paired t‐test). Thus the magnitude of the signal change was smaller in the right hemisphere than in the left (Fig. 5a, Table III). There was no negative overshooting observed in these regions in either the overt or the silent conditions.
Table II.
Activated volume in Broca area and its right homologue*
| Silent | Overt | Difference(S vs. O) | Paired t | P | |
|---|---|---|---|---|---|
| Letter name | |||||
| B Area | 2.14 ± 1.22 | 5.86 ± 1.99 | −3.17 ± 1.41 | −2.635 | 0.04 |
| R Homo | 5.00 ± 2.65 | 4.71 ± 2.01 | 0.29 ± 3.04 | 0.094 | 0.93 |
| Difference (L vs. R) | −2.86 ± 2.86 | 1.14 ± 2.60 | xx | xx | xx |
| Paired t | −1.000 | 0.44 | xx | xx | xx |
| P | 0.36 | 0.68 | xx | xx | xx |
| Animal name | |||||
| B Area | 5.29 ± 3.39 | 0.14 ± 0.14 | 5.14 ± 3.43 | 1.501 | 0.18 |
| R Homo | 4.57 ± 2.16 | 2.29 ± 0.78 | 2.29 ± 1.82 | 1.255 | 0.26 |
| Difference (L vs. R) | 0.71 ± 2.65 | −2.14 ± 0.70 | xx | xx | xx |
| Paired t | 0.269 | −3.041 | xx | xx | xx |
| P | 0.80 | 0.023 | xx | xx | xx |
Mean values of the numbers of activated voxels and standard errors of the means are listed. The difference of the activated volumes between the two conditions was calculated for each subject. The means of differences across subjects are given in the table. The size of one voxel is 3.75 × 3.75 × 7 = 98.4 mm3. B Area, Broca area; R Homo, right homologue opposite to Broca area.
Table III.
Area under the BOLD response curve*
| Silent | Overt | Difference(S vs. O) | Paired t | P | |
|---|---|---|---|---|---|
| Letter name | |||||
| B Area | 63.85 ± 15.99 | 77.71 ± 27.38 | −13.87 ± 15.27 | −0.908 | 0.43 |
| R Homo | 45.67 ± 12.72 | 21.58 ± 11.66 | 24.09 ± 8.54 | 2.8201 | 0.037 |
| 2‐sample t | 0.890 | 1.886 | xx | xx | xx |
| P | >0.2 | 0.1 | xx | xx | xx |
| Animal name | |||||
| B Area | 89.31 ± 29.05 | 21.66 ± 19.17 | 67.65 ± 27.17 | 2.490 | 0.067 |
| R Homo | 82.99 ± 21.81 | 14.91 ± 18.21 | 68.08 ± 44.65 | 1.525 | 0.23 |
| 2‐sample t | 0.167 | 0.241 | xx | xx | xx |
| P | >0.5 | >0.5 | xx | xx | xx |
Mean areas under of the BOLD response curves and standard errors of the means are listed. The area was calculated by integrating the signal intensity change over time, resulting in a unit of (%) × (second). The difference of the areas between the two conditions was calculated for each subject. The means of differences over subjects are given in the table. B Area, Broca area; R Homo, right homologue opposite to Broca area.
The most striking aspect of the data from letter naming, however, cannot be appreciated from the description given so far. It consists of a crossover interaction between hemisphere and overt vs. silent speech, visible in Figure 5a. Compared to silent letter naming, overt letter naming increased activation in Broca area and decreased activation in its right homologue. Thus speaking aloud rather than to oneself shifted dominance toward the left hemisphere in this examination of Broca area and its right homologue.
Silent animal‐name generation activated both Broca area and its right homologue to a large extent, compared to overt animal‐name generation. The difference in activation between overt and silent animal‐name generation was greater in Broca area than in its right homologue, as was also the case during letter naming. The direction of the change during animal‐name generation, however, was opposite to that observed in letter naming. The largest area under the average BOLD response curve and the largest activated tissue volume occurred in Broca area during silent speech rather than overt speech (Fig. 5b, Tables II, III). There was little activated volume detected in Broca area during overt animal‐name generation, in six of seven subjects no activation was detected by the complex cross‐correlation analysis (Table II), whereas the ROI analysis picked up small activation‐evoked BOLD signals in two subjects (Fig. 5b). In two other subjects, the ROI analysis picked up the negative signal changes that occurred during the first four seconds after stimulus presentation and returned to the baseline rapidly thereafter. During silent animal‐name generation, the mean activated tissue volume in Broca area increased in absolute size as did the mean area under the BOLD response curve. Both of these increases were highly variable across subjects, however, and only the increase in area under the average BOLD response curve approached significance (P = 0.067, paired t‐test, Table III).
In summary, activation in Broca area and its right homologue decreased during overt generation of an animal name relative to silent generation. This difference was opposite to that observed in letter naming, where activation increased in the overt condition relative to the silent condition.
DISCUSSION
Functional MR images are susceptible to several sources of motion‐induced artifact. Head motion can cause spatial misalignment between images in a time series. Head and vocal tract motion can cause changes in the phase and intensity of MR signals. Artifacts from vocal tract motion can arise even when the FOV does not include the mouth, tongue, or throat, because an object moving outside of the FOV can disturb the B0 magnetic field and consequently alter the phase and intensity of signals originating within the FOV [Birn et al., 1998]. Speaking aloud, no doubt, will produce motion artifacts in MR images.
In this study, we attempted to investigate whether in MRI‐naïve subjects, articulatory motion could be controlled to a manageable level, meaning that the amount of articulatory motion could be limited and the false signal changes could be detected and discriminated from BOLD activation. We found that with a training session before scanning, motion artifacts induced by head movement while speaking could be limited, with only small rotations of the head in the sagittal plane observed. During overt speech, detected head movement, although perhaps increased slightly in some subjects, was never substantially worse than the head movement detected during silent speech. Moreover, most subjects showed approximately the same distribution of head‐motion artifact during silent speech as during overt speech, indicating that under the training conditions and task demands we examined, head motion was more subject‐dependent than task‐dependent. Image registration algorithms were able to correct for the level of rotation‐induced misalignment we observed.
After image registration, the remainder of our image processing strategy was applied, consisting of baseline correction, a complex cross‐correlation with a joint threshold based on both magnitude and phase of signal change, and a test for significant signal changes early in the trial timeline during the first two TRs after stimulus presentation. Results indicated that false activation due to articulatory motion occurred mainly outside of the brain, in the muscles of the tongue, throat, and lower portion of the face. In these areas, signal intensity changes arose directly from a muscle or head movement during speaking. The same movements could also cause artifacts within the brain in an indirect way, probably via B0 magnetic field disturbances [Birn et al., 1998]. Such signal changes, however, identified by rapid rise and decline within the first 2–4 sec after stimulus presentation, appeared to be restricted to a relatively small numbers of voxels in subcortical and inferior cortical brain regions. We examined the time courses of MR signals during overt speaking in activated cortical regions across the brain. In the middle frontal gyrus, insula, superior temporal gyrus, the left and right supramarginal gyrus, and our two ROIs in PMC, we did not observe any statistically significant signal changes within the first 4 sec after stimulus presentation, while articulatory motion was actually taking place and immediately thereafter. In Broca area and its right homologue of two subjects, however, negative signal changes within the first 4 sec were detected by the ROI analysis but excluded by the complex cross‐correlation analysis. The signal decrease was possibly induced by head movement directly or by tongue and mouth movements indirectly. Voxels potentially contaminated in this way could be included in the analyses or excluded, depending on the image analysis strategy of the investigator. We chose to include them in the ROI analysis to keep the consistency of our chosen rules for comparison of signal intensity changes in silent conditions with signal changes in overt conditions. Our experiences suggest that the complex cross‐correlation analysis is easy for implementation, less sensitive to the precise geometric shape of the signal changes over time, and discriminates the temporal delay of the signal changes in an effective manner. Also, this technique can be combined with others, for example, modeling the motion time course.
A second focus of this study, beyond development of methods for identifying and correcting motion artifact, was to use these methods to assess the comparability of the language‐production‐related pathways involved in silent and overt speech. We observed strikingly different patterns of activation in this comparison.
The vocalization‐relevant areas of PMC, covered by the two ROIs we refer to as MLT‐PMC and IV‐PMC, were activated only during overt speech. In both of these motor areas activation was bilateral, consistent with known bilateral innervation of midline vocal‐tract musculature [Wise et al., 1999]. In some subjects, MLT‐PMC and IV‐PMC were activated separately, with intervening tissue not activated above baseline, whereas in other subjects the activated areas of MLT‐PMC and IV‐PMC merged together (Fig. 6). The magnitudes of the BOLD signals in IV‐PMC were approximately half those observed in MLT‐PMC, consistent with the possibility that the underlying functions of the two areas differ either in terms of specific anatomic correspondence or in terms of integration and communication vs. motor output, as we speculated in establishing our ROI analysis. These intensity differences, however, could also be related to differences in vascularization across PMC. Deciding among these possibilities awaits further research.
The pattern of task‐dependent activation observed in PMC is quite consistent with the idea that overt motor output is a process that can be turned on or off at will. The findings from Broca area and its right homologue show that when this is done, however, the rest of the speech production does not remain unaltered. Hence it is incorrect to view the neural substrates of silent and overt speech as the same up the execution of motor movements, and it is therefore inappropriate to use silent speech as a motion‐free substitute for overt speech in studies of language production. Beyond this straightforward implication, the results from Broca area and its right homologue raise several puzzles.
Historically, Broca area has been associated with motor planning and articulatory coding of speech output [Gazzaniga et al., 1998; Geschwind, 1979] and with syntactic processing [Caplan et al., 1998; Friederici et al., 2000; Gazzaniga et al., 1998]. In the present study, significant activation in Broca area was detected by both temporal cross‐correlation and ROI analysis while speaking either a letter name or an animal name silently. Although Broca area showed more activity in naming a letter overtly than in naming a letter silently, when the task was generating an animal name, however, Broca area actually showed less activity in speaking overtly than in speaking silently. These results suggest that if Broca area plays a role in phonological or articulatory coding, this role is not particular to overt production, that is, it is not tied specifically to motor output.
Though perhaps surprising, these outcomes are consistent with findings reported by previous PET and fMRI studies of speaking a word [Bookheimer et al., 1995; Hinke et al., 1993; Wise et al., 1999; Yetkin et al., 1995]. In a PET study by Wise et al. [1999] repeating a heard word did not activate Broca area relative to listening to a pair of heard words (a contrast intended to control for the presence of two auditory stimuli in the repetition condition, the stimulus to be repeated and the subject's own production). This same contrast, however, identified greater activation in primary motor cortex during repetition than during listening. In a PET study by Bookheimer et al. [1995], reading a word silently vs. aloud produced different activation patterns in Broca area, which were similar to our animal‐name‐generation condition in that activation was greater when reading silently than when reading aloud. Thus it seems clear that primary motor cortex is more important to overt speech than to silent speech. In contrast, it appears possible that Broca area is more closely associated with “the little voice in the head” or internal speech than it is with overt production. Alternatively, it is possible that the increased activation observed during silent speech represents that added burden of inhibiting output from Broca area to motor execution processes, output that might ordinarily be rather direct and automatic once the intention to speak has been implemented to the level of articulatory coding.
In response to their finding that repetition of single words did not activate Broca area relative to listening, Wise et al. [1999] concluded that Broca area was not involved in articulation. Our results suggest a similar conclusion, at least if by “articulation” one means overt speech. Demonet et al. [1992] have attributed Broca area activation to silent motor rehearsal, and Zatorre et al. [1992] suggested that Broca area was not specific to articulation‐related coding at all, but was instead specialized for phonological coding. In both of these studies, the task required perceptual discrimination of phonemic stimuli. Friederici et al. [2000] found that in comprehension tasks, activation in Broca area tends to be greater in reading than listening, suggesting that the more effort that must be devoted to phonological recoding and phonological analysis, the more involved Broca area becomes. This suggestion is consistent with work by Pugh et al. [1996] relating individual differences in the bilaterality of inferior frontal activation, Broca area and its right homologue, to individual differences in adoption of retrieval‐based vs. rule‐based strategies for spelling‐to‐sound translation during word recognition. Although puzzling and as yet hard to interpret in a conclusive way, these results converge on the proposition that Broca area is more involved in phonological processing for a variety of internal uses than it is specialized for speech output per se, and that managing the direct retrieval of stored phonological codes may be closer to its core specialization than application of more general linguistic rules.
Clearly much work remains to be done before the mysteries of Broca area are solved. Even the role of Broca area in producing Broca aphasia is not certain [Dronkers, 1996, 2000]. The complex activation patterns of Broca area suggest that overt speech does not equal silent speech plus a motor execution process although activation in the primary motor cortex is turned on or off according to whether speech is carried out overtly or silently. Somehow, whether the motor execution process is on or off interacts with the process or processes carried out by Broca area. Independently of the validity of the present speculations about Broca area and its relation to primary motor cortex and other speech‐relevant areas of frontal cortex, the techniques reported here for using fMRI to investigate overt speech seem quite promising. The problem of artifact induced by articulatory motion appears to be manageable through careful subject training and a series of reasonably straightforward data‐analysis procedures. If we are correct in this, then fMRI can be much more widely applied in the study of normal and pathological language than it has been to date.
ACKNOWLEDGMENT
This work was supported in part by American Heart Association Established Investigator Award (J.H. and Y.C.).
Footnotes
We explored four different ways to analyze activation in the event‐related fMRI data of two subjects. One was to use the original time course that contained 12 trials without averaging. The second approach was to average all 12 trials to one single trial time course. The third method was to reconstruct a new time course that contained four trails with each averaged over three trials. The forth one was similar to the third one except that the newly constructed time courses contained three trials with each averaged over four trials. Then, temporal cross‐correlation applied to the four different types of the time courses. We found that there was no noticeable difference between the third and forth methods. Compared to the first approach, however, the data generated by the third and forth methods showed improved signal‐to‐noise ratio and activation‐ (or contrast‐) to‐noise ratio due to averaging. When analyzing activation of one single trial time course that was averaged over 12 trails (the second approach), CCC became very sensitive to the precise shape of the reference function. Figures 3, 4, and 5 show that the line shapes of the BOLD responses varied greatly from region to region. Thus, a reference function that is tuned to match the line shape in one region can mis‐match the line shape in the others. This approach is highly susceptible to severe bias in analysis of activation. In light of these preliminary results, we chose the third approach.
REFERENCES
- Baddeley A (1992): Working memory. Science 255: 556–559. [DOI] [PubMed] [Google Scholar]
- Baddeley A, Gathercole S, Papagno C (1998): The phonological loop as a language learning device. Psychol Rev 105: 158–173. [DOI] [PubMed] [Google Scholar]
- Baddeley AD (1986): Working memory. Oxford: Oxford University Press; p 75–107. [Google Scholar]
- Bandettini PA, Jesmanowicz A, Wong EC, Hyde JS (1993): Processing strategies for time‐course data sets in functional MRI of the human brain. Magn Reson Med 30: 161–165. [DOI] [PubMed] [Google Scholar]
- Birn RM, Bandettini PA, Cox RW, Jesmanowicz A, Shaker R (1998): Magnetic field changes in the human brain due to swallowing or speaking. Magn Reson Med 40: 55–60. [DOI] [PubMed] [Google Scholar]
- Birn RM, Bandettini PA, Cox RW, Shaker R (1999): Event‐related fMRI of tasks involving brief motion. Hum Brain Mapp 7: 106–114. [DOI] [PMC free article] [PubMed] [Google Scholar]
- Bookheimer SY, Cohen MS, Dobkin B, Maziotta JC (1995): Functional MRI during motor activation following stroke In: First International Conference on Functional Mapping of the Human Brain, 1995. Paris: Academic Press; p 429. [Google Scholar]
- Bookheimer SY, Zeffiro TA, Blaxton T, Gaillard W, Theodore W (1995): Regional cerebral blood flow during object naming and word reading. Hum Brain Mapp 3: 93–106. [Google Scholar]
- Cao Y, Towle VL, Levin DN, Balter JM (1993): Functional mapping of human motor cortical activation by conventional MRI at 1.5 T. J. Magn Reson Imaging 3: 869–875. [DOI] [PubMed] [Google Scholar]
- Caplan D, Alpert N, Waters G (1998): Effects of syntactic structure and propositional number on patterns of regional cerebral blood flow. J Cogn Neurosci 10: 541–552. [DOI] [PubMed] [Google Scholar]
- Cox RW (1996): AFNI: software for analysis and visualization of functional magnetic resonance neuroimages. Comput Biomed Res 29: 162–173. [DOI] [PubMed] [Google Scholar]
- Damasio H (1995): Human brain anatomy in computerized images. New York: Oxford University Press. [Google Scholar]
- Demonet J‐F, Chollet F, Ramsay S, Cardebat D, Nespoulous J‐L, Wise R, Rascol A, Frackowiak R (1992): The anatomy of phonological and semantic processing in normal subjects. Brain 115: 1753–1768. [DOI] [PubMed] [Google Scholar]
- Dronkers NF (1996): A new brain region for coordinating speech articulation. Nature 384: 159–161. [DOI] [PubMed] [Google Scholar]
- Dronkers NF (2000): The pursuit of brain‐language relationships. Brain Lang 71: 59–61. [DOI] [PubMed] [Google Scholar]
- Friederici AD, Meyer M, von Cramon DY (2000): Auditory language comprehension: an event‐related fMRI study on the processing of syntactic and lexical information. Brain Lang 74: 289–300. [DOI] [PubMed] [Google Scholar]
- Gazzaniga MS, Ivry RB, Mangun GR (1998): Cognitive neuroscience: the biology of the mind. New York: Norton; p 289–321. [Google Scholar]
- Geschwind N (1979): Specializations of the human brain. Sci Am 241: 180–199. [DOI] [PubMed] [Google Scholar]
- Ghez C, Hening W, Gordon J (1991): Organization of voluntary movement. Curr Opin Neurobiol 1: 664–671. [DOI] [PubMed] [Google Scholar]
- Hinke R, Hu X, Stillman A, Kim SG, Merkle H, Salmi R, Ugurbil K (1993): Functional magnetic resonance imaging of Broca area during internal speech. Cogn Neurosci Neuropsychol 4: 675–678. [DOI] [PubMed] [Google Scholar]
- Jonides J, Schumacher EH, Smith EE, Lauber EJ, Awh E, Minoshima S (1997): Verbal working memory load affects regional brain activation as measured by PET. J Cogn Neurosci 9: 462–475. [DOI] [PubMed] [Google Scholar]
- Kandel ER, Schwartz JH (1985): Principles of neural science. 2nd Ed New York: Elsevier; p 1–17. [Google Scholar]
- Lee AT, Glover GH, Meyer CH (1995): Discrimination of large venous vessels in time‐course spiral blood‐oxygen‐level‐dependent magnetic‐resonance functional neuroimaging. Magn Reson Med 33: 745–754. [DOI] [PubMed] [Google Scholar]
- Marshall J, Robson J, Pring T, Chiat S (1998): Why does monitoring fail in jargon aphasia? Comprehension, judgment, and therapy evidence. Brain Lang 63: 79–107. [DOI] [PubMed] [Google Scholar]
- Marshall RC, Neuburger SI, Phillips DS (1994): Verbal self‐correction and improvement in treated aphasic clients. Aphasiology 8: 535–547. [Google Scholar]
- Martin N, Grafton S, Vinuela F, Dion J, Duckwiler G, Mazziotta J, Lufkin R, Becker D (1992): Imaging techniques for cortical functional localization. Clin Neurosurg 38: 132–165. [PubMed] [Google Scholar]
- Ojemann G (1979): Individual variability in cortical localization of language. J Neurosurg 50: 164–169. [DOI] [PubMed] [Google Scholar]
- Oldfield RC (1971): The assessment and analysis of handedness. The Edinburgh inventory. Neuropsychologia 9: 97–113. [DOI] [PubMed] [Google Scholar]
- Penfield W, Roberts L (1959): Speech and brain mechanisms. Princeton: Princeton University Press. [Google Scholar]
- Postle BR, Berger JS, D'Esposito M (1999): Functional neuroanatomical double dissociation of mnemonic and executive control processes contributing to working memory performance. Proc Natl Acad Sci USA 96: 12959–12964. [DOI] [PMC free article] [PubMed] [Google Scholar]
- Pugh KR, Shaywitz BA, Shaywitz SE, Constable RT, Skudlarski P, Fulbright RK, Bronen RA, Shankweiler DP, Katz L, Fletcher JM, Gore JC (1996): Cerebral organization of component processes in reading. Brain 119: 1221–1238. [DOI] [PubMed] [Google Scholar]
- Smith EE, Jonides J (1999): Storage and executive processes in the frontal lobes. Science 283: 1657–1661. [DOI] [PubMed] [Google Scholar]
- Wise RJ, Greene J, Buchel C, Scott SK (1999): Brain regions involved in articulation [see comments]. Lancet 353: 1057–1061. [DOI] [PubMed] [Google Scholar]
- Yetkin FZ, Hammeke TA, Swanson SJ, Morris GL, Mueller WM, McAuliffe TL, Haughton VM (1995): A comparison of functional MR activation patterns during silent and audible language tasks. Am J Neuroradiol 16: 1087–1092. [PMC free article] [PubMed] [Google Scholar]
- Zatorre RJ, Evans AC, Meyer E, Gjedde A (1992): Lateralization of phonetic and pitch discrimination in speech processing. Science 256: 846–849. [DOI] [PubMed] [Google Scholar]