

Abstract
Independent component analysis (ICA) is a technique that attempts to separate data into maximally independent groups. Achieving maximal independence in space or time yields two varieties of ICA meaningful for functional MRI (fMRI) applications: spatial ICA (SICA) and temporal ICA (TICA). SICA has so far dominated the application of ICA to fMRI. The objective of these experiments was to study ICA with two predictable components present and evaluate the importance of the underlying independence assumption in the application of ICA. Four novel visual activation paradigms were designed, each consisting of two spatiotemporal components that were either spatially dependent, temporally dependent, both spatially and temporally dependent, or spatially and temporally uncorrelated, respectively. Simulated data were generated and fMRI data from six subjects were acquired using these paradigms. Data from each paradigm were analyzed with regression analysis in order to determine if the signal was occurring as expected. Spatial and temporal ICA were then applied to these data, with the general result that ICA found components only where expected, e.g., S(T)ICA “failed” (i.e., yielded independent components unrelated to the “self‐evident” components) for paradigms that were spatially (temporally) dependent, and “worked” otherwise. Regression analysis proved a useful “check” for these data, however strong hypotheses will not always be available, and a strength of ICA is that it can characterize data without making specific modeling assumptions. We report a careful examination of some of the assumptions behind ICA methodologies, provide examples of when applying ICA would provide difficult‐to‐interpret results, and offer suggestions for applying ICA to fMRI data especially when more than one task‐related component is present in the data.Hum. Brain Mapping 13:43–53, 2001. © 2001 Wiley‐Liss, Inc.
Keywords: fMRI; functional, brain; visual; ICA; independent component analysis
INTRODUCTION
Independent component analysis (ICA), a method for recovering underlying signals from linear mixtures of those signals, draws upon higher‐order signal statistics to determine a set of “components” that are maximally independent of each other [Jutten and Herault, 1991; Comon, 1994]. When deriving these components, the data are separated into either spatially or temporally independent components; each choice yields a corresponding time course or component map.
ICA was originally developed to solve problems similar to the “cocktail party” problem in which many people are speaking at once [Bell and Sejnowski, 1995]. The ICA algorithm, assuming independence in time (independence of the voices), can separate mixed signals into individual sources (voices). ICA was applied to the analysis of electroencephalography (EEG) data in which a set of signals, one from each electrode, are separated into temporally independent groups [Makeig et al., 1997].
In functional magnetic resonance imaging (fMRI), a set of slices are acquired over time, and small differences in the intensity of the signal over time are extracted [Kwong et al., 1992]. The first application of ICA to fMRI data used spatial ICA (SICA) [McKeown et al., 1998a, 1998b]. Notably, there was an abrupt switch from temporal ICA (TICA), used previously, to SICA when applying ICA to fMRI. There are several reasons for this, of which the most important is that the spatial dimension is much larger than the temporal dimension in fMRI, whereas for EEG or the “cocktail party” problem, the temporal dimension is much larger than the number of sources. One report of the application of temporal ICA to fMRI data has appeared [Biswal and Ulmer, 1999]. However, spatial ICA has by far dominated the functional imaging literature to date.
Recent results have suggested that SICA and TICA yield similar results for experiments in which there is one predictable task‐related component [Peterson et al., 2000]. Similar results are demonstrated in this study for two task‐related components, provided the predictable components are uncorrelated in both space and time. However, this study also shows that SICA and TICA diverge if the predictable components are highly correlated in space or time, respectively.
The application of SICA to fMRI data is typically done in one of two ways, by choosing a particular component using a model of the time course or by examining the spatial map using knowledge of brain structure and function. In the first case, fMRI data are acquired using a paradigm that has an interesting and predictable component. A spatial ICA analysis is performed on the data. Consistently task‐related components are then chosen by correlating their time courses with the predicted waveform [McKeown et al., 1998b]. Transiently task‐related components are also extracted by examination of those components that are correlated, but not as highly correlated as the consistently task‐related component. The extraction of the final components of interest is ultimately dependent upon a hypothetical time course that is correlated with output time courses associated with the spatially independent components.
A second application of ICA is to discover functionally related “groups” of voxels, as in a study of functional connectivity of the motor cortex during a resting state scan. It requires examination of the spatial components to find anatomically meaningful maps. This is a fruitful application of ICA because the time courses of the functionally related voxels are not predictable and would not lend themselves to a model driven approach [Biswal et al., 1997].
A direct comparison of SICA with TICA has not appeared in the imaging literature, nor has an in‐depth study of the assumptions of both, although McKeown and Sejnowski have examined the assumptions of SICA [McKeown and Sejnowski, 1998] as it is applied to fMRI data. Additionally, there has not been a study of the performance of ICA when there are two predictable components present within the data that have varying degrees of spatial or temporal dependence. This situation can arise if the researcher presents two tasks during the same experiment or if there are two brain responses to a particular task which represent different functions but are largely overlapping in either the spatial or temporal dimension. This article reports on the first situation, and in such a case, it is possible to encounter situations in which the results from SICA and TICA diverge. Our study was designed to explore the applicability and generality of the assumptions of spatial or temporal independence in such cases.
Four novel visual activation paradigms were designed, each consisting of two spatiotemporal components that were either spatially dependent, temporally dependent, both spatially and temporally dependent, or spatially and temporally uncorrelated, respectively. Regression analysis [Worsley and Friston, 1995] of data resulting from these novel paradigms yielded spatiotemporal components in good agreement with the paradigm design; these “self‐evident” components were treated as benchmarks for assessment of spatial and temporal ICA of the data.
DESCRIPTION OF ICA METHODOLOGY
Independent component analysis works by decomposing a set of signals into maximally independent signals (components) by minimizing the mutual information between the components. Two preprocessing steps are typically employed before the application of ICA: data reduction and whitening. Data reduction is performed because it is assumed that there are fewer independent sources than there are time points (SICA) or spatial voxels (TICA). This process is typically performed by principle components analysis (PCA) is a way that capture virtually all (>99%) of the variability in the data while reducing the dimension. Prewhitening is performed to improve the convergence of the ICA algorithm. Prewhitening is achieved simultaneously with the reduction of the data dimensionality via PCA.
After preprocessing, the ICA algorithm is applied to the data. Often, ICA algorithms constrain the results to be uncorrelated or “whitened” (i.e., the final mixing matrix to be determined is constrained to be white, as opposed to prewhitening the initial data to decrease computation time), and this makes intuitive sense for fMRI data although it may not be as statistically efficient [Cardoso, 1994]. The orthogonality requirement imposes n(n + 1)/2 constraints, where n is the number of voxels (in TICA) or time points (in SICA), leaving n(n − 1)/2 unknown parameters and allowing second‐order statistics to greatly influence the solution. This is important for the present study as the waveforms used were either uncorrelated or strongly correlated.
Covariance between two variables xp and yq is defined as Cpq(x, y) = E[xp yq] − E[xp]E[yq] where E[x] = ∫xpx(x)dx, E[xy] = ∫∫xypx, y(x, y)dxdy and p(x) is a probability density function. When C11(x, y) = 0, x and y are uncorrelated, however, independence is a much stronger requirement and is only true when Cpq(x, y) = 0 for all values of p and q. ICA algorithms thus impose a stronger criterion upon the results than principle components analysis (PCA), which separates components such that they are uncorrelated with one another. There are currently several algorithms that can be used to separate independent components [Hyvarinen and Oja, 2000]. While the algorithm by which ICA is performed is not discussed in detail here, the independent components are determined with a fixed‐point algorithm that finds components that have either maximum or minimum kurtosis [Hyvarinen and Oja, 1997].
In spatial ICA, suppose X is an N‐by‐M matrix (where N is the number of time points and M is the number of voxels). The “signals” are the M spatial voxels, flattened to a 1‐D vector, and there are thus N different instances of these signals (whereas TICA would consider the signals the N individual time courses of which there are M instances). The SICA decomposition can then be described as C = ŴX, where Ŵ is the N‐by‐N estimated linear mixing matrix found using ICA, and C is an N‐by‐M matrix containing the N independent components. We can then write X = Ŵ−1C where the spatially independent components (images) are located in the rows of C and the associated spatially independent time courses are found in the columns of Ŵ−1 (see Fig. 1a).
Figure 1.
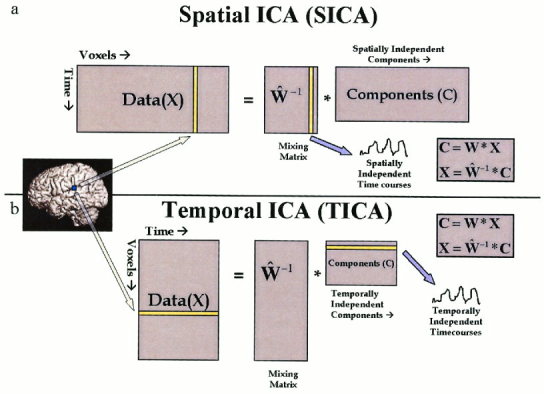
Visual depiction of SICA and TICA of fMRI. The matrix representation of the SICA (a) and TICA (b) approaches. In each case, the spatial information is flattened into one dimension and the temporal information is one dimension. In SICA, the algorithm attempts to find spatially independent components with associated (unconstrained) time courses whereas in TICA the algorithm attempts to find temporally independent time courses with associated spatial maps.
In temporal ICA, X is an M‐by‐N matrix (the transpose of the X matrix used for SICA). The decomposition is C = ŴX, where Ŵ is the M‐by‐M estimated linear mixing matrix found using ICA, and C is an M‐by‐N matrix containing the M independent components. As before, we can write X = Ŵ−1C where the temporally independent time courses are located in the rows of C and the associated temporally independent maps (images) are found in the columns of Ŵ−1 (see Fig. 1b). Note that TICA is typically much more computationally demanding than SICA for functional MRI applications because of a higher spatial than temporal dimension and can grow quickly beyond practical feasibility. Thus a covariance matrix on the order of N2 (where N is the number of spatial voxels of interest) must be calculated. A combination of increased hardware capacity as well as more advanced methods for calculating and storing the covariance matrix may provide a solution in the future.
EXPERIMENTS AND METHODS
Simulated Experiment
Simulated data were generated to test the validity of, and the effects of deviations from, the assumptions made either by SICA and TICA. The assumptions made by each (i.e., that there exist temporally/spatially independent components within the data) were either strongly conformed to or violated. Two pairs of temporal waveforms were created, one pair that contained uncorrelated signals (correlation = 0.0), and one pair that was comprised of signals that were highly temporally dependent (correlation = 0.82). The temporal waveforms were each 360s in duration and the first pair consisted of repeating patterns that were (a) on for 30 sec then off for 60 sec (×4); (b) same as (a), but delayed by 30 sec; so that (a) and (b) were temporally uncorrelated. The second pair consisted of repeating patterns that were a) on for 30 sec then off for 60 sec (×4); and (c) on for 30 sec then off for 30 sec, on for 60 sec then off for 60 sec (×2), so that patterns (a) and (c) were temporally dependent.
Figure 2 depicts two methods of combining a pair of waveforms, one method that had each waveform (amplitude = 1.0) modulating a different “voxel,” and one method that had an “overlapping region” modulated by the sum of the two waveforms. Additionally, random Gaussian noise with N(0,0.11) such that the contrast‐to‐noise‐ratio was 9.1 (on the order of that seen in our blood oxygen‐level dependent (BOLD) fMRI experiments) was added to all data sets. These two sets of temporal and two sets of spatial combinations provided four data sets that were subsequently analyzed using the SICA and TICA algorithms. We also performed a similar analysis using several non‐Gaussian noise distributions to ensure our results were not dependent upon this selection.
Figure 2.
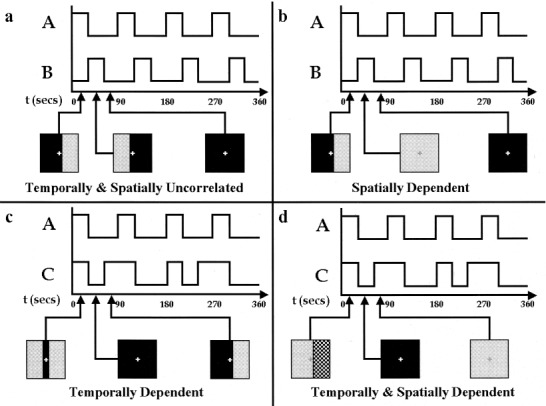
Graphical depiction of paradigms. The same basic paradigms were used for both the simulations and the fMRI experiments. The time courses represent the 6‐min experiment and the squares illustrate what the subjects were seeing in the scanner at each indicated time. The simulated data was created by adding the represented time courses (after convolution with a hemodynamic response function) to random noise.
fMRI Paradigm
The paradigms designed for use in the MR scanner used an 8 Hz reversing checkerboard pattern with a spatial frequency of one cycle/degree presented to different portions of the visual field. The subjects looked into a mirror to see a screen that subtended 25 degrees of visual field. The temporal combinations from the simulated experiment were used. For the spatial combinations, the retinotopic mapping of the visual field to the visual cortex was exploited. Stimulating the subject's left visual field or right visual field created the spatially independent (nonoverlapping) regions. Stimulating the subject's right visual field or the entire visual field created the overlapping regions. In cases where both the right visual field and the entire visual field were overlapping, the contrast of the checkerboard pattern was increased. The temporal patterns were achieved by switching between the presentation of the spatial pattern (checkerboard) and a dark screen; a visible fixation point at the center of the screen was provided at all times. Graphical representations of the paradigms are presented in Figure 2.
fMRI Experimental Procedure
All human studies were approved by the Institutional Review Board of Johns Hopkins University. BOLD fMRI data were acquired in a Gyroscan NT PT‐6000 operating at 1.5 Tesla (Philips Medical Systems). A sagittal localizer was performed, followed by the prescription of the locations for the anatomic scan. A T1‐weighted anatomic scan (TR = 500 ms, TE = 30 ms, field of view = 24 cm, matrix = 256 × 256, slice thickness = 5 mm, gap = 0.5 mm) consisting of nine slices parallel to the calcarine sulcus was acquired. Next, the functional scans were acquired consisting of single‐shot gradient‐echo echo‐planar (EPI) scan (TR = 1 sec, TE = 39 ms, field of view = 24 cm, matrix = 64 × 64, flip angle = 90°, slice thickness = 5 mm, gap = 0.5 mm) over a 6‐min period. The visual stimuli were provided on a rear‐projection screen via an LCD projector. Ten “dummy” scans were acquired to allow for the establishment of longitudinal equilibrium, after which the paradigm was triggered by the scanner.
Subjects were positioned in the scanner and an elastic head strap as well as foam padding packed on the sides of the head were used to reduce head motion during the experiment. The subjects were instructed to fixate on the crosshair at the center of the screen during the 6‐min scan. Four such scans were performed on five college‐age subjects who participated in the study.
Preprocessing
The images were first corrected for timing differences between the slices using windowed Fourier interpolation [van de Moortele et al., 1997; Calhoun et al., 2000a]. Next, the data were imported into the Statistical Parametric Mapping (SPM99, Wellcome Department of Cognitive Neurology) software package running on Matlab. Using this software, data were coregistered to a mean image and spatially smoothed with a 6 × 6 × 10 mm full‐width at half maximum (FWHM) Gaussian kernel to improve the contrast‐to‐noise ratio. Next the data were spatially normalized into a standard space [Talairach and Tournoux, 1988] and resliced to 3 × 3 × 4 mm voxels. We verified that smoothing spatially and windowed Fourier interpolation temporally did not change the ICA results significantly (note that this does not imply that smoothing does not affect ICA results in general), and then for comparability used the same preprocessed data for both the ICA and the regression analyses.
Regression Analysis
A linear model was constructed in which the time courses corresponded to the previously discussed pairs of signals (see waveforms in Fig. 2); the “ideal” signals were convolved with a canonical hemodynamic response function. A high‐pass (drift removal) filter was incorporated by entering sinusoidal functions into the model up to a frequency of 1/120 sec. The data were then regressed onto the model allowing for varying hemodynamic latencies in different brain areas [Calhoun et al., 2000b].
Independent Component Analysis
Data were first simultaneously prewhitened and reduced in dimension to 20 components (∼99% of nonzero eigenvalues retained) using principle components analysis (PCA), after which ICA was performed. Twenty ICA components were estimated because this number provided a good trade‐off between preserving much of the information in the data while reducing the size of the data set, thus making the analysis and interpretation less intensive. The optimal selection of the reduction parameter is not an easy problem and is currently being studied by several groups.
For the SICA analysis, all voxels inside the brain throughout the nine slices were used. For the TICA analysis, a smaller block of voxels including the visual cortex was used, to reduce computational demands required (mentioned in the theoretical discussion of TICA). The mean of the data in either space (SICA) or time (TICA) was removed. In both cases, ICA was performed using a fixed‐point algorithm [Hyvarinen and Oja, 1997]. Additionally, the widely known algorithm of Bell and Sejnowski [1995] was applied to our simulated data, with similar results.
RESULTS
Simulated Experiment
The results from the simulated experiment are summarized in Figure 3. Thresholded activation maps are overlaid on a gray square (indicating the entire image area) using colors as follows: red corresponding to areas that produced the red time course, blue for areas that produced the blue time course, and green indicating areas that matched both time courses. In the time plots, the red lines indicate the time course produced by the SICA or TICA analysis. There is also a white or yellow time course in each time plot that indicates the actual underlying time course that was used to create the simulated data set.
Figure 3.
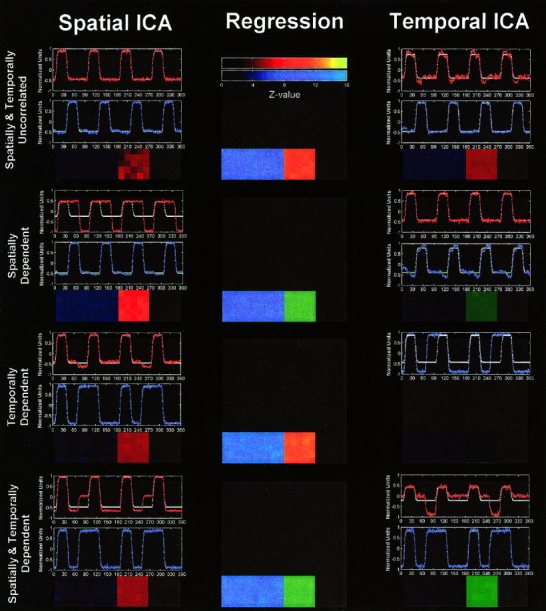
Results of analyses of simulated data. Thresholded activation maps are overlaid on a gray square using colors as follows: red corresponding to areas that produced the red time course, blue for areas that produced the blue time course, and green indicating areas that matched both time courses. Figures are arranged in a 3‐by‐4 grid where columns are SICA, regression, and TICA results, respectively, and rows are successive experiments. Note that SICA was “successful” in extracting the true answer in experiments (a) and (c), whereas TICA was “successful” in extracting the true answer in experiments (a) and (b). Regression was successful in all cases (to be expected since the exact model is known).
In all cases in which the SICA algorithm encountered spatially dependent signals, or in which the TICA algorithm encountered temporally dependent signals, they were unable to recover the original sources from the data. When the SICA and TICA algorithms encountered signals that were not strongly spatially or temporally dependent, respectively, a successful separation was obtained. While the results from the simulated experiments seem quite obvious, the point being made (that if the desired temporal or spatial components, are highly dependent they may not be successfully extracted using TICA or SICA, respectively) still holds true. Similar results for other pairs of waveforms (such as one in which an event‐related paradigm was presented with a boxcar paradigm with which it was either highly correlated or uncorrelated) were also observed. The conclusions made hold true despite the noise distribution chosen for the simulated experiment and are also confirmed by the results from the fMRI experiments.
fMRI Experiment
The results from the fMRI experiments are summarized in Table I for both SICA and TICA. Thresholded activation maps for one slice are overlaid on the EPI image using colors as follows: red corresponding to areas that produced the red time course, blue for areas that produced the blue time course, and green indicating areas that matched both time courses. As before, in the time plots, the red lines indicate the time course produced by the SICA or TICA analysis. There is also a white or yellow time course in each time plot which indicates the time course of our visual paradigm. In all cases, the algorithms detected 1) the two signals that were expected, 2) only one of the two signals, or 3) one or two components that were combinations of the expected signals. In comparison, regression results yielded the expected outcome in all cases.
Table I.
Summary of fMRI results
| Subject | (a) Both (LA, RB) | (d) Neither (RA, FC) | (c) SICA (RA, LC) | (b) TICA (RA, FB) | ||||
|---|---|---|---|---|---|---|---|---|
| SICA | TICA | SICA | TICA | SICA | TICA | SICA | TICA | |
| 1 | + LA, RB | + LA, RB | − FA | − FAC | + LA, RC | − FC | − FA | + FA, RB |
| 2 | + LA, RB | + LA, RB | − FAC | − FAC | + LA, RC | − FC | − L1/R2 | + FA, RB |
| 3 | + LA, RB | + LA, RB | − FAC | − FAC | + LA, RC | − FC | − L12/RB | + FA, RB |
| 4 | + LA, RB | + LA, RB | − FAC | − LAC | + LA, RC | − FA | − L1/R2 | + FA, RB |
| 5 | + LA, RB | + LA, RB | − FAC | − FAC | + LA, RC | − F1/L2 | − L1/R2 | + FA, RB |
| % Correct | 100 | 100 | 0 | 0 | 100 | 0 | 0 | 100 |
Results from all subjects. A plus (+) indicates that the ICA matched the regression and a minus (−) indicated that the ICA did not agree with the regression. Letter codes are as follows: L = left visual cortex; R = right visual cortex; F = full visual cortex (both left and right). A, B, and C indicate which of the time courses are used (as indicated in Fig. 2).
A comparison of the results from one subject is presented in Figure 4. In all cases the images are thresholded at a Z‐score corresponding to P < 0. 0001. This is similar to Z‐score analysis used in previous ICA publications [McKeown et al., 1998b]. The time courses for each of the ICA analyses are plotted along with the idealized regressor used in the regression analysis.
Figure 4.
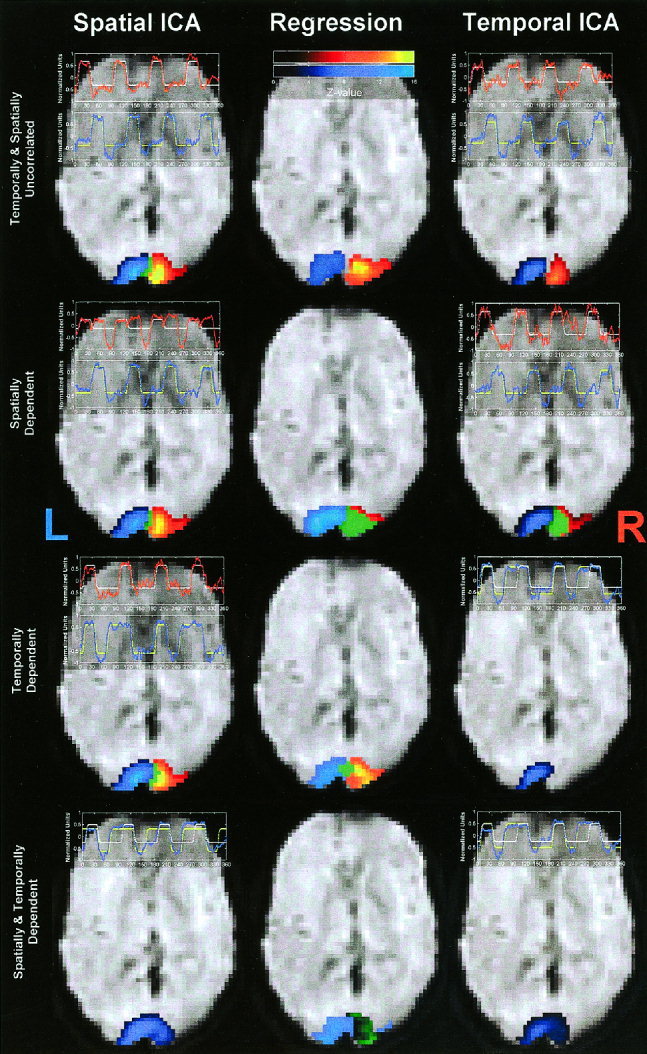
Results of analyses of fMRI data (one subject). Thresholded activation maps for one slice are overlaid on the EPI image using colors as follows: red corresponding to areas that produced the red time course, blue for areas that produced the blue time course, and green indicating areas that matched both time courses. Figures are arranged in a 3‐by‐4 grid where columns are SICA, regression, and TICA results, respectively, and rows are successive experiments. Note that SICA agreed with the regression results in experiments (a) and (c), whereas TICA agreed with the regression results in experiments (a) and (b).
DISCUSSION
Independent component analysis can be applied to fMRI data in two different ways, spatial ICA or temporal ICA. To date, spatial ICA has dominated fMRI analysis even though initially temporal ICA was introduced to the field. We have provided data demonstrating that SICA and TICA can have diverging results, depending upon the characteristics of the underlying signals to be estimated. In particular, when the assumption of spatial or temporal independence is strongly violated (e.g., the signals are highly dependent spatially or temporally, respectively), then ICA results do not agree with regression.
Regression analysis proved a useful way to analyze these data, because for this study strong hypotheses were available for primary visual areas. Such hypotheses will not always be available, and in fMRI a strength of ICA is that it can characterize data without making specific modeling assumptions. However, ICA is not completely free of assumptions and, as we have demonstrated, the correct signals may be obtained only if the correct choice (between spatial and temporal independence) is made. Biswal et al. have applied temporal ICA to their analysis to extract components related to bilateral finger tapping and to hypercapnia [Biswal and Ulmer, 1999]. These two conditions are not thought to be temporally dependent and thus it would be reasonable to apply temporal ICA to these data, as was done. Previous spatial ICA analyses have attempted to extract a single task‐related component that would tend to be spatially independent of other components; however, it has also been demonstrated that temporal ICA can produce similar results in this case (albeit with additional computational demands compared with spatial ICA) [Peterson et al., 2000]. Note that spatial ICA has only previously been shown to produce similar results to temporal ICA when there is a single task‐related waveform. We find that they also produce similar results in the case of two components only where the components are uncorrelated in both the spatial and the temporal dimensions. Additional considerations are needed when attempting to apply ICA to an experiment in which two waveforms induced by the researcher are involved. Of primary consideration should be whether the waveforms (or hypothesized activated areas) are heavily dependent either in time or space. If such is the case, then temporal ICA or spatial ICA, respectively, should not be applied or, if applied, the results should be interpreted carefully. Future studies are needed to further elucidate the application and interpretation of ICA analyses. For example, in this study, control over the dependence of the paradigm waveforms was utilized, but it is conceivable that in certain cases the response of the brain to a given paradigm may contain either spatially and/or temporally dependent responses that are not under the control of the researcher. This question is important and will need to be answered as the application of ICA to fMRI becomes more widespread. Additionally, questions of how TICA or SICA are affected by motion must be studied further.
Some general comments on the result presentation and experimental procedure are in order. First, it is well known that the activation matrix produced by ICA only provides a solution up to a multiplicative constant. In the results, we have chosen to display all components such that they correlate positively with the model. Second, in these studies it was important for the subjects to maintain central fixation to stimulate different parts of the visual fields. Eye movements were not monitored, but all subjects were cooperative, and in all cases the regression analysis provided results as expected.
The particular outcomes of the fMRI experiments provide additional insight when examined in detail. In experiment (c), the TICA map did not agree with the regression results and did not appear to demonstrate bilateral activation. Bilateral activation does become apparent if a less stringent threshold was used, but we chose to use the same threshold for depiction of all analyses (P < 0. 0001). The decreased magnitude in the right hemisphere reports on the inability of TICA to accurately capture the signal. In experiment (d), the scaling of contrast by a factor of eight was intended to approximately double neuronal firing (ln 8 ≈ 2.1) and thus also approximately double the BOLD response [Boynton et al., 1996], but exact calibration was not performed. Regression results suggest that this did not present a problem.
The purpose of our study was to demonstrate how ICA performed when the underlying results were predictable. As the real strength of ICA is in characterizing unpredictable results, an understanding of how ICA performs when there are predictable signals may lend insight into how it will perform with unpredictable signals. Further studies may be needed to deepen our understanding of the applicability of spatial and temporal ICA to fMRI data, including such questions as how many components should be estimated and when to use related new methods such as hybrid ICA [McKeown, 2000].
It is well known that heavily model‐based approaches, while statistically powerful, can provide an incorrect answer if an incorrect model is chosen. However, data‐driven methods, such as ICA, which attempt to discern spatial/temporal structure in fMRI data, can provide incorrect answers as well. An example of this problem, dubbed “misallocation of variance,” has been noted for another data driven approach, PCA [Woods and McCarthy, 1984]. In conclusion, the choice of spatial or temporal ICA should best be made with the knowledge of whether a given paradigm may reasonably be expected to be subserved by either spatially or temporally independent neuronal components.
Acknowledgements
Data were acquired at the FM Kirby Research Center for Functional Brain Imaging, Kennedy Krieger Institute.
Contributor Information
V.D. Calhoun, Email: vcalhoun@jhu.edu.
J.J. Pekar, Email: jpekar@mri.jhu.edu.
REFERENCES
- Bell AJ, Sejnowski TJ (1995): An information maximisation approach to blind separation and blind deconvolution. Neural Computation 7: 1129–1159. [DOI] [PubMed] [Google Scholar]
- Biswal BB, Ulmer JL (1999): Blind source separation of multiple signal sources of fMRI data sets using independent component analysis. J Comput Assist Tomogr 23: 265–271. [DOI] [PubMed] [Google Scholar]
- Biswal BB, Van Kylen J, Hyde JS (1997): Simultaneous assessment of flow and BOLD signals in resting‐state functional connectivity maps. NMR Biomed 10: 165–170. [DOI] [PubMed] [Google Scholar]
- Boynton GM, Engel SA, Glover GH, Heeger DJ (1996): Linear systems analysis of functional magnetic resonance imaging in human V1. J Neurosci 16: 4207–4221. [DOI] [PMC free article] [PubMed] [Google Scholar]
- Calhoun V, Golay X, Pearlson G (2000a): Improved fMRI slice timing correction: interpolation errors and wrap around effects. In: Proceedings ISMRM, Ninth Annual Meeting, Denver.
- Calhoun V, Kraut M, Adali T, Pearlson G (2000b): A weighted‐least squares method for latency estimation in fMRI. In: Proceedings ISMRM, Ninth Annual Meeting, Denver.
- Cardoso JF (1994): On the performance of orthogonal source separation algorithms. In: Proceedings EUSIPCO, Edinburgh.
- Comon P (1994): Independent component analysis—a new concept? Signal Proc 36: 287–314. [Google Scholar]
- Hyvarinen A, Oja E (1997): A fast fixed‐point algorithm for independent component analysis. Neural Computation 9: 1483–1492. [Google Scholar]
- Hyvarinen A, Oja E (2000): Independent component analysis: algorithms and applications. Neural Network 13: 411–430. [DOI] [PubMed] [Google Scholar]
- Jutten C, Herault J (1991): Blind separation of sources, part I: an adaptive algorithm based on neuromimetic architecture. Signal Proc 24: 1–10. [Google Scholar]
- Kwong KK, Belliveau JW, Chesler DA, Goldberg IE, Weisskoff RM, Poncelet BP, Kennedy DN, Hoppel BE, Cohen MS, Turner R (1992): Dynamic magnetic resonance imaging of human brain activity during primary sensory stimulation. Proc Natl Acad Sci U S A 89: 5675–5679. [DOI] [PMC free article] [PubMed] [Google Scholar]
- Makeig S, Jung TP, Bell AJ, Ghahremani D, Sejnowski TJ (1997): Blind separation of auditory event‐related brain responses into independent components. Proc Natl Acad Sci U S A 94: 10979–10984. [DOI] [PMC free article] [PubMed] [Google Scholar]
- McKeown MJ (2000): Detection of consistently task‐related activations in fMRI data with hybrid independent component analysis. Neuroimage 11: 24–35. [DOI] [PubMed] [Google Scholar]
- McKeown MJ, Jung TP, Makeig S, Brown G, Kindermann SS, Lee TW, Sejnowski TJ (1998a): Spatially independent activity patterns in functional MRI data during the stroop color‐naming task. Proc Natl Acad Sci U S A 95: 803–810. [DOI] [PMC free article] [PubMed] [Google Scholar]
- McKeown MJ, Makeig S, Brown GG, Jung TP, Kindermann SS, Bell AJ, Sejnowski TJ (1998b): Analysis of fMRI data by blind separation into independent spatial components. Hum Brain Mapp 6: 160–188. [DOI] [PMC free article] [PubMed] [Google Scholar]
- McKeown MJ, Sejnowski TJ (1998): Independent component analysis of fMRI data: examining the assumptions. Hum Brain Mapp 6: 368–372. [DOI] [PMC free article] [PubMed] [Google Scholar]
- Peterson KS, Hansen LK, Kolenda T, Rostrup E, and Strother SC (2000): On the independent components of functional neuroimages. Pajunen P, Karhunen J, editors. In: Proceedings ICA2000, Helsinki. Espoo, Finland: Otamedia. [Google Scholar]
- Talairach J, Tournoux P (1988): A co‐planar sterotaxic atlas of a human brain. Stuttgart: Thieme. [Google Scholar]
- van de Moortele PF, Cerf B, Lobel E, Paradis AL, Faurion A, Le Bihan D (1997): Latencies in fMRI time‐series: effect of slice acquisition order and perception. NMR Biomed 10: 230–236. [DOI] [PubMed] [Google Scholar]
- Woods CC, McCarthy G (1984): Principal component analysis of event‐related potentials simulation studies demonstrate misallocation of variance across components. Electroencephalogr Clin Neurophysiol 59: 249–260. [DOI] [PubMed] [Google Scholar]
- Worsley KJ, Friston KJ. (1995): Analysis of fMRI time‐series revisited—again. Neuroimage 2: 173–181. [DOI] [PubMed] [Google Scholar]