

Abstract
We used a current localization by spatial filtering‐technique to determine primary language areas with magnetoencephalography (MEG) using a silent reading and a silent naming task. In all cases we could localize the sensory speech area (Wernicke) in the posterior part of the left superior temporal gyrus (Brodmann area 22) and the motor speech area (Broca) in the left inferior frontal gyrus (Brodmann area 44). Left hemispheric speech dominance was determined in all cases by a laterality index comparing the current source strength of the activated left side speech areas to their right side homologous. In 12 cases we found early Wernicke and later Broca activation corresponding to the Wernicke‐Geschwind model. In three cases, however, we also found early Broca activation indicating that speech‐related brain areas need not necessarily be activated sequentially but can also be activated simultaneously. Magnetoencephalography can be a potent tool for functional mapping of speech‐related brain areas in individuals, investigating the time‐course of brain activation, and identifying the speech dominant hemisphere. This may have implications for presurgical planning in epilepsy and brain tumor patients. Hum. Brain Mapping 14:236–250, 2001. © 2001 Wiley‐Liss, Inc.
Keywords: magnetoencephalography, MEG, ERF, silent reading, silent naming, language lateralization, Wernicke, Broca
INTRODUCTION
The topological and functional anatomy of speech and language related brain areas, although subject of a multitude of studies, is not fully understood in its entirety. The knowledge of eloquent brain areas, however, is essential for surgery of lesions in the vicinity of language‐related brain structures. Different modalities have been applied to realize reliably individual cortex mapping of brain functions. Functional magnetic resonance imaging (fMRI) reflects changes in the cerebral blood flow and oxygenation level of activated vs. non‐activated brain structures. Positron emission tomography (PET) visualizes the glucose or oxygen consumption of activated brain regions or molecular changes of concentrations of transmitter substances. Both techniques are indirect methods visualizing neuronal activity by metabolic changes and secondary neurophysiological effects after neuronal excitation. fMRI provides a good spatial resolution and PET only a moderate one. The results of fMRI and even more, those of PET, are limited by the lack of a sufficient temporal resolution ability that is needed to investigate not only the localization but also the sequential activation of different brain areas involved in higher cognitive functions. Magnetoencephalography (MEG) is the only tool able to resolve both the neuronal activity with a high 3D spatial resolution of 1.5–3 mm under favorable conditions (sufficient signal‐to‐noise ratio, cortical source, well covered by sensors) using a simple sphere as volume conductor model [ Gharib et al., 1995; Leahy et al., 1998] and to resolve dynamically the time‐course of source activation within milliseconds [Elbert, 1998]. The main advantage from the neurophysiological point of view is that MEG directly reflects the sources of brain activity measuring the extremely weak magnetic fields of intracellular neuronal excitation [Okada et al., 1997].
Clinical functional mapping by MEG was first focused on the localization of the motor and somatosensory cortex by motor (MEF) and somatosensory (SEF) evoked field measurements [Gallen et al., 1994; Ganslandt et al., 1996; Sobel et al., 1993]. Multimodal studies performed by different groups showed similar findings of MEG and fMRI [Inoue et al., 1999; Morioka et al., 1995; Nimsky et al., 1999; Stippich et al., 1998], MEG and PET [Joliot et al., 1998], as well as MEG and intraoperative electrocorticography [Ganslandt et al., 1999; Roberts et al., 1995]. These findings underline the validity of the SEF and MEF localization results. Functional mapping of the cortical central region by MEG is well established and is about to become a clinical routine investigation to assess the operation risk, plan the surgical approach preoperatively, and use the localizations intraoperatively for functional neuronavigation in patients with tumors located around the motor, somatosensory, and visual cortex [Ganslandt et al., 1999; Inoue et al., 1999; Nimsky et al., 1999; Rezai et al., 1996].
Visualizing higher cortex activation like speech processing in its whole complexity still remains difficult because several brain areas are activated either simultaneously or sequentially. Speech‐related responses are also often contaminated by additional noise caused by slight muscle contractions or simultaneously active sources that are not speech relevant.
The most pervasive speech processing model describing the time‐course of cortex activation after a visual or acoustic stimulus is the Wernicke‐Geschwind Model [Geschwind, 1970] that hypothesizes that first the sensory speech area is activated, which involves the posterior part of the temporal lobe, the supramarginal and angular gyrus (Wernicke area), and then the motor speech area is activated, located in the inferior frontal gyrus (Broca area). Language mapping by electrocortical stimulation [Ojemann, 1979, 1991; Reulen et al., 1997] and activation studies [Penfield and Roberts, 1959], however, showed a high degree of inter‐individual variability of the language‐related localizations. First results of functional imaging of speech‐relevant brain areas by means of fMRI [Nakai et al., 1999; Price et al., 1996; Yetkin et al., 1995], PET [Demonet et al., 1994; Eulitz et al., 1994; Muller et al., 1997; Vinas et al., 1997] and MEG [Grummich et al., 1994; Kamada et al., 1998; Papanicolaou et al., 1999; Salmelin et al., 1994] emphasized the role of the Wernicke and the Broca areas but also showed a widely spread activation over the temporal lobe. It also showed the involvement of the inferior, middle, and superior frontal gyrus, the pre‐ and postcentral gyrus, and the supplementary motor area [Nakai et al., 1999; Price et al., 1996; Yetkin et al., 1995].
It is generally accepted that speech is lateralized to one hemisphere in most cases. Wada and Rasmussen [1960] showed that in 93% of the overall population speech dominance is located in the left hemisphere. In 96% of right‐handed humans the speech dominant hemisphere is left. In left‐handed people, 70% of the speech dominance is left hemispheric, 15% is right hemispheric, and in 15% both hemispheres have strong speech processing ability so that no dominance of either hemisphere can be determined using the standard procedure (Wada test) [Wada and Rasmussen, 1960]. Previous MEG studies pointed out the speech specific hemispheric asymmetry by the distribution of dipolar source activation [Kamada et al., 1998; Kuriki et al., 1996, 1999; Papanicolaou et al., 1999; Simos et al., 1999; Zouridakis et al., 1998]. Language laterality studies investigated by means of fMRI [Baciu et al., 1999; Binder et al., 1997; Cuenod et al., 1995; Frost et al., 1999; van der Kallen et al., 1998] and PET [Bookheimer et al., 1997; Xiong et al., 1998] also emphasized the dominance of the left hemisphere.
In contrast to the multi‐dipole model approach successfully used in most previous MEG language studies [Helenius et al., 1998; Levelt et al., 1998; Salmelin et al., 1994; Tarkiainen et al., 1999] where the knowledge about the number of active sources and the source topology (point‐like, i.e., extent of source is small compared to distance from sensors) is essential for the localization result, we used spatial filtering where no model assumptions are necessary. Spatial filtering has recently been proposed for the investigation of language‐related areas by analyzing stimulus related but unaveraged MEG signals. In those studies event related synchronization and de‐synchronization was analyzed by comparing the root mean square activation of selected time windows during a reading task and a visual control condition [Kato et al., 2000; Robinson, 1997].
In this study we used spatial filtering for the analysis of averaged language‐related MEG signals to establish a completely noninvasive technique that should be able to investigate several aspects of speech processing: time‐course of speech‐related brain activation, speech lateralization, and the localization of primary speech relevant brain areas by means of the MEG. We focused on the aspect of presurgical localization as a potential alternative for invasive investigations. These are particularly the invasive intracarotid sodium amobarbital Wada test [Wada and Rasmussen, 1960] that only determines the speech dominant hemisphere and the burdening intraoperative speech ability control by direct cortical stimulation during surgery in only partially anesthetized patients [Ojemann et al., 1988; Reulen et al., 1997].
MATERIALS AND METHODS
Subjects
We investigated eight healthy volunteers (five male, three female) between 26 and 37 years of age (mean: 31.4 years) and seven patients (five male, two female) between 36 and 67 years of age (mean: 47.0 years) with brain tumors adjacent to the Wernicke or Broca area before tumor surgery. All patients suffered from mild to modest grades of dyslexia either permanently or incidentally during epileptic seizures. All subjects and patients were native German speakers. The Edinburgh Handedness Inventory [Oldfield, 1971] was performed before MEG measurement and revealed right‐handedness in all subjects and in six patients. Only one patient was clearly left‐handed. After detailed instruction of the measurement's protocol and the tasks all patients and volunteers gave written informed consent to participate in this study (Table I).
Table I.
Summary of patients and subjects*
| No. | ID | Gender | Age | Edinburgh handedness inventory | Diagnosis | Neurological deficits |
|---|---|---|---|---|---|---|
| Patient | ||||||
| 1 | dpa | M | 38 | Left | Glioblastoma IV (WHO), left frontal | Word finding disorder |
| 2 | hhd | M | 58 | Right | Glioblastoma IV (WHO), left temporo‐mesial | Word finding disorder |
| 3 | hkh | F | 67 | Right | Glioblastoma IV (WHO), left angular g. | Global dysphasia, agraphia, acalculia, apraxia |
| 4 | hrc | M | 40 | Right | Astrozytoma II (WHO), left precentral g. | Right hemiparesis, word finding disorder |
| 5 | khd | M | 44 | Right | Astrozytoma II (WHO), left temporal | Word finding disorder |
| 6 | tbb | M | 36 | Right | Oligoastrozytoma II (WHO), right fronto‐temp. | Complex focal seizures |
| 7 | ugb | F | 46 | Right | Glioblastoma, left angular g. | Agraphia, acalculia, finger agnosia |
| Subject | ||||||
| 1 | gld | M | 35 | Right | ||
| 2 | idb | M | 28 | Right | ||
| 3 | kmb | F | 35 | Right | ||
| 4 | kpb | F | 28 | Right | ||
| 5 | mpb | F | 26 | Right | ||
| 6 | mlf | M | 31 | Right | ||
| 7 | mmf | M | 31 | Right | ||
| 8 | ogb | M | 37 | Right |
Patients: N = 7; mean age, 47.0. Subjects: n = 8; mean age, 31.4.
MEG System and Data Acquisition
Measurements were performed simultaneously over both hemispheres with a 2 (sensors) × 37 channel biomagnetic system (Magnes II, 4‐D Neuroimaging, San Diego, CA) in a magnetically shielded dark room. The sensors were centered between the assumed Wernicke and Broca areas over either hemisphere. During the measurement the patients and subjects had to lie on a bed on their right side. To prevent movement artifacts, we placed the patients and subjects in a vacuum cushion with their head fixed as comfortable as possible between both MEG probes. Eye movements were simultaneously monitored by 2‐channel electrooculography (EOG) with electrodes fixed around the left eye. We also registered the patients' and subjects' 1‐channel electrocardiogram (ECG) signal. Motion and eye movement artifacts were manually discarded during the visual inspection of the raw epochs after the data acquisition. If the MEG signal was contaminated by the magnetocardiogram we automatically subtracted the appropriate amount of the ECG from the raw dataset. We recorded two measurements with a total acquisition time of 20 min for each stimulation paradigm with a data sampling rate of 520.8 Hz and an online high‐pass filter of 0.1 Hz.
Stimulation Paradigm
The stimulation paradigm was specifically designed to counterbalance the drawbacks of MEG source localization ability compared to other tomographical functional imaging modalities, i.e., the MEG inherent ambiguity of the inverse problem that becomes more difficult with an increasing number of simultaneously active sources. Analogue to the Wada test, visual presentation of the stimuli was used rather than auditory stimuli to avoid additional activation in the primary and secondary auditory cortices in the superior temporal lobe and to have a well‐defined stimulus onset. To prevent artifacts evoked by muscle contractions and head movements by overt speaking and reading, we decided to perform a silent naming and a silent reading task. Previous studies showed that visually presented stimuli can be transformed into a phonological processing in the brain by silent reading or naming internally in the mind even without speaking loudly [Paulesu et al., 1993]. Silent reading/naming task were successfully performed in different studies before [Grummich et al., 1994; Kamada et al., 1998; Salmelin et al., 1994]. We positioned a projection screen 40 cm in front of the patient's face adjusted to the field of vision. During the first measurement we visually displayed on the screen simple meaningful pictograms via a glassfiber cable. The easily recognizable pictograms representing monosyllabic objects (like house, dog, cat, cow,…) were scanned from a common children's picture‐book. The patients' and subjects' task was to name the pictograms silently in their mind (“covert naming”). In the second measurement, monosyllabic German words of objects were presented that should also be read silently and spoken internally (“covert reading”). To compare the activity elicited by speech and by non‐speech stimuli, about 350 meaningful stimuli were randomized with 200 meaningless control stimuli consisting of distorted Arabian characters in the first measurement and a combination of lines in the second one. Each stimulus was displayed for 800 msec with an interstimulus interval of 2,531 msec and a variation of 500 msec. We intentionally did not ask for feedback of the patient to check if the task was carried out correctly because we expected that any control task (e.g., button press), apart from producing motion artifacts, would cause additional cortical activation, rendering MEG source localization far more difficult.
Data Analysis
The recorded data was digitally notch filtered at 50 Hz (6dB edges: 48.6 Hz, 51.7 Hz). The obtained signal epochs were averaged time‐locked to the stimulus onset separately for the meaningful and the meaningless stimuli. A DC‐offset baseline correction was applied using a short prestimulus period as a baseline.
In addition, we also performed a subtraction of the averaged meaningless data set from the meaningful one to enhance the specific speech relevant magnetic signal components [Kamada et al., 1998].
The time section between stimulus onset and 1.5 sec after the stimulus onset was manually inspected separately for each averaged data set. The time sections showing a clear field reversal with a positive and a negative maximum (dipolar field pattern) were manually selected. For source localization we separately applied the single equivalent current dipole model (ECD) to the averaged data of both hemispheres. Dipole localization was performed every 2 msec calculating three coordinates and three current vector components of each selected time segment with a sphere as the head model that was locally fitted to the curvature of the skull below the MEG sensors. Dipole localizations with a correlation smaller than 0.95 were discarded. To be able to separate simultaneously active sources we also calculated the current density distribution using spatial filtering (CLSF: Current Localization by Spatial Filtering) [Grummich et al., 1994; Kamada et al., 1998; Robinson and Rose, 1992]. The principle of the CLSF is to distinguish brain sources by their respective signal differences in space. This is accomplished by constructing a set of spatial filters for each of typically 6,000 voxels of equal size that represent the spatial sensitivity profile of the MEG probes. The location and the diameter of the analyzing sphere is adjusted to the brain volume where activity should be analyzed. When evaluating both MEG probes (2 × 37 channels) together for the determination of the laterality index (see below) the whole brain was selected yielding a reconstruction sphere with a radius of typically 7.5 cm and a spatial resolution of approximately 7 mm. In addition, the signals of each hemisphere were also analyzed separately where the reconstruction sphere was placed inside the sensitivity cone of each MEG probe with a typical radius of 4.5 cm to obtain an increased spatial resolution of 4 mm. The spatial filter coefficients for a given voxel are obtained by weighting the forwardly calculated field distribution of a dipolar test source in the given voxel with the covariance statistics of the ‘a posteriori’ MEG signal instead of using the real lead field matrix. For each voxel the spatial filter coefficients are calculated with an angular resolution of 5° by systematically varying the orientation of the tangential dipole component of the dipolar test source from 0–180°. By this spatio‐temporal approach, coherent predominant signal components will be emphasized whereas uncorrelated noise will be attenuated. Unfortunately, this usage of the data covariance matrix also implies that the spatial filter algorithm shows a degraded performance in the presence of sources with correlated time‐courses [Van Veen et al., 1997]. If there is a high correlation between sources, one may obtain resultant activity in between the real active areas if they are closely spaced, similar to the resultant activity in other localization algorithms associated with the underestimation of the number of sources. Alternatively, the activity level is generally underestimated if there is a high correlation between distant sources as would be the case of bilateral synchronous activity. To eliminate the possibility of the latter effect, source localization was not only performed for the combined MEG data of both hemispheres but also for the separate MEG data of either hemisphere. Nevertheless, perfect correlation (i.e., identical activation time‐course) between spatially distinct sources in the brain is unlikely, although partial correlation can be expected when several brain areas react to an external stimulus or become activated by a common third active area. Although partial correlation decreases the estimated activity level, different sources still may be distinguished. During the CLSF analysis the time interval between 0 and 1.500 msec was selected for the calculation of the covariance matrix. Precautions to minimize the noise contribution to the covariance matrix were taken using the Backus‐Gilbert method [Backus and Gilbert, 1970] as proposed by Robinson [Robinson, 1991]. This is achieved by a truncated singular value decomposition of the data covariance matrix where the smallest singular values are omitted in ascending order until the virtual sensor noise is below the measurement noise level obtained from the pre stimulus interval. Given this information for each voxel, the measured magnetic field distribution is treated by this set of spatial filters for each time instant yielding the source activity in each voxel. A detailed description of the CLSF method can be found in Robinson [1991]. To compensate the minimum norm inherent overestimation of superficial sources, an additional depth regularization of the spatial filter coefficients is performed taking into account the sensitivity profile of the sensor array (unpublished). We investigated the ability to localize multiple point‐like and extended sources depending on the noise level of the signal. It turned out that under realistic conditions up to three simultaneously active source can be resolved in each hemisphere with our Magnes II system. Only CLSF activity above a 75% threshold is considered to be valid and was used for display.
Depending on the noise level, we repeated the data analysis after filtering the data set with a high pass filter at 0.25 Hz, 0.5 Hz or 1 Hz (with 6dB edge: 0.2 Hz, 0.4 Hz, and 0.8 Hz). The coordinates of only one voxel with the maximum CLSF intensity of the Wernicke and Broca were determined. We calculated the CLSF intensity of this selected voxel for a time section of 0–1.5 sec after stimulus onset. The resulting trace indicated the time‐course of brain activity for a representative voxel of the Wernicke and Broca area.
The CLSF enables us to not only investigate the obtained activity of the 37 channels over one hemisphere alone but also the strength of sources of both hemispheres by processing the measured signals of both probes simultaneously. Thus, we were able to calculate a laterality index (LI) taking into account the strength (S) of speech activated sources between left and right cortex activation. S was calculated for all voxels along a line from the right to the left hemisphere crossing the activity maxima of the Wernicke/Broca areas of both sides. If no CLSF localization above the 75% value was obtained for the right side, a line crossing the anatomically symmetric voxel to the left side activation was used instead. The speech dominant hemisphere could be determined individually for each patient using the following formula:
This implies that LI may range from −1 to +1. Positive LI values indicate left, negative values right hemispheric speech dominance.
Individual MR: Overlay
MEG results were superimposed on individual T1 weighted 3D MR (3D FLASH, FOV 250 mm × 250 mm with a 256 × 256 matrix, slice thickness 1.8 mm) images (Magnetom Open 0.2 Tesla, Siemens AG, Erlangen, Germany) using a contour fit program [Kober et al., 1995]. To achieve this we scanned the surface of the face and the back part of the patients' head by an electromagnetic 3D digitizer (Polhemus Navigation Sciences Inc., Colchester, VT) before the data acquisition. The digitized head shape was then fitted to the reconstructed head shape of the individual MR data set using an edge detection algorithm providing a co‐registration accuracy better than 2 mm [Kober et al., 1995].
RESULTS
Source Localization
After analysis of both tasks (silent naming + silent reading) we could localize by application of the CLSF procedure speech‐evoked cortical responses in areas corresponding to the sensory speech area (Wernicke) and the motor speech area (Broca) in all investigated patients and subjects. The Wernicke area activation was localized in the posterior part of the left superior temporal gyrus corresponding to the Brodmann areas (BA) 22 and 42, sometimes including the supramarginal gyrus (BA 40) and the posterior section of the middle temporal gyrus (BA 21). The Broca area activation was found in the posterior part of the left inferior frontal gyrus (BA 44) (Fig. 2). Using the single dipole model, which was performed in the subject's data only, source localization was not as successful as CLSF. For the silent naming task the CLSF evaluations showed activation in Wernicke area in all 10 measurements of the subjects. But only in eight of 10 silent naming measurements valid dipole localizations were obtained in Wernicke area. In all six silent reading experiments of the subjects we could localize Wernicke area by CLSF but only in three by the ECD approach. Taking into account the results of either the naming or the reading task, we could localize the Wernicke and the Broca area in all patients and subjects by CLSF. In the subjects, however, the Wernicke and the Broca area could only be localized by ECD in 90% and 62.5% respectively (Table II).
Figure 2.
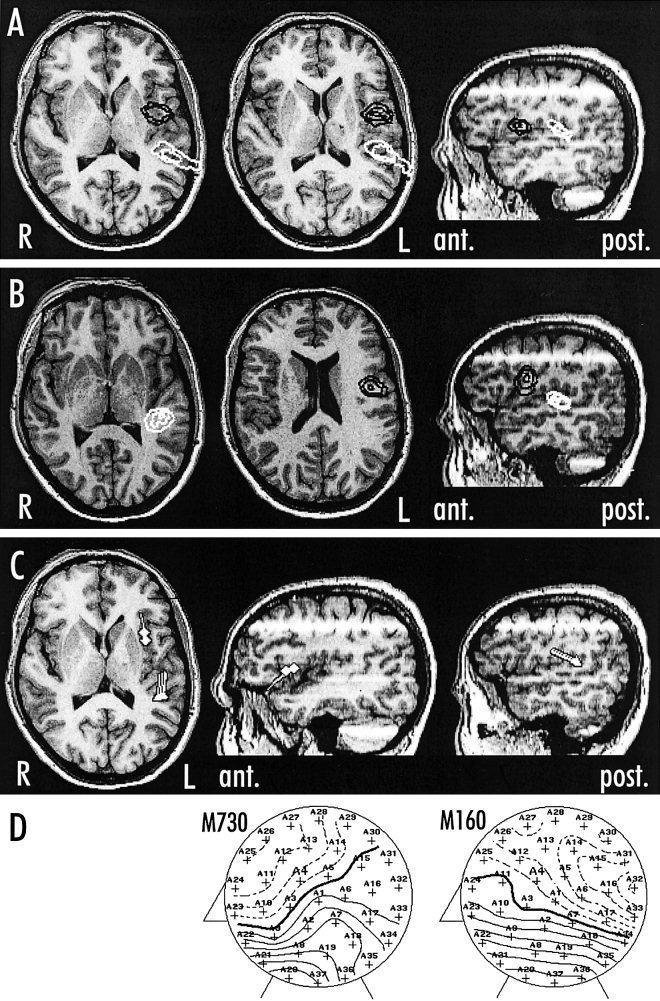
Axial and sagittal MR‐images results of a 31‐year‐old right‐handed male (mmf) showing MEG CLSF source localization of the Wernicke and Broca area in both experiments: silent naming (A) and silent reading (B). The CLSF current density distribution exceeding 75% is indicated by iso contour lines (distance between contour levels: 7.5%). The Wernicke area (white) was localized in the posterior part of the left superior temporal gyrus and the Broca area (black) in the left inferior frontal gyrus. Below the dipole localization and orientation of the naming task using the single dipole model (C) and the corresponding field maps with a line spacing of 20 fT (D) are displayed. Responses had a latency of 210 msec (A), 190 msec (B) and 160 msec (C,D) for Wernicke and 720 msec (A), 525 msec (B) and 730 msec (C,D) for Broca.
Table II.
Summary of localization results and latencies*
| ID | Latencies (“Silent Naming” task) | ID | Latencies (“Silent Reading” task) | Successful localization | ||||||||||||||
|---|---|---|---|---|---|---|---|---|---|---|---|---|---|---|---|---|---|---|
| Wernicke | Broca | Wernicke | Broca | Wernicke | Broca | |||||||||||||
| Side | CLSF | Dipole | Side | CLSF | Dipole | Side | CLSF | Dipole | Side | CLSF | Dipole | CLSF | Dipole | CLSF | Dipole | |||
| Subjects (n = 8) | ||||||||||||||||||
| gld01 | Left | 350 | 350 | Left | 530 | 530 | gld02 | Left | 300 | 300 | Left | 646 | 880 | S | S | S | S | |
| idb01 | Left | 640 | 860 | Left | 570 | 750 | idb02 | Left | 520 | 300 | Left | 600 | 650 | S | S | S | S | |
| kmb03 | Left | 300 | 310 | Left | 345 | — | kmb02 | Left | 485 | 317 | Left | 680 | 713 | S | S | S | S | |
| kpb04 | Left | 220 | 210 | — | — | kpb05 | Left | 245 | 210 | Left | 590 | — | S | S | S | F | ||
| mlf01 | Left | 350 | — | Left | 500 | — | mlf02 | Left | 500 | 620 | Left | 620 | — | S | S | S | F | |
| mmf23 | Left | 210 | 160 | Left | 720 | 730 | mmf24 | Left | 190 | — | Left | 575 | — | S | S | S | S | |
| mpb01 | Left | 360 | — | Left | 360 | — | S | F | S | F | ||||||||
| mpb03 | Left | 320 | 300 | Left | 360 | — | S | S | S | F | ||||||||
| ogb11 | Left | 580 | 390 | Left | 330 | 550 | S | S | S | S | ||||||||
| ogb12 | Left | 300 | 300 | Left | 360 | 345 | S | S | S | S | ||||||||
| Measurements | 10 | 10 | 8 | 9 | 5 | 6 | 6 | 5 | 6 | 3 | 16 | 13 | 15 | 8 | ||||
| Mean latency | 363.0 | 360.0 | 452.8 | 581.0 | 373.3 | 349.4 | 618.5 | 747.7 | ||||||||||
| SD | 140.6 | 214.9 | 135.0 | 165.8 | 145.2 | 157.0 | 39.0 | 118.9 | ||||||||||
| Patients (n = 7) | ||||||||||||||||||
| dpa01 | — | O | — | O | dpa02 | Left | 425 | O | Left | 497 | O | S | O | S | O | |||
| hhd01 | Left | 270 | O | Left | 540 | O | hhd02 | Left | 220 | O | Left | 490 | O | S | O | S | O | |
| hkh01 | Left | 330 | O | — | O | hkh02 | Left | 360 | O | Left | 1168 | O | S | O | S | O | ||
| hrc04 | Left | 525 | O | Left | 914 | O | hrc05 | Left | 520 | O | Left | 560 | O | S | O | S | O | |
| khd01 | Left | 360 | O | Left | 410 | O | khd02 | Left | 360 | O | — | O | S | O | S | O | ||
| tbb01 | Left | 260 | O | Left | 600 | O | tbb02 | Left | 360 | O | Left | 655 | O | S | O | S | O | |
| ugb01 | Left | 450 | O | Left | 710 | O | ugb02 | Left | 380 | O | — | O | S | O | S | O | ||
| Measurements | 7 | 6 | 5 | 7 | 7 | 5 | 13 | 10 | ||||||||||
| Mean latency | 365.8 | 634.8 | 375.0 | 674.0 | ||||||||||||||
| SD | 104.0 | 190.0 | 89.7 | 284.0 | ||||||||||||||
| Patients and subjects (n = 15) | ||||||||||||||||||
| Measurements | 17 | 16 | 14 | 13 | 13 | 11 | 29 | 25 | ||||||||||
| Mean latency | 364.1 | 517.8 | 374.2 | 643.7 | ||||||||||||||
| SD | 124.4 | 174.7 | 113.2 | 184.0 | ||||||||||||||
S, success; F, failure; O, omittance; SD, standard deviation; CLSF, current location by spatial filtering. All latencies in msec.
Time‐Course of Brain Activation
Latencies and the side of the strongest Wernicke and Broca activation obtained by CLSF and ECD are summarized in Table II. Within the analyzed time section of 0–1,500 msec several strong responses could be observed. The first prominent peak was found at latencies between 100–150 msec after the stimulus onset. Previous studies showed that this latency is typical for the visual response [Harding et al., 1994; Hashimoto et al., 1999; Portin et al., 1999; Supek et al., 1999]. We did not localize this response in our investigation because the occipital lobe was not covered sufficiently by the sensors during our measurements. Weaker sources could be found between 150 and 230 msec and were localized in the fusiform gyrus of the right hemisphere. Strong responses with clear phase reversals were identified in the section between 160–1,200 msec. In this time section according to the amplitude of the waveforms we distinguished an early and a late component (Fig. 1,3).
Figure 1.
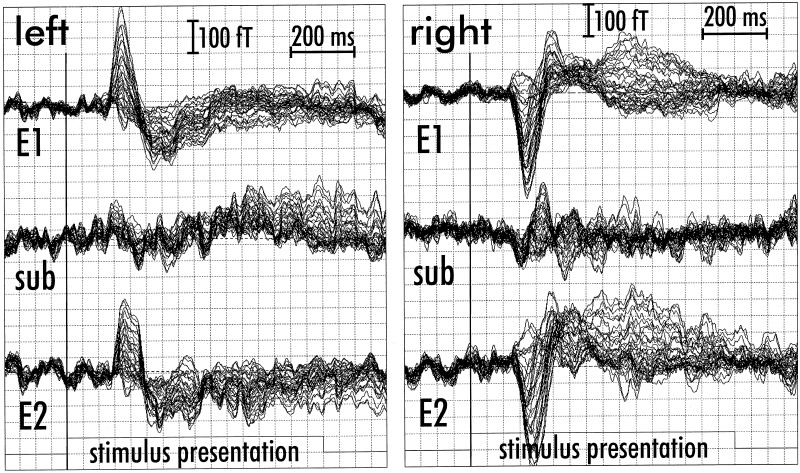
Seventy‐four channel MEG averaged data set of a silent reading measurement (subject mmf24) with 37 channels over the left and 37 channels over the right hemisphere. Stimulus presentation is indicated by the trigger channel. Upper traces: Average of 300 meaningful stimuli (E1). Middle traces: Subtraction result showing the difference between meaningful and meaningless stimuli (sub). Lower traces: Average of 150 meaningless stimuli (E2). Exceptionally, in this subject the amplitudes of averaged MEG traces are higher over the right hemisphere for the meaningful and the meaningless stimuli. But CLSF source localization revealed left hemispheric speech dominance (see Fig. 2) that is only suggested by the difference waveform.
Figure 3.
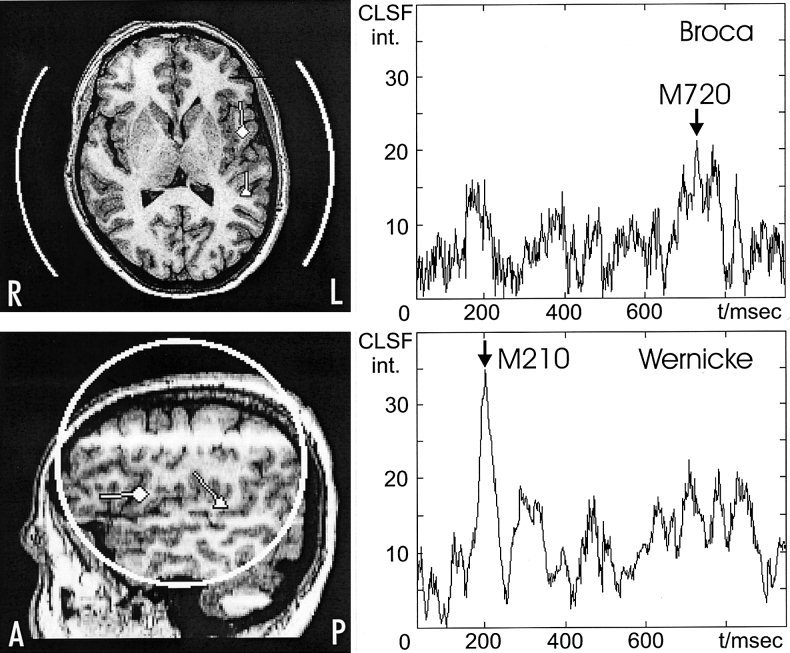
Left: Axial and sagittal MR images showing the location and orientation of the maximum CLSF intensity of the Wernicke (triangle, latency: 210 msec) and Broca (square, latency: 720 msec) localization of the silent naming task. Sensor positions and coverage of recording arrays are indicated by white circles. Right: Time‐course of the absolute value of CLSF intensity at the locations with maximum Wernicke and Broca activation.
In all investigated patients and subjects the earlier component was found between 160–640 msec. The corresponding CLSF sources could be localized in the posterior part of the superior temporal gyrus. The response also included the supramarginal gyrus in some cases. Sometimes the inferior and middle temporal gyrus and the angular gyrus were involved as well.
The mean latency of the early response was 364.1 msec after silent naming and 374.2 msec after silent reading. Only slight differences between subjects and patients were observed. Responses of the later component were found between 410 and 750 msec except in two patients (hrc04, hkh02) with very late responses of 914 and 1,168 msec. The mean Broca activation latency of patients and subjects was 517.8 msec for the silent naming and 643.7 msec for the silent reading. The mean Broca activation was delayed in patients compared to subjects in both tasks (Table II). The delay of the average CLSF Broca activation observed in the brain tumor patients compared to the subjects might be a result of the preoperatively existing speech disorders present in most of the patients. Further studies should clarify this assumption.
We also tried to localize Wernicke and Broca by applying the ECD model and succeeded in all eight subjects for the Wernicke area but only in five of eight subjects for the Broca area after analysis of the silent naming and the silent reading responses. Mean latencies of the best fitted dipoles over the Wernicke area were similar to the above mentioned CLSF latencies but dipole latencies over the Broca area were clearly later than CLSF latencies. This might be a problem of the single ECD model yielding valid localization only after the Wernicke activation has decayed.
In three subjects (kmb03, mpb01, ogb11) and one patient (khd01) a very early Broca activation at latencies between 330 and 410 msec was found almost simultaneously with the Wernicke activation. We repeated the same experiment in two subjects (mpb, ogb) 5 months later to confirm these results and to differentiate between an interindividual or an intraindividual phenomenon. The repeated experiment showed almost identical early Broca activation latencies at 330 and 360 msec in both subjects confirming the previous findings of an interindividual stable early Broca activation.
Comparing both paradigms an earlier response onset in the silent naming compared to the silent reading task was found for both the Wernicke and the Broca activation in patients and subjects.
Identification of the Speech‐Related Dominant Hemispheric Activity
We calculated the LI in all cases separately for the Wernicke and Broca area using the strongest CLSF result gained by analysis of all 74 channels of the left and right MEG probe together. All investigated patients and subjects had positive LI between 0.112 and 0.94 that indicated increased neuronal brain activity in the left Wernicke and the left Broca area compared to the homologous areas of the right hemisphere (Table III). We assume that higher activity in the Wernicke and Broca areas of the left compared to the right hemisphere reflects left hemispheric speech dominance. The only left‐handed patient showed positive LI values indicating left hemispheric speech dominance. Before surgery two patients underwent Wada testing that in concordance to our MEG results, proofed left hemispheric speech dominance (Fig. 4).
Table III.
Hemispheric speech dominance*
| ID | Wernicke | Broca | ||
|---|---|---|---|---|
| LI | Dominance | LI | Dominance | |
| Patients | ||||
| dpa | 0.7 | Left | 0.4 | Left |
| hhd | 0.9 | Left | 0.3 | Left |
| hkh | 1.0 | Left | 0.5 | Left |
| hrc | 0.9 | Left | 0.6 | Left |
| khd | 0.9 | Left | 0.9 | Left |
| tbb | 0.5 | Left | 0.3 | Left |
| ugb | 0.4 | Left | 0.4 | Left |
| Subjects | ||||
| gld | 0.8 | Left | 0.2 | Left |
| idb | 0.5 | Left | 0.1 | Left |
| kmb | 0.4 | Left | 0.8 | Left |
| kpb | 0.7 | Left | 0.3 | Left |
| mlf | 0.7 | Left | 0.4 | Left |
| mmf | 0.5 | Left | 0.6 | Left |
| mpb | 0.6 | Left | 0.2 | Left |
| ogb | 0.7 | Left | 0.5 | Left |
LI, laterality index (LI > 0: left hemispheric speech dominance).
Figure 4.
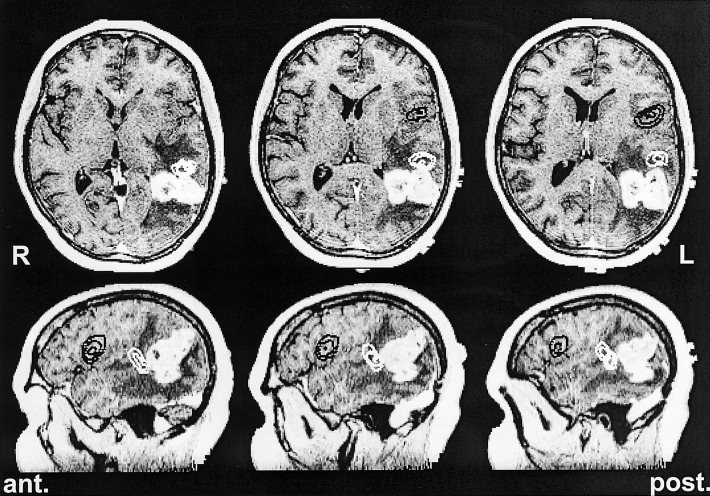
Gadolinium enhanced T1 weighted MR images of a 46‐year‐old right‐handed female (ugb) with a glioblastoma in the left angular gyrus (hyper density) surrounded by an edema (hypo density) immediately posterior to the Wernicke area. Upper row: Axial slices are ordered from left to right in inferior to superior direction. Lower row: sagittal slices are ordered from left to right in medial to lateral direction. The patient suffered from a dyscalculia, finger agnosia and a mild word finding disorder. The figure shows the CLSF localizations of the silent naming task (threshold: 75%, distance between contour levels: 7.5%). The Wernicke area (white iso contour lines) was localized in the left superior temporal gyrus, the Broca area (black iso contour lines) at the bottom of the left inferior frontal gyrus. The Wernicke activation was found 450 msec, the Broca response 710 msec after stimulus onset. After complete resection of the tumor an improvement of the preoperatively existing speech deficits could be observed.
DISCUSSION
We investigated the time‐course, localization, and hemispheric dominance of visually evoked speech‐related activity of the cortex by means of MEG.
Source Localization
The identification of the two main speech processing brain areas, the sensory speech area (Wernicke) and motor speech area (Broca), was successful in all patients and subjects. Our localization of the Wernicke area in the posterior part of the superior temporal gyrus and of the Broca area in the inferior frontal gyrus is supported by findings of previous evaluations using MEG [Kamada et al., 1998; Kuriki et al., 1999; Papanicolaou et al., 1999; Salmelin et al., 1994], fMRI [Binder et al., 1997] and PET [Paulesu et al., 1993]. Previous language studies using fMRI [Binder et al., 1997] and PET [Wise et al., 1991], however, sometimes showed wide extensions of the activated Wernicke and Broca area according to the classically assumed Wernicke and Broca area. Our findings constantly showed the maximum peak of the Wernicke activation immediately posterior of the Sylvian fissure and of the Broca activation at the bottom of the inferior frontal gyrus directly anterior of the precentral gyrus within Brodmann area 44. This is not only in agreement with a previous PET study where the same areas were activated during silent naming of pictograms of animals and tools [Martin et al., 1996] but is also supported by findings gained during electrocortical stimulation of the Broca area describing only a small area of the inferior frontal gyrus being constantly essential for language that is located anterior to the motor strip [Ojemann, 1979]. The additional stimulation of different areas within the extended “classical” Wernicke or Broca area showed great individual variability [Ojemann, 1979; Reulen et al., 1997]. The surgical removal of these additional areas did not necessarily result in a dysphasia that allows us to assume that these areas might be of secondary importance for speech production [Ojemann, 1979]. Further multimodal investigations and comparisons with results of electrocorticography are necessary to clarify this hypothesis.
Time‐Course
In the subjects and eight of the 15 patients the main Wernicke activation was found at a latency between 210 and 360 msec. This early speech‐related activation is in good concordance with previously presented studies and may be related to the mental analysis of the meaning of a word [Kuriki et al., 1996]. In 11 cases the main Broca activation was found between 490 msec and 1,168 msec after the stimulus onset. These results are in accordance to the Wernicke Geschwind model ascribing that the sensory speech area is activated first and thereafter the motor speech area that is connected to the Wernicke area via the arcuate fascicle [Kolb and Whishaw, 1989]. In three subjects and one patient, however, we found another time‐course as postulated by the Wernicke Geschwind Model. In three cases, we even found the main Broca activation already between 345 msec and 410 msec intraindividually confirmed by a second measurement 5 months later. Weaker Wernicke responses were sometimes found later than 360 msec but in three cases the maximum Wernicke activation was found between 525 msec and 640 msec. This might reflect that not necessarily first the posterior part of the superior temporal gyrus is activated but also the Broca area can be activated very early by a direct fiber connection. This is a phenomenon that has to be clarified in further studies. Anatomical studies showed the existence of these direct monosynaptic heterotopic connections between the inferior temporal cortex and the Wernicke and Broca area. This means that higher visual and speech areas are directly linked and can be activated in parallel [Di Virgilio et al., 1999].
Further evidence of an early Broca activation during word recognition has been reported before in invasive cortical EcOG recordings where multiple components were occasionally recorded in the left inferior frontal gyrus peaking from 280 to 900 msec, and were apparently specific to words [Halgren et al., 1994].
We could not identify the Wernicke area in one case and the Broca area in four cases by analyzing the data of the silent reading and the silent naming measurement. Several methodological and technical reasons might be responsible for that. The patients' attention could be unsatisfactory especially as the measurement took place in a dark room with a long duration of 20 min each. Additionally, the preparation time took approximately 15 min that was necessary to position the patient and the sensors and to install the ECG and the EOG electrodes. Regarding the conus shape of the sensor sensitivity profile, with a decreasing diameter in the depth of the brain also the actual diameter of 144 mm of our MEG sensor devices could be too small to cover both the Wernicke and Broca area together in one measurement alone, if not exactly positioned. Precise adjustment of MEG sensors, therefore, is essential to cover the activity from both speech areas. In our experience, the optimal position of the center of the sensors was approximately 4 cm cranial and 2 cm anterior of the preauricular point. This problem of a small sensor array is of course only specific to our Magnes II system and might be no problem of whole‐head MEG devices. Identification of the Broca area by MEG was reported to be difficult even performed with whole‐head biomagnetic devices using the ECD approach [Papanicolaou et al., 1999].
We increased the number of meaningful stimuli up to 350 but nevertheless we were successful in only five of eight subjects to localize Broca by ECD. In our experience, the application of the equivalent single dipole model for the data analysis of higher cognitive functions is not always feasible and a multi‐dipole approach would be more appropriate. In contrast to early evoked fields after simple sensory, motor, and visual stimuli, not only one prominent area but multiple cortical areas are active at the same time during speech processing. Multiple simultaneously active sources can not be resolved by single ECD sufficiently. Current density localization improves the rate of successful localization of the Wernicke and especially of the Broca area significantly. In all subject measurements, the Wernicke, and in all but one measurement, the Broca area, could be successfully localized by CLSF. This was true even in 10 measurements in which the localization of Wernicke (n = 3) or Broca area (n = 7) by using the single ECD failed. Obviously the later Broca activation might be concealed by the superposition of other simultaneously‐activated sources. A specific tool that is able to resolve multiple active sources like CLSF is better suited to localize the late activation in the Broca area.
To enhance the signal‐to‐noise ratio the choice of the filter is of great importance. Filtering offers the possibility of reducing the biological and technical noise, but it bears the risk of diminishing the responses induced by the stimulus. We first tried to process the data acquired with a 0.1 Hz high‐pass filter without additional filtering (except a notch filter at 50 Hz). Only if the low frequency noise level was too high and no localization could be gained was the averaged data set filtered using high pass filters with 0.25 Hz, 0.5 Hz, or even 1.0 Hz. In most cases, however, a high pass cut‐off frequency at 1.0 Hz revealed to be too high and almost no speech relevant responses were left after filtering. We put the most emphasis on the localization analysis of the meaningful data set. We also performed the subtraction of the averaged meaningless from the averaged meaningful data set in all investigated cases. In three cases the Wernicke and Broca area could only be localized when using the subtracted data set (meaningful − meaningless). Although cortical activity can not be considered to show a linear behavior in general, task subtraction paradigms are commonly used in other functional imaging modalities like PET or fMRI to enhanced task‐specific activation. In MEG, this subtraction procedure was successfully applied to investigate speech relevant brain activity [Kamada et al., 1998]. To reliably localize from a difference waveform between an activation and a control condition, however, one has to be certain that the two conditions are exactly the same (source areas, activation strength and time‐course) except for those sources that are of interest during the activation task. Although we got an expected result in the three cases investigated, we can not prove that our subtraction approach is correct. A CLSF analysis using a covariance matrix‐based subtraction approach that only requires that the time‐average of the squared intensity of interference be equal between the two measurements might be more appropriate than conventional waveform‐based subtraction [Sekihara et al., 1998].
Lateralization
Our findings of left speech dominance in all investigated patients and subjects (including the left‐handed subject) support the observation of left hemispheric asymmetry among most left‐ and right‐handers. Moreover, the tumor‐related language deficits observed in all patients underline the validity of our results concerning left hemispheric speech dominance. Right dominance has been found rarely in clinical and functional imaging studies using PET [Vinas et al., 1997], fMRI [Yetkin et al., 1995] and MEG [Papanicolaou et al., 1999] but it was not found in our 15 investigated cases. Left lateralization of speech dominance was found before by fMRI [Frost et al., 1999; van der Kallen et al., 1998; Yetkin et al., 1995] and PET [Warburton et al., 1996] studies. The results, however, quantify the hemispheric dominance indirectly by an increase of blood flow in activated vs. non‐activated brain tissues based on a statistical voxel–voxel comparison of the sum of activated voxels. The comparison does not necessarily refer to voxels located exactly in the Wernicke or Broca area but reflects the hemispheric activation in total. In contrast, MEG measures the neuronal activity of brain cells directly. Previous MEG studies found stronger left hemispheric than right hemispheric sources [Salmelin et al., 1994] and identified the dominant hemisphere by comparison of the number of dipolar sources [Papanicolaou et al., 1999]. Using the spatial filter approach, we could also directly quantify the strength of brain activation in the Wernicke and Broca area. The calculation of a laterality index (LI) that is based on the strength of CLSF activity in the left and right hemisphere across the Wernicke and Broca areas allows us to determine a measure that is likely to be related to the speech hemispheric dominance.
We conclude that MEG is a valuable tool to investigate both the time‐course of speech evoked cortex activation as well as the localization of the main speech areas (Wernicke and Broca). MEG is a completely noninvasive modality that is not only of high value for neurophysiological research but also an important clinical tool to support the presurgical localization of speech eloquent brain areas and the identification of the speech dominant hemisphere in brain tumor patients.
Acknowledgements
We thank Mrs. C. Erlwein and Mrs. D. Becher for their technical assistance.
REFERENCES
- Baciu MV, Rubin C, Decorps MA, Segebarth CM (1999): fMRI assessment of hemispheric language dominance using a simple inner speech paradigm. NMR Biomed 12: 293–298. [DOI] [PubMed] [Google Scholar]
- Backus G, Gilbert F (1970): Uniqueness in the inversion of inaccurate gross earth data. Philos Trans R Soc Lond A 266: 123–192. [Google Scholar]
- Binder JR, Frost JA, Hammeke TA, Cox RW, Rao SM, Prieto T (1997): Human brain language areas identified by functional magnetic resonance imaging. J Neurosci 17: 353–362. [DOI] [PMC free article] [PubMed] [Google Scholar]
- Bookheimer SY, Zeffiro TA, Blaxton T, Malow BA, Gaillard WD, Sato S, Kufta C, Fedio P, Theodore WH (1997): A direct comparison of PET activation and electrocortical stimulation mapping for language localization. Neurology 48: 1056–1065. [DOI] [PubMed] [Google Scholar]
- Cuenod CA, Bookheimer SY, Hertz‐Pannier L, Zeffiro TA, Theodore WH, Le BD (1995): Functional MRI during word generation, using conventional equipment: a potential tool for language localization in the clinical environment. Neurology 45: 1821–1827. [DOI] [PubMed] [Google Scholar]
- Demonet JF, Price C, Wise R, Frackowiak RS (1994): A PET study of cognitive strategies in normal subjects during language tasks. Influence of phonetic ambiguity and sequence processing on phoneme monitoring. Brain 117: 671–682. [DOI] [PubMed] [Google Scholar]
- Di Virgilio G, Clarke S, Pizzolato G, Schaffner T (1999): Cortical regions contributing to the anterior commissure in man. Exp Brain Res 124: 1–7. [DOI] [PubMed] [Google Scholar]
- Elbert T (1998): Biomagnetism In: Andrä W, Nowak H, editors. Magnetism in medicine, 1st edition Berlin: Wiley‐VCH; p. 262–285. [Google Scholar]
- Eulitz C, Elbert T, Bartenstein P, Weiller C, Muller SP, Pantev C (1994): Comparison of magnetic and metabolic brain activity during a verb generation task. Neuroreport 6: 97–100. [DOI] [PubMed] [Google Scholar]
- Frost JA, Binder JR, Springer JA, Hammeke TA, Bellgowan PS, Rao SM, Cox RW (1999): Language processing is strongly left lateralized in both sexes. Evidence from functional MRI. Brain 122: 199–208. [DOI] [PubMed] [Google Scholar]
- Gallen CC, Schwartz B, Rieke K, Pantev C, Sobel D, Hirschkoff E, Bloom FE (1994): Intrasubject reliability and validity of somatosensory source localization using a large array biomagnetometer. Electroencephalogr Clin Neurophysiol 90: 145–156. [DOI] [PubMed] [Google Scholar]
- Ganslandt O, Fahlbusch R, Nimsky C, Kober H, Möller M, Steinmeier R, Romstöck J, Vieth J (1999): Functional neuronavigation with magnetoencephalography: outcome in 50 patients with lesions around the motor cortex. J Neurosurg 91: 73–79. [DOI] [PubMed] [Google Scholar]
- Ganslandt O, Ulbricht D, Kober H, Vieth J, Strauss C, Fahlbusch R (1996): SEF‐MEG localization of somatosensory cortex as a method for presurgical assessment of functional brain area. Electroencephalogr Clin Neurophysiol 46(Suppl): 209–213. [PubMed] [Google Scholar]
- Geschwind N (1970): The organization of language and the brain. Science 170: 940–944. [DOI] [PubMed] [Google Scholar]
- Gharib S, Sutherling WW, Nakasato N, Barth DS, Baumgartner C, Alexopoulos N, Taylor S, Rogers RL (1995): MEG and ECoG localization accuracy test. Electroencephalogr Clin Neurophysiol 94: 109–114. [DOI] [PubMed] [Google Scholar]
- Grummich P, Kober H, Vieth J, Matschke J, Ganslandt O (1994): Sensory speech area investigated by Magnetoencephalography. Biomed Eng 39(Suppl): 129–130. [Google Scholar]
- Halgren E, Baudena P, Heit G, Clarke JM, Marinkovic K, Chauvel P, Clarke M (1994): Spatio‐temporal stages in face and word processing. II. Depth‐recorded potentials in the human frontal and Rolandic cortices [published erratum appears in J Physiol Paris 1994; 88:151]. J Physiol Paris 88: 51–80. [DOI] [PubMed] [Google Scholar]
- Harding GF, Degg C, Anderson SJ, Holliday I, Fylan F, Barnes G, Bedford J (1994): Topographic mapping of the pattern onset evoked magnetic response to stimulation of different portions of the visual field. Int J Psychophysiol 16: 175–183. [DOI] [PubMed] [Google Scholar]
- Hashimoto T, Kashii S, Kikuchi M, Honda Y, Nagamine T, Shibasaki H (1999): Temporal profile of visual evoked responses to pattern‐reversal stimulation analyzed with a whole‐head magnetometer. Exp Brain Res 125: 375–382. [DOI] [PubMed] [Google Scholar]
- Helenius P, Salmelin R, Service E, Connolly JF (1998): Distinct time‐courses of word and context comprehension in the left temporal cortex. Brain 121: 1133–1142. [DOI] [PubMed] [Google Scholar]
- Inoue T, Shimizu H, Nakasato N, Kumabe T, Yoshimoto T (1999): Accuracy and limitation of functional magnetic resonance imaging for identification of the central sulcus: comparison with magnetoencephalography in patients with brain tumors. Neuroimage 10: 738–748. [DOI] [PubMed] [Google Scholar]
- Joliot M, Crivello F, Badier JM, Diallo B, Tzourio N, Mazoyer B (1998): Anatomical congruence of metabolic and electromagnetic activation signals during a self‐paced motor task: a combined PET‐MEG study. Neuroimage 7: 337–351. [DOI] [PubMed] [Google Scholar]
- Kamada K, Kober H, Saguer M, Möller M, Kaltenhäuser M, Vieth J (1998): Responses to silent Kanji reading of the native Japanese and German in task subtraction magnetoencephalography. Cogn Brain Res 7: 89–98. [DOI] [PubMed] [Google Scholar]
- Kato A, Ninomiya H, Hirata M, Nii Y, Taniguchi M, Hirano S, Mano T, Imai K, Kumura E, Nakamura H, Robinson SE, Yoshimine T (2000): Usefulness of synthetic aperture magnetometry for presurgical evaluation in the epilepsy surgery. Paper presented at the 12th International Conference on Biomagnetism, Espoo, Finland.
- Kober H, Grummich P, Vieth J (1995): Fit of the digitized head surface with the surface reconstructed from MRI tomography In: Baumgartner C, editor. Biomagnetism: fundamental research and clinical applications. Amsterdam: Elsevier Science, IOS Press; p. 309–312. [Google Scholar]
- Kolb B, Whishaw IQ (1989): Language In: Atkinson RC, Lindzey G, Thompson RF, editors. Fundamentals of human neuropsychology, 3rd ed. New York: W.H. Freeman and Company; p. 568–604. [Google Scholar]
- Kuriki S, Hirata Y, Fujimaki N, Kobayashi T (1996): Magnetoencephalographic study on the cerebral neural activities related to the processing of visually presented characters. Brain Res Cogn Brain Res 4: 185–199. [DOI] [PubMed] [Google Scholar]
- Kuriki S, Mori T, Hirata Y (1999): Motor planning center for speech articulation in the normal human brain. NeuroReport 10: 765–769. [DOI] [PubMed] [Google Scholar]
- Leahy RM, Mosher JC, Spencer ME, Huang MX, Lewine JD (1998): A study of dipole localization accuracy for MEG and EEG using a human skull phantom. Electroencephalogr Clin Neurophysiol 107: 159–173. [DOI] [PubMed] [Google Scholar]
- Levelt WJ, Praamstra P, Meyer AS, Helenius P, Salmelin R (1998): An MEG study of picture naming. J Cogn Neurosci 10: 553–567. [DOI] [PubMed] [Google Scholar]
- Martin A, Wiggs CL, Ungerleider LG, Haxby JV (1996): Neural correlates of category‐specific knowledge. Nature 379: 649–652. [DOI] [PubMed] [Google Scholar]
- Morioka T, Mizushima A, Yamamoto T, Tobimatsu S, Matsumoto S, Hasuo K, Fujii K, Fukui M (1995): Functional mapping of the sensorimotor cortex: combined use of magnetoencephalography, functional MRI, and motor evoked potentials. Neuroradiology 37: 526–530. [DOI] [PubMed] [Google Scholar]
- Muller RA, Rothermel RD, Behen ME, Muzik O, Mangner TJ, Chugani HT (1997): Receptive and expressive language activations for sentences: a PET study. Neuroreport 8: 3767–3770. [DOI] [PubMed] [Google Scholar]
- Nakai T, Matsuo K, Kato C, Matsuzawa M, Okada T, Glover GH, Moriya T, Inui T (1999): A functional magnetic resonance imaging study of listening comprehension of languages in human at 3 Tesla‐comprehension level and activation of the language areas. Neurosci Lett 263: 33–36. [DOI] [PubMed] [Google Scholar]
- Nimsky C, Ganslandt O, Kober H, Möller M, Ulmer S, Tomandl B, Fahlbusch R (1999): Integration of functional magnetic resonance imaging supported by magnetoencephalography in functional neuronavigation. Neurosurgery 44: 1249–1256. [DOI] [PubMed] [Google Scholar]
- Ojemann GA (1979): Individual variability in cortical localization of language. J Neurosurg 50: 164–169. [DOI] [PubMed] [Google Scholar]
- Ojemann GA (1991): ) Cortical organization of language. J Neurosci 11: 2281–2287. [DOI] [PMC free article] [PubMed] [Google Scholar]
- Ojemann GA, Creutzfeldt O, Lettich E, Haglund MM (1988): Neuronal activity in human lateral temporal cortex related to short‐term verbal memory, naming and reading. Brain 111: 1383–1403. [DOI] [PubMed] [Google Scholar]
- Okada YC, Wu J, Kyuhou S (1997): Genesis of MEG signals in a mammalian CNS structure. Electroencephalogr Clin Neurophysiol 103: 474–485. [DOI] [PubMed] [Google Scholar]
- Oldfield RC (1971): The assessment and analysis of handedness: the Edinburgh inventory. Neuropsychologia. 9: 97–113. [DOI] [PubMed] [Google Scholar]
- Papanicolaou AC, Simos PG, Breier JI, Zouridakis G, Willmore LJ, Wheless JW, Constantinou JE, Maggio WW, Gormley WB (1999): Magnetoencephalographic mapping of the language‐specific cortex. J Neurosurg 90: 85–93. [DOI] [PubMed] [Google Scholar]
- Paulesu E, Frith CD, Frackowiak RS. 1993. The neural correlates of the verbal component of working memory. Nature 362: 342–345. [DOI] [PubMed] [Google Scholar]
- Penfield W, Roberts L (1959): Speech and brain mechanisms. Princeton: Princeton University Press. [Google Scholar]
- Portin K, Vanni S, Virsu V, Hari R (1999): Stronger occipital cortical activation to lower than upper visual field stimuli. Neuromagnetic recordings. Exp Brain Res 124: 287–294. [DOI] [PubMed] [Google Scholar]
- Price CJ, Wise RJ, Warburton EA, Moore CJ, Howard D, Patterson K, Frackowiak RS, Friston KJ (1996): Hearing and saying. The functional neuro‐anatomy of auditory word processing. Brain 119: 919–931. [DOI] [PubMed] [Google Scholar]
- Reulen HJ, Schmid UD, Ilmberger J, Eisner W, Bise K (1997): Tumor surgery of the speech cortex in local anesthesia. Neuropsychological and neurophysiological monitoring during operations in the dominant hemisphere. Nervenarzt 68: 813–824. [DOI] [PubMed] [Google Scholar]
- Rezai AR, Hund M, Kronberg E, Zonenshayn M, Cappell J, Ribary U, Kall B, Llinas R, Kelly PJ (1996): The interactive use of magnetoencephalography in stereotactic image‐guided neurosurgery. Neurosurgery 39: 92–102. [DOI] [PubMed] [Google Scholar]
- Roberts TP, Zusman E, McDermott M, Barbaro N, Rowley HA (1995): Correlation of functional magnetic source imaging with intraoperative cortical stimulation in neurosurgical patients. J Image Guid Surg 1: 339–347. [DOI] [PubMed] [Google Scholar]
- Robinson SE (1991): Magnetoencephalography by lead field synthesis. US Air Force Report F33615‐89‐C‐0577: 1–36.
- Robinson SE (1997): Functional imaging of language cortex by MEG. Paper presented at the The Japanese Biomagnetism Conference, Japan.
- Robinson SE, Rose DG (1992): Current source image estimation by spatially filtered MEG In: Hoke M, Erné SN, Okada YC, Romani GL, editors. Biomagnetism: clinical aspects. Amsterdam: Elsevier; p. 761–765. [Google Scholar]
- Salmelin R, Hari R, Lounasmaa OV, Sams M (1994): Dynamics of brain activation during picture naming. Nature 368: 463–465. [DOI] [PubMed] [Google Scholar]
- Sekihara K, Poeppel D, Marantz A, Koizumi H, Miyashita Y (1998): Comparison of covariance‐based and waveform‐based subtraction methods in removing the interference from button‐pressing finger movements. Brain Topogr 11: 95–102. [DOI] [PubMed] [Google Scholar]
- Simos PG, Breier JI, Maggio WW, Gormley WB, Zouridakis G, Willmore LJ, Wheless JW, Constantinov JE, Papanicolaou AC (1999): Atypical temporal lobe language representation: MEG and intraoperative stimulation mapping correlation. Neuroreport 10: 139–142. [DOI] [PubMed] [Google Scholar]
- Sobel DF, Gallen CC, Schwartz BJ, Waltz TA, Copeland B, Yamada S, Hirschkoff EC, Bloom FE (1993): Locating the central sulcus: comparison of MR anatomic and magnetoencephalographic functional methods [see comments]. AJNR Am J Neuroradiol 14: 915–925. [PMC free article] [PubMed] [Google Scholar]
- Stippich C, Freitag P, Kassubek J, Soros P, Kamada K, Kober H, Scheffler K, Hopfengartner R, Bilecen D, Radu EW, Vieth JB (1998): Motor, somatosensory and auditory cortex localization by fMRI and MEG. Neuroreport 9: 1953–1957. [DOI] [PubMed] [Google Scholar]
- Supek S, Aine CJ, Ranken D, Best E, Flynn ER, Wood CC (1999): Single vs. paired visual stimulation: superposition of early neuromagnetic responses and retinotopy in extrastriate cortex in humans. Brain Res 830: 43–55. [DOI] [PubMed] [Google Scholar]
- Tarkiainen A, Helenius P, Hansen PC, Cornelissen PL, Salmelin R (1999): Dynamics of letter string perception in the human occipitotemporal cortex. Brain 122: 2119–2132. [DOI] [PubMed] [Google Scholar]
- van der Kallen B, Morris GL, Yetkin FZ, van EL, Thijssen HO, Haughton VM (1998): Hemispheric language dominance studied with functional MR: preliminary study in healthy volunteers and patients with epilepsy. AJNR Am J Neuroradiol 19: 73–77. [PMC free article] [PubMed] [Google Scholar]
- Van Veen BD, van Drongelen W, Yuchtman M, Suzuki A (1997): Localization of brain electrical activity via linearly constrained minimum variance spatial filtering. IEEE Trans Biomed Eng 44: 867–880. [DOI] [PubMed] [Google Scholar]
- Vinas FC, Zamorano L, Mueller RA, Jiang Z, Chugani H, Fuerst D, Muzik O, Mangner TJ, Diaz FG (1997): [15O]‐water PET and intraoperative brain mapping: a comparison in the localization of eloquent cortex. Neurol Res 19: 601–608. [DOI] [PubMed] [Google Scholar]
- Wada J, Rasmussen T (1960): Intracarotid injection of sodium amytal for the lateralization of cerebral speech dominance. J Neurosurg 17: 266–282. [DOI] [PubMed] [Google Scholar]
- Warburton E, Wise RJ, Price CJ, Weiller C, Hadar U, Ramsay S, Frackowiak RS (1996): Noun and verb retrieval by normal subjects. Studies with PET. Brain 119: 159–179. [DOI] [PubMed] [Google Scholar]
- Wise R, Chollet F, Hadar U, Friston K, Hoffner E, Frackowiak R (1991): Distribution of cortical neural networks involved in word comprehension and word retrieval. Brain 114: 1803–1817. [DOI] [PubMed] [Google Scholar]
- Xiong J, Rao S, Gao JH, Woldorff M, Fox PT (1998): Evaluation of hemispheric dominance for language using functional MRI: a comparison with positron emission tomography. Hum Brain Mapp 6: 42–58. [DOI] [PMC free article] [PubMed] [Google Scholar]
- Yetkin FZ, Hammeke TA, Swanson SJ, Morris GL, Mueller WM, McAuliffe TL, Haughton VM (1995): A comparison of functional MR activation patterns during silent and audible language tasks. AJNR Am J Neuroradiol 16: 1087–1092. [PMC free article] [PubMed] [Google Scholar]
- Zouridakis G, Simos PG, Breier JI, Papanicolaou AC (1998): Functional hemispheric asymmetry assessment in a visual language task using MEG. Brain Topogr 11: 57–65. [DOI] [PubMed] [Google Scholar]