

Abstract
Real‐time fMRI is a rapidly emerging methodology that enables monitoring changes in brain activity during an ongoing experiment. In this article we demonstrate the feasibility of performing single‐event sensory, motor, and higher cognitive tasks in real‐time on a clinical whole‐body scanner. This approach requires sensitivity optimized fMRI methods: Using statistical parametric mapping we quantified the spatial extent of BOLD contrast signal changes as a function of voxel size and demonstrate that sacrificing spatial resolution and readout bandwidth improves the detection of signal changes in real time. Further increases in BOLD contrast sensitivity were obtained by using real‐time multi‐echo EPI. Real‐time image analysis was performed using our previously described Functional Imaging in REal time (FIRE) software package, which features real‐time motion compensation, sliding window correlation analysis, and automatic reference vector optimization. This new fMRI methodology was validated using single‐block design paradigms of standard visual, motor, and auditory tasks. Further, we demonstrate the sensitivity of this method for online detection of higher cognitive functions during a language task using single‐block design paradigms. Finally, we used single‐event fMRI to characterize the variability of the hemodynamic impulse response in primary and supplementary motor cortex in consecutive trials using single movements. Real‐time fMRI can improve reliability of clinical and research studies and offers new opportunities for studying higher cognitive functions. Hum. Brain Mapping 12:25–41, 2001. © 2001 Wiley‐Liss, Inc.
Keywords: fMRI, real‐time, single trial, event related, multi‐echo, EPI, motor, visual, auditory, language
INTRODUCTION
A major limitation for applications of functional MR imaging has been the use of blocked task design, which requires use of repetitive tasks performed in close succession. Recently, a number of investigators have shown that event‐related blood‐oxygenation‐ level‐dependent (BOLD) fMRI signals can be measured [Savoy et al., 1995; Boynton et al., 1996; Konishi et al., 1996; Buckner et al., 1996; Dale and Buckner 1997], which allows entirely new task designs, similar to those used in EEG and MEG, to study event‐related potentials (ERPs). Most recently, Liu and Gao [1999] have shown that perfusion‐based event‐related MRI signals can also be detected. However, this class of fMRI experiments requires multiple repetitions of the task to obtain sufficient signal‐to‐noise ratios to generate functional images and requires that tasks can be repeated with a high degree of accuracy. Recently, it has been shown that nonstationarities of fMRI signals that may be linked to nonstationary behavior can be detected in auditory cortex [Gaschler‐Markefski et al., 1997]. It is thus desirable to design fMRI methods that can monitor changes in brain activation between single trials.
During recent years the sensitivity of fMRI data acquisition methods has been continuously improved and changes in brain activity (e.g., in motor and visual cortex) can now be detected within a few minutes of data acquisition. These advances stimulated the development of “real‐time fMRI” [Cox et al., 1995; Goddard et al., 1997; Lee et al., 1998; Gering and Weber 1998; Cohen et al., 1998; Frank et al., 1999; Voyvodic 1999; Yoo et al., 1999; Gembris et al., 2000], which is characterized by steady state data acquisition, image reconstruction, motion correction, and statistical image analysis during the ongoing scan, preferably with a time delay of less than a single TR cycle. With real‐time fMRI the delay between task initiation and clear display of involved cortical areas is no longer determined by computation time. Instead, it is determined by physiologically delayed signal response (≈ 3–6 sec) and necessary accumulation time of data due to limited signal‐to‐noise ratio (SNR). In contrast to most previous approaches for real‐time fMRI, which used cumulative statistical methods (Fig. 1a) and modified hardware, we have developed data processing methods for Functional Imaging in REal time (FIRE) on a standard clinical whole‐ body scanner, which enables continuous monitoring of fMRI signal changes during the ongoing scan with constant sensitivity. These methods include real‐time image transfer and display [Schor et al., 1998], “sliding‐window” correlation analysis (Fig. 1b) [Gembris et al., 2000], reference vector optimization [Gembris et al., 2000], and real‐time motion correction [Mathiak and Posse, 2000].
Figure 1.
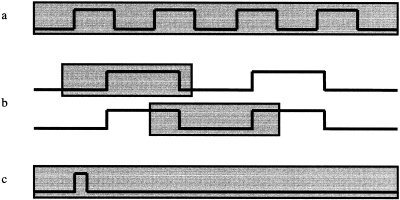
Data analysis methods: (a) Conventional multiple‐block design paradigm to assess effect of voxel size on functional sensitivity, (b) real‐time sliding window paradigm displaying the sliding window at two consecutive time points during the ongoing scan, (c) real‐time single‐event paradigm. The gray shading indicates the width of the sliding window.
In this article we demonstrate the feasibility of monitoring single‐event sensory, motor, and higher cognitive tasks in real‐time on a clinical whole‐body scanner using sensitivity optimized real‐time fMRI methods and FIRE. The development of sensitivity optimized single‐shot EPI methods was essential for this new approach. Using statistical parametric mapping the spatial extent and maximum Z‐scores of BOLD contrast signal changes were quantified as a function of spatial resolution and readout bandwidth over a wide range of voxel sizes. It is shown that the spatial extent strongly increases with decreasing spatial resolution and readout bandwidth, which is advantageous for detecting signal changes in real‐time. We also investigated the feasibility of real‐time multi‐echo EPI to further increase BOLD contrast sensitivity [Posse et al., 1999d]. In a first series of experiments the methodology was validated by detecting in real‐time brain activity extending over only a few seconds in the visual, auditory, and motor system. In a second series of experiments the feasibility of real‐time monitoring dynamic changes in higher brain functions using a language task was demonstrated. Activation of language eloquent areas was reliably detected during the performance of the standard word generation task. In a third series of experiments the feasibility of detecting single‐stimulus bound brain activity in real‐time in the motor system was investigated using single finger taps and single brisk and uncommon movements (Fig. 1c). The aim was to characterize the variability of the hemodynamic response in primary and supplementary motor cortex during repeated trials. Because the method allowed for detection of activation patterns in motor areas by a single movement, we were particularly interested in rapid changes of such activation patterns due to short‐term habituation (or adaptation) mechanisms. For this purpose we compared the activity in primary and secondary motor areas in subsequent performance of an uncommon movement.
Preliminary accounts of some of this work have been presented as abstracts [Behr et al., 1997; Posse et al., 1998a, 1998b, 1999a, 1999b, 1999c].
THEORY: OPTIMIZATION OF FMRI SENSITIVITY
Spatial resolution is a major factor that influences the ability to detect and delineate activated areas [Menon et al., 1997; Thulborn et al., 1997]. It has been shown that both amplitude and spatial extent of activation determine the statistical significance of functional signal changes [Friston et al., 1994]. Although increasing spatial resolution may seem to be desirable, it strongly decreases SNR and increases sensitivity to motion artifacts. Several authors using a variety of techniques described increases in signal change and decreases in the extent of activation with increasing spatial resolution, which were attributed to reduced partial volume effects and reduced signal‐to‐noise ratio (SNR) [Frahm et al., 1993; Meyer et al., 1994; Thompson et al., 1994]. However, it has not yet been investigated in detail how spatial resolution affects the sensitivity to detect small signal changes, which are typically associated with single trials and higher cognitive functions. The wide range of techniques and voxel sizes currently used with fMRI reflects the compromises that have been made between sensitivity and temporal and spatial resolution. Comparisons between studies regarding the extent and statistical significance of the activation associated with a specific task are difficult under these conditions.
Consider SNR of single‐shot EPI as a function of voxel size (ΔxΔyΔz), readout bandwidth per voxel (Δv voxel), and matrix size N pe N ro [Reeder and McVeigh, 1994]:
| (1) |
When comparing two methods for increasing SNR, increasing the voxel size by data acquisition and image filtering using spatial convolution or k‐space filters [Lowe and Sorenson, 1997], it becomes evident that the former has specific advantages: For example, increasing the linear pixel dimensions in plane by a factor of 2, using the same readout bandwidth per voxel and a four‐fold smaller matrix size increases SNR by  At the same time, the data acquisition time is reduced by a factor of 2. Further sensitivity can be gained by maintaining the original data acquisition time: Reducing the readout bandwidth by a factor of two or using two‐fold readout over sampling [Yang et al., 1996] increases SNR by a factor of
  . The latter approach has the advantage that geometrical distortions are not increased. The combined gain in SNR is thus four‐fold, neglecting relaxation effects, which change the analysis only slightly. By contrast, doubling the pixel dimensions using a boxcar k‐space filter (or equivalent spatial filter), improves the SNR only by a factor of 2.
In addition to improving SNR, increasing the voxel size strongly increases the extent of spatial dephasing around microscopic susceptibility inhomogeneities. We have demonstrated this characteristic of gradient echo imaging using computer simulations and measurements on water phantoms [Posse and Aue, 1990]. In that study we computed the integrated signal loss in the vicinity of the susceptibility inhomogeneity and normalized it to the integrated signal intensity in the absence of the susceptibility inhomogeneity. This parameter was converted into an effective area of total signal loss and divided by the actual cross section of the susceptibility inhomogeneity to yield a parameter, which we termed artifact enhancement factor (AEF) and which is independent of partial volume effect. The AEF decreases nonlinearly with increasing spatial resolution [Posse and Aue, 1990] (Fig. 6) and increases with decreasing diameter of the susceptibility inhomogeneity [Posse and Aue, 1990] (Fig. 8) due to the spatial nonlinearity of magnetic field gradients. This leads to a contrast enhancement of microscopic susceptibility inhomogeneities that can be several 100‐fold, in particular for low spatial resolution. In this study, we investigate whether this effect contributes to fMRI contrast by comparing images obtained at increasingly higher spatial resolutions and by applying increasingly stronger spatial filters to maintain the same effective image resolution. We expect that if this effect plays a role—spatial extent of activation will decrease with increasing spatial resolution, despite filtering. We also investigate whether the effect differs between focal activation in motor cortex and distributed activation in visual cortex. We further investigate whether cardiac gating reduces the effects of cardiac‐related brain pulsation, as suggested in previous studies [Kuppusamy et al., 1997].
Figure 6.
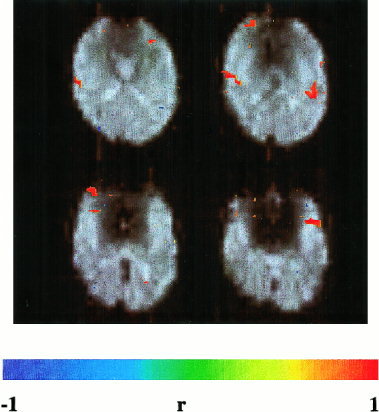
Activation in auditory cortex (Heschel's gyrus) during a single activation cycle (15 sec activation and 15 sec rest) of an auditory attention task. Same EPI method as in Figure 4. Correlation threshold = 0.5.
Figure 8.
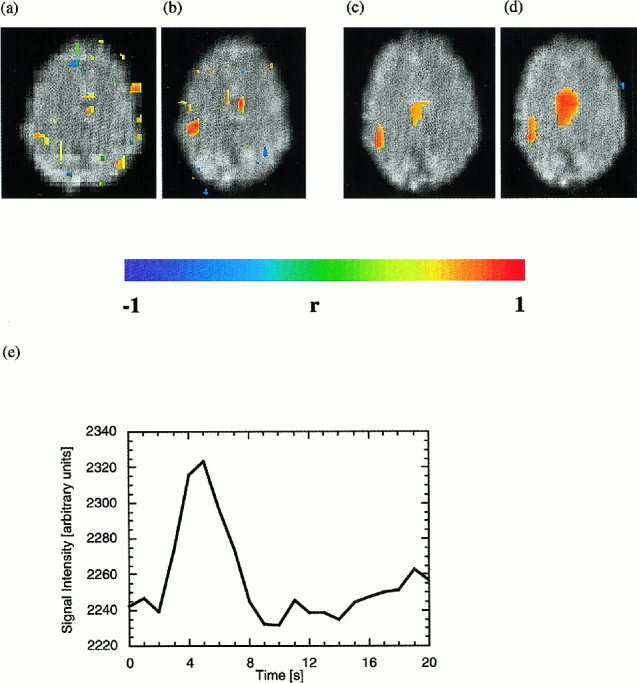
Real‐time fMRI of single left‐hand index finger tap. Turbo‐PEPSI (b) increases functional sensitivity as compared to EPI (a) and clearly display activity in M1 and SMA. Turbo‐PEPSI data from a second experiment before (c) and after (d) reference vector optimization: Reference vector optimization increases the extent of activation and mean correlation coefficients in M1 and SMA by adapting the hemodynamic response function in each voxel to the measured signal changes. Correlation threshold = 0.5 in all images. (e) Typical time course of Turbo‐PEPSI signal in M1 after single finger tap.
A complementary approach to increase fMRI sensitivity employs single‐shot multi‐echo EPI (single‐shot spectroscopic imaging of water relaxation) [Posse et al., 1999d]. This method, which we termed Turbo‐PEPSI (Turbo‐Proton‐Echo‐Planar‐Spectroscopic‐Imaging), takes advantage of the fact that the BOLD effect (a bell‐shaped curve that is the difference between the relaxation signals measured during task activation and during baseline) extends over a relatively wide range of echo times. This suggests that images measured at different echo times contain functional information, which can be combined to increase functional sensitivity. We have shown that linear summation of images acquired at different echo times provides similar sensitivity enhancement as exponential curve fitting. Maximum sensitivity with summation can be achieved by sampling echo times of up to 3.2 T2*. The gain in sensitivity as compared to conventional EPI is  (where Δt is the k‐space encoding time for each echo‐planar image) and thus increases with decreasing spatial resolution. This method is numerically robust, even under conditions of low SNR, and provides a combined measure of T2* and initial signal intensity. Here, we demonstrate the feasibility of using Turbo‐PEPSI with echo summation in real‐time to increase sensitivity with single‐trial paradigms.
MATERIALS AND METHODS
Subjects
Sixty subjects with a mean age of 25.5 years (58 men, 2 women; age range: 21–45 years) participated in the different experiments of this study. Subjects gave written informed consent for participation in the study, which was approved by the University of Düsseldorf Human Subjects Review Committee.
Scanner
Measurements were performed on a clinical 1.5 Tesla Vision MR scanner (Siemens Medical Systems, Erlangen, Germany) equipped with gradient overdrive, standard quadrature head coil, and broadband transistor amplifier. Foam cushions to secure the head were used to minimize motion artifacts. Whole‐head automatic shimming up to third order was performed in all experiments.
Pulse sequences
Real‐time methods
In most studies EPI (TE: 66 ms, flip angle (α) = 90°) was performed with a matrix size of 32 × 32 and with 16 slices (6 mm thickness, 0.6 mm interslice gap), using a field of view (FOV) of 200 mm (voxel size: 6 × 6 × 6 mm3). The maximum readout bandwidth with nonlinear sampling during gradient ramps was 33.3 kHz. For comparison, some measurements were performed with matrix sizes of 64 × 64 and 128 × 128 pixels, using readout bandwidths of 66.6 kHz and 133.2 kHz, respectively. Additional measurements were performed to assess the effects of higher readout bandwidths (64 kHz for the 32 × 32 matrix and 128 kHz for the 64 × 64 matrix). Repetition times ranged from 1 to 4 sec depending on the number of slices and the matrix size. With the head coil the SNR for a voxel size of 6 × 6 × 6 mm3 was typically larger than 300:1. Images were continuously reconstructed within a single TR period by the array processor of the MR scanner. All slices of a volume data set were stored in a single image (so‐called “mosaic” image format). Real‐time Turbo‐Proton‐Echo‐Planar‐Spectroscopic‐Imaging (Turbo‐PEPSI) was performed with eight consecutive EPI encodings (TRmin: 1 sec, flip angle (α) = 90°, matrix size: 32 × 32 pixels, FOV: 200 mm, number of slices: 1, slice thickness: 6 mm) using echo times ranging from 30 to 156 ms and interimage spacing of 18.3 ms. This range of echo times represents a compromise between sensitivity enhancement, which increases with the number of measured echo times up to TE = 220 ms, and excessive real‐time data rates. The duration of the trapezoidal readout gradients was 500 ms with 160 ms ramp times. Nonlinear sampling was employed on the gradient ramps. Phase encoding was refocused between images to encode the same k‐space trajectory in all images. Turbo‐PEPSI images obtained at different echo times were summed online within a single TR period.
Peak‐to‐peak signal instabilities in EPI time series (TR: 3 sec, TE: 66 ms) were measured on phantoms using the transistor amplifier and the head coil. In individual voxels the instabilities were less than 0.5% for a voxel size of 6 × 6 × 6 mm3 and less than 1% for a voxel size of 3 × 3 × 3 mm3. Image ghosting was typically less than 5%.
Conventional EPI
To quantify the effect of different pixel sizes on motor and visual activation conventional EPI (TR = 6 sec, TE = 69 ms, flip angle (α) = 90°, FOV: 200 mm) with offline analysis was performed using a circular 12 cm diameter flexible receive‐only surface coil that was placed above the left motor cortex or over the visual cortex. This coil, which required whole‐body excitation with the standard tube amplifier, approximately doubled the SNR inside the region of interest (ROI) in comparison with the head coil. Pixel sizes of 1.5 × 1.5 mm2, 3 × 3 mm2 and 6 × 6 mm2 were obtained using matrix sizes of 128 × 128, 64 × 64, and 32 × 32 pixels, and receiver bandwidths of 123 kHz, 61.5 kHz, and 30.75 kHz, respectively. Sixteen slices with 4 mm thickness and 0.4 mm interslice gap were positioned in axial orientation for motor stimulation or parallel to the calcarine fissure for visual stimulation. Measurements were performed with and without ECG gating. The long repetition time was selected to reduce signal instabilities during ECG gating due to possible heart rate variations. The time delay between slice excitations was kept constant at 200 ms, independent of matrix size, to obtain a total measurement time of 3.2 sec for each multislice data set. The SNR in visual and motor cortex with the smallest voxel size was larger than 60:1.
Stimulation protocols
Motor and visual tasks with conventional fMRI to investigate voxel size effect
The effect of spatial resolution on fMRI sensitivity in motor and visual cortex was assessed on five subjects using conventional fMRI. Motor activation (n = 3) was studied after a brief initial training session using an acoustically paced (1 Hz) right index‐finger tapping task (5 repetitions of a 30 sec rest and a 30 sec tapping cycle) (Fig.1). Visual stimulation (n = 2) was applied using home made LED‐goggles with a flicker rate of 8 Hz (3 repetitions of a 30 sec darkness and a 30 sec light stimulation cycle). The tasks were repeated six times to measure three different spatial resolutions, combined with and without ECG‐gating. Parameter settings were randomized between task repetitions.
Validation of real‐time fMRI in visual, motor, and auditory system
Visual stimulation was studied on 55 subjects. Red flicker light (8 Hz) alternating with darkness was used on 44 subjects. Alternatively, opening and closing the eyes in a well‐lit scanner environment was performed by 11 subjects. Stimulus duration was between 10 sec and 20 sec, alternating with rest periods ranging from 12 to 20 sec. Motor activation was studied on 60 subjects. Fifty‐five subjects performed a self‐paced sequential thumb‐finger opposition task of the right and/or left hand with movement duration ranging from 2 sec to 20 sec and with rest periods ranging from 12 to 20 sec. Repetitive flexing of the left and/or the right foot was performed by 5 subjects using a movement duration of 20 sec and a rest period of 20 sec. Auditory activation was studied on 2 subjects using an auditory discrimination task. Two‐digit syllables (ta, ba, ka, …, presentation rate: 1/sec) were presented binaurally for 20 sec using an MR‐compatible headset and compared with 20 sec rest. The discrimination task was to detect the target syllable ta and to respond by lifting the right index finger.
Cognitive task
The word generation paradigm consisted of 15 sec of silent word generation, which was initiated by auditory cueing with the first letter, and 15 sec of rest (four subjects). Subjects kept their eyes closed during this task.
Single‐event tasks
Sixteen subjects were scanned to investigate the feasibility of detecting single finger movements. A standard finger‐tapping paradigm was performed to localize primary motor cortex (M1) and supplementary motor cortex (SMA). Signal responses to single finger taps (thumb, index finger, middle finger, pinky of the right, the left or both hands), which were visually or acoustically triggered 8 sec after starting the scan, were measured from a single‐slice encompassing M1 and SMA. In three subjects the cerebral activity during single brisk and uncommon movements was measured. The movement consisted of rapid extension of the hand in radial‐dorsal direction. Ten consecutive measurements were performed to detect changes in activity patterns in consecutive trials.
Real‐time data analysis
The scanner was linked via 10 Mbits/s ethernet to an external SUN Ultra Sparc 10 workstation operating at 300 MHz for real‐time data analysis. The client‐server based Functional Imaging in REal time (FIRE) software package (Fig. 2) has partly been described in previous reports [Schor et al., 1998; Gembris et al., 2000; Mathiak and Posse, 2000]. Briefly, the server sends LZ77‐compressed images [Press et al., 1992] via TCP/IP from the host computer to the external workstation where the client uncompresses, rescales, and displays the images. Real‐time correction and “sliding‐window” correlation analysis are performed within a single TR period. The reference vector r(t) was obtained by convolving the graphically defined stimulation paradigm with a time‐shifted Poisson function that was characterized by a dispersion time constant λ (typically 3 sec) and a time delay time Δ (typically 2 sec):
| (2) |
First order detrending (of the mean) was performed. Depending on TR, the first 2–5 image data sets were excluded from correlation to avoid T1 related saturation effects. Spatial filtering (median and average) could be applied to the raw images and/or to the correlation maps. In most studies a 3 × 3 median filter was applied to the correlation maps. During the ongoing scan the following interactive features were available: adjustment of the correlation threshold, a snapshot tool to save correlation maps to disk, and simultaneous display of spatially averaged time course data from up to three graphically defined ROI. Within these ROI windows the minimum, the maximum, and the mean signal intensities, as well as the maximum percent signal changes with respect to the mean were displayed. As a further option, averaging within these rectangular ROIs could be restricted to voxels with an absolute correlation coefficient above the selected threshold. Because this may cause the number of averaged voxels to fluctuate, image intensities were normalized to the first nondiscarded data set. Images could be converted online to ANALYZE, STIMULATE, or a custom‐defined raw data format and saved to disk without noticeable increase in data analysis time. For the raw data format, rescanning of the saved images is supported. A 3D display of correlation images mapped onto interactively volume rendered high‐resolution MR images was implemented using AVS/Express visualization toolkit. Coregistration of the two data sets was performed manually. The graphical user interface could be projected into the scanner using a custom made video display system to enable real‐time self‐monitoring of brain activation by the subject.
Figure 2.
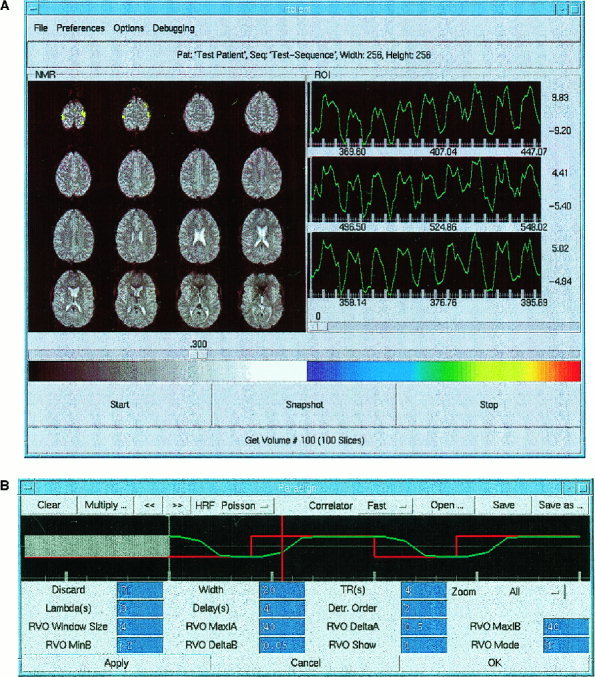
(A) The main window of the client's graphical user interface displays motor activation during bimanual finger tapping. The left panel displays colored correlation maps overlaid on original EPI images (64 × 64 matrix) in radiological orientation. The right panels display time courses from three selected ROI in left and right motor cortex. The ROIs are highlighted on the MRIs during ROI selection (not shown here). Underneath each time course the minimum, the mean, and the maximum value of the ROI signal intensities are displayed. Maximum and minimum ROI signal changes relative to mean (%) are indicated to the right of the time courses. The slider below these panels indicates the correlation threshold (|rmin| = 0.3). The color scale for the correlation map covers the range ‐1 (blue) to 1 (red). A button allows users to save snapshots of the main panel during the scan. (B) Paradigm control window displays the time course of the paradigm (red) and the reference vector (green), which is modeled by convolution of the paradigm with a time shifted Poisson function. The paradigm is created by graphic editing using a mouse‐controlled cursor. Initial multislice data sets, which are discarded to avoid steady state effects, are shown as a gray bar. The current position within the sliding window is indicated by a moving time marker. The correlator button allows to select the processing strategy which is either correlation with a fixed reference vector and first order detrending of the mean or correlation with a fixed reference vector and higher order detrending or reference vector optimization (RVO) using the graphically defined reference vector as a starting point. RVO parameters, which control the extent of the RVO search space (starting point, step size, number of steps) and the display of parametric images, are listed below. The color scale is used in subsequent figures for reference.
Because reference vector optimization, higher order detrending, motion correction, and 3D‐visualization cannot be performed simultaneously in real‐time on a workstation, parts of the software were implemented on a Cray T3E massively parallel computer [Eickermann et al., 1999]. In this case the reference vector was modeled as a linear‐exponential function:
| (3) |
An optimization of the parameters α and β of the reference vector using a “brute force” search of the parameter space was performed to increase sensitivity by accounting for intra‐ and intersubject variability of the hemodynamic response. The images were distributed over up to 128 nodes for parallel processing. Optimization of single slice time series with 20 time points was feasible on a SUN workstation, however, with a processing time of several seconds.
All signal changes in our real‐time studies with few exceptions were detected within a single activation cycle using sliding window widths between 5 to 20 time points.
Conventional (offline) data analysis
Activation patterns that were detected in real time were confirmed by postprocessing using SPM97b [Friston et al., 1995] and STIMULATE [Strupp, 1996]. With SPM motion correction was performed without taking into account spin history and higher order effects. Spatial smoothing was applied using the voxel dimensions. Statistical analysis was performed using the same reference vector as with the FIRE software package. With STIMULATE a correlation with a boxcar reference vector shifted by 3 sec was employed.
The experiment that compares voxel size effects was analyzed using SPM97b [Friston et al., 1995] and a boxcar reference waveform, which was temporally shifted by one TR (6 sec) with respect to the paradigm. The first three multislice data sets of each time series were discarded. Further parameters included global normalization, temporal smoothing using a filter width of 2.8 sec, and low frequency filtering using a cutoff frequency of 0.2 cycles/min. Extent of activation and maximum Z‐score were obtained using a voxel‐based height threshold P‐value of 0.001, an extent threshold of 16, 4, and 1 voxel (144 mm3) for the 128 × 128, the 64 × 64 and the 32 × 32 matrix, respectively. One‐tailed paired t‐tests were performed to assess the statistical significance of changes in cluster volumes and maximum Z‐scores with voxel size, averaging data obtained with and without ECG gating. To assess the significance of partial volume effects, data were reexamined using modified spatial filter parameters such that the same effective spatial resolution (8.5 × 8.5 × 5.6 mm3) was obtained in the resulting data sets: 8.4 × 8.4 × 4 mm3 for the 128 × 128 matrix, 8 × 8 × 4 mm3 for the 64 × 64 matrix and 6 × 6 × 4 mm3 for the 32 × 32 matrix.
Single‐event related fMRI data of motor activation were analyzed using SPM97b [Friston et al., 1995] and the standard hemodynamic response function. The time from motor execution to the peak of the signal change and its full width at half maximum (FWHM) in M1 and SMA were measured by ROI analysis using STIMULATE [Strupp, 1996].
SNR was determined as the ratio of the mean signal intensity of an ROI inside the target region divided by the standard deviation of signal intensities in an ROI well outside of the brain that was not contaminated by ghosting.
RESULTS
Effects of voxel size and readout bandwidth on sensitivity in motor and visual cortex
Increasing spatial resolution strongly decreased the spatial extent of activation. This effect was more pronounced in motor cortex than in visual cortex (Tables I and II). The extent of motor activation decreased on average by 64% (from 20.4 to 7.4 cm3) when reducing the voxel size from 6 × 6 × 4 mm3 to 3 × 3 × 4 mm3 (P = 0.04) and by an additional 69% to 2.3 cm3 when further reducing the voxel size to 1.5 × 1.5 × 4 mm3 (P = 0.001). The extent of visual activation decreases on average by 26% (from 45.8 to 34.0 cm3) when reducing the voxel size from 6 × 6 × 4 mm3 to 3 × 3 × 4 mm3 (P = 0.27) and by an additional 66% to 11.6 cm3 when further reducing the voxel size to 1.5 × 1.5 × 4 mm3 (P = 0.06). The maximum Z‐scores did not depend significantly on spatial resolution. In motor cortex there was a trend toward an increase in extent of activation with ECG gating. When using modified spatial filters designed to compensate differences in voxel size and to assess partial volume effects, differences in average spatial extent of activation in motor cortex remained: 20.4 cm3, 13.8 cm3, and 13.1 cm3 for the 6 × 6 × 4 mm3, the 3 × 3 × 4 mm3, and the 1.5 × 1.5 × 4 mm3 voxel size, respectively. In visual cortex the average extents of activation after modified spatial filtering were similar for all voxel sizes. Since SNR was not a limitation in these data sets and maximum Z‐scores did not depend significantly on spatial resolution, these results suggest that partial volume effects in motor cortex were only partly responsible for the increase in extent of activation with voxel size.
Table I.
Effect of voxel size on activated volume and maximum Z‐score in motor cortex based on 18 measurements (3 subjects with 6 measurements each).
| Non ECG‐gated | ECG‐gated | |||
|---|---|---|---|---|
| Pixel size [mm2] | Volume [cm3] (SD) | Max. Z‐score (SD) | Volume [cm3] (SD) | Max. Z‐score (SD) |
| 1.5 × 1.5 | 1.6 (0.8) | 7.4 (0.5) | 3.1 (2.7) | 6.9 (1.0) |
| 3.0 × 3.0 | 6.7 (0.8) | 7.6 (0.5) | 8.0 (3.7) | 7.5 (0.4) |
| 6.0 × 6.0 | 10.1 (3.2) | 6.9 (1.2) | 30.6 (18.7) | 7.4 (0.2) |
SD = standard deviation
Table II.
Effect of voxel size on activated volume and maximum Z‐score in visual cortex based on 12 measurements (2 subjects with 6 measurements each).
| Non ECG‐gated | ECG‐gated | |||
|---|---|---|---|---|
| Pixel size [mm2] | Volume [cm3] mean (SD) | Max. Z‐score mean (SD) | Volume [cm3] mean (SD) | Max. Z‐score mean (SD) |
| 1.5 × 1.5 | 11.5 (5.8) | 7.4 (0.2) | 11.6 (4.1) | 7.3 (0.4) |
| 3.0 × 3.0 | 36.4 (20.6) | 7.1 (0.2) | 31.6 (35.6) | 6.9 (0.9) |
| 6.0 × 6.0 | 50.3 (28.7) | 7.1 (0.7) | 41.3 (37.2) | 6.5 (1.3) |
SD = standard deviation
The effect of voxel size on sensitivity was easily seen in real‐time studies of single activation cycles using simple tasks such as opening/closing the eyes and finger tapping. Consistent with the above results the extent of visual and motor activation and mean correlation coefficients in visual and motor cortex were strongly increased with increasing voxel size (Fig. 3). On the other hand, mean signal changes decreased with increasing voxel size (from 10 to 15% with 1.5 × 1.5 × 4 mm3 voxel size to 3–5% with 6 × 6 × 4 mm3 voxel size). While maximum correlation coefficients were independent of voxel size, correlation noise in nonactivated regions increased with decreasing voxel size. This required an increase of the correlation threshold resulting in a decrease of the area of activation. With the 3 × 3 × 4 mm3 voxel size, motor activation was less robustly seen in single activation cycles and the extent of visual activation fluctuated considerably between activation cycles due to increased noise. With the 1.5 × 1.5 × 4 mm3 voxel size signal changes in motor areas in single activation cycles were hardly detectable even with strong spatial filtering.
Figure 3.
Extent of activation and mean correlation coefficients in visual and motor cortex increase with voxel size: Matrix size: 128 × 128 (left), 64 × 64 (middle), 32 × 32 (right). (EPI, TR: 3 sec, TE 66 ms, FOV: 200 mm, slice thickness: 3 mm, 30 sec scan time). Single activation cycle: eyes open and bimanual finger tapping (9 sec) versus eyes closed with no movements (21 sec). Correlation threshold = 0.5.
Doubling the readout bandwidth decreased SNR by approximately . As a result, spatial extents of activation and mean correlation coefficients in visual and motor cortex were reduced. Changes in geometrical distortions, ghosting, and spatial blurring were only minor due to excellent shimming conditions.
Consequently, all real‐time studies were performed with the 32 × 32 matrix using low readout bandwidth (33.3 kHz). In order to obtain isotropic spatial resolution a voxel size of 6 × 6 × 6 mm3 was chosen which provided full brain coverage with 16 slices.
Performance of real‐time signal analysis
Image reconstruction on the scanner and motion compensation were the limiting steps for temporal resolution when using an external UNIX workstation for data analysis. Because image reconstruction and image analysis were asynchronous, there was no mutual influence on performance. With EPI, 16 slices using a 128 × 128 matrix could be reconstructed within less than 4 sec in a steady state. For a 64 × 64 matrix with 16 slices the minimum TR in the steady state was 2 sec. For the 32 × 32 matrix the reconstruction time was identical. Motion compensation required 4 μs/pixel per iteration on a SUN Ultra 10 Workstation. Using a 128 × 128 matrix, 16 slices, and 3 iterations for motion compensation, combined steady state data acquisition, reconstruction, and analysis could be performed with a minimum TR of 4 sec. For the 64 × 64 and the 32 × 32 matrices, the corresponding minimum TR was 2 sec. With single‐slice Turbo‐PEPSI, the minimum TR in the steady state was 1 sec.
Using a Cray T3E it was possible to perform real‐time reference vector optimization (RVO) and up to nine iterations for motion correction in addition to the above processing steps with a minimum TR of 4 sec when using a 64 × 64 matrix and 16 slices. The most time‐consuming function is RVO, but other processing steps like network transfer and image display also significantly contribute to the total processing time of the distributed FIRE application (workstation and Cray T3E).
Validation of real‐time fMRI in visual, motor, and auditory system
Widely distributed signal changes in primary visual cortex and in adjacent areas (V1, V2) were reproducibly detectable within seconds after the onset of flicker light stimulation or opening the eyes in every single measurement on all subjects. Maximum correlation coefficients between 0.8 and 0.95 were measured in single activation cycles. Flicker light also stimulated motion sensitive areas (V5/MT). When reducing the correlation threshold below 0.5 further activity extending into higher visual areas became visible. When comparing correlation maps obtained in real‐time and uncorrected Z‐maps obtained with SPM very similar patterns of activation were found after appropriate adjustments of thresholds (Fig. 4). The minimum stimulus duration detectable in a single trial with a maximum correlation coefficient of 0.5 was 500 ms.
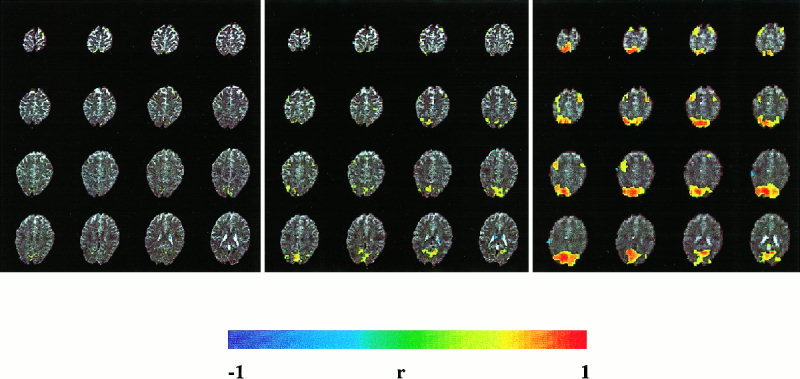
Figure 4.
Comparison of FIRE (left, correlation threshold = 0.7) and SPM (right, uncorrected intensity threshold of P = 0.001) using a delayed boxcar reference vector. Neither motion correction nor spatial filters were applied. The subject simultaneously performed a visual activation (eyes open vs. eyes closed) and a standard motor task (finger tapping vs. rest). The activation patterns with both analysis methods are very similar. (EPI, TR: 3 sec, TE: 66 ms, matrix size: 32 × 32, voxel size: 6 × 6 × 6 mm3. Paradigm: 9 sec baseline, 9 sec activation, 21 sec baseline, 9 sec activation, 15 sec baseline).
Sequential finger tapping and foot movements resulted in robust signal changes in contralateral primary (M1), supplementary motor cortex (SMA), motor cingulum, primary and secondary sensory cortex (SI, SII), and ipsilateral cerebellum within seconds after movement onset (Fig. 5), consistent with our previous work on motor coordination [Binkofski et al., 1998, 1999; Jäncke et al., 1998]. The maximum correlation coefficients for movement duration of 20 sec were between 0.8 and 0.9. Variations in signal response during multiple repetitions of the paradigm, which may have been related to habituation or fatigue, were clearly detectable in real‐time. Alternating left and right foot movement clearly distinguished left and right foot area of the primary motor cortex.
Figure 5.
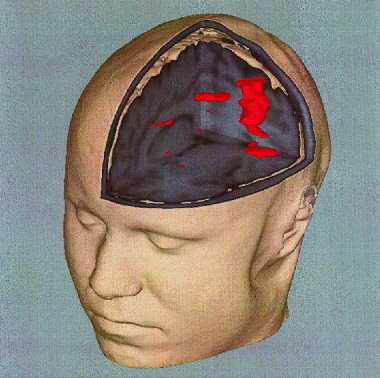
Motor activation in M1/S1, SMA/motor cingulate and SII was mapped in real time onto a volume rendered high‐resolution data set. Single activation cycle of 15 sec finger tapping versus 15 sec rest. Same EPI method as in Figure 4. Correlation threshold = 0.5.
Very robust signal changes, comparable in intensity to those in visual cortex, were detectable in bilateral auditory cortex (Heschel's gyrus) and adjacent areas during the auditory discrimination task (Fig. 6), consistent with our earlier reports [Jäncke et al., 1997]. Signal changes were detected within seconds of task initiation with correlation coefficients of up to 0.8.
Cognitive task
The pattern of activation during silent word generation was clearly visible after a single activation cycle. Activation was reproducible and robustly detectable in left premotor area, left Broca's area, left posterior temporal region, and left prefrontal cortex (Fig. 7), consistent with previous reports [Sadato et al., 1998].
Figure 7.

Silent word generation using a single activation cycle (15 sec activation and 15 sec rest) activates left premotor area, left Broca's area, left temporo‐parietal region, and left prefrontal cortex. Same EPI method as in Figure 4. Correlation threshold = 0.5.
Single‐event tasks
Real‐time fMRI of single finger movements was performed with a voxel size of 6 × 6 × 6 mm3 using either multislice EPI (TR: 1 or 2 sec, α: 90°) or single‐slice Turbo‐PEPSI (TR: 1 s,α: 90°). In comparison to EPI obtained with the same readout bandwidth, functional contrast with Turbo‐PEPSI was strongly improved (Fig. 8a, b), consistent with our previous results [Posse et al., 1999d]. Real‐time reference vector optimization improved functional contrast in M1 and SMA (Fig. 8c, d). As expected, the degree of improvement was dependent on the choice of the parameter search space. To avoid false positive results only a small search range of parameter values (αdefault ± 2 sec, βdefault ± 1 sec) was used. With Turbo‐PEPSI, signal changes in M1 and SMA in response to single finger taps were detectable in 92% of all single trials (Fig. 8e, Table III). Online analysis detected signal changes within 10 sec of movement onset. Correlation coefficients ranged from 0.5 to 0.8. Interindividual differences in signal response characteristics were compensated during initial trials by adjusting the parameters α and β of the hemodynamic response function to maximize the correlation coefficient. Postprocessing confirmed significant differences in FWHM of the signal response in M1 (Table III), ranging from 3 to 6 sec. During multiple repetitions of single trials the activity in SMA tended to decrease, possibly reflecting motor habituation. Signal changes in M1 and SMA were measurable for all fingers.
Table III.
Signal characteristics of single finger tap experiment: Average from 37 single trials.
| Right M1 (SD) | Left M1 (SD) | SMA (SD) | |
|---|---|---|---|
| Z‐score | 3.9 (1.1) | 3.4 (0.7) | 3.6 (1.0) |
| Peak FWHM [s] | 3.6 (1.2) | 3.5 (1.2) | 4.4 (1.3) |
| Time to peak [s] | 4.8 (0.7) | 4.7 (1.0) | 4.4 (0.4) |
SD = standard deviation
During brisk and uncommon movements, M1/S1 and SMA were activated. Clearly detectable activation in parietal cortex decreased during multiple repetitions of the paradigms, possibly reflecting increasing automation of the movements.
DISCUSSION
Effects of voxel size and readout bandwidth on sensitivity in motor and visual cortex
The aim was to increase sensitivity to the point where temporal resolution is limited by hemodynamic response characteristics (delay and dispersion) of blood flow rather than by technical factors. Decreasing the spatial resolution increases the extent of activation, consistent with previous studies [Frahm et al., 1993; Meyer et al., 1994; Thompson et al., 1994]. The increase in extent of activation with increasing voxel size is most pronounced for the focal activation in motor cortex associated with finger tapping. These strong changes in extent of activation with voxel size are unlikely entirely due to partial volume effect or mere changes in SNR, because the maximum Z‐scores did not change significantly, both for focal activation in the motor cortex and the more extensive activation associated with visual stimulation. This is further supported by the observation that modified spatial filtering to compensate differences in voxel size did not lead to comparable extent of activation in motor cortex. Thus, it appears that spatial contrast enhancement due to spatially nonlinear dephasing around blood vessels contributes to the strong dependence of the extent of focal activation in motor cortex on spatial resolution, which is consistent with our previous phantom measurements and computer simulations of isolated susceptibility inhomogeneities [Posse and Aue, 1990].
Reducing the matrix size also reduces the computational load for real‐time processing. The improved visualization of activated areas with larger voxel sizes is helpful in the real‐time setting where a large amount of rapidly changing visual information has to be monitored. It reveals areas of activation, which with smaller voxel sizes may have been at subthreshold level. It is conceivable that partial volume effect could impair the detection of very weak activations in single pixels, if opposite signal changes existed in adjacent pixels, but this unlikely situation was not encountered in our studies. In situations where signal changes are weak and distributed over an extended area, it is thus advantageous to reduce the spatial resolution to improve the detection of activation, for example when studying weak visual stimuli or when assessing higher cognitive functions. However, this gain in sensitivity leads to a loss in spatial delineation of the foci of activation, which may be undesirable for certain mapping studies. At clinical field strengths, high spatial resolution fMRI in real time does not seem to be feasible, at least not in single trials. This may change as higher field strengths become available.
The functional sensitivity achieved with Turbo‐PEPSI in single trials compares favorably with the sensitivity available at 4 Tesla as evidenced by a recent study, which reported the detection of motor activation in response to unaveraged four‐finger movements [Kim et al., 1997]. Turbo‐PEPSI appears to provide fMRI sensitivity at clinical field strengths, which is otherwise only obtainable at much higher field strengths.
Real‐tme signal analysis
For many applications, in particular for clinical purposes, a rapid analysis of functional activation is highly desirable. The ability to monitor subject performance and movement artifacts immediately after or even during scanning can help to make decisions about additional scans or modifications of acquisition parameters, which may be critical for the success of a study, and enables the design of interactive paradigms. The magnitude of the signal response may vary between subjects due to differences in physiology that requires decisions to be made as to how many measurements must be taken to achieve a desired statistical significance. Also, it is desirable to monitor changes in subject attention during the scan. For event‐related and single‐trial studies with limited volume coverage (e.g., when using EPI at high temporal resolution), it may be advantageous to select a volume of interest based on a pilot scan, which quickly localizes functional areas of interest. Finally, in the clinical setting the reduced data analysis time increases patient throughput and reduces cost.
Real‐time fMRI is currently being developed by an increasing number of research groups [Cox et al., 1995; Goddard et al., 1997; Cohen et al., 1998; Gering and Weber, 1998; Lee et al., 1998; Frank et al., 1999; Voyvodic, 1999; Yoo et al., 1999; Gembris et al., 2000], and major MR manufacturers have started the development of their own real‐time analysis tools. However, in contrast to our methodology, the data acquisition and analysis techniques that were used in previous studies are not suitable for real‐time monitoring of dynamic changes in brain activity during the ongoing scan. They can detect signal changes only in a cumulative manner, which limits their use for interactive paradigms. Some of these methods were designed to be near‐real time; i.e. they are applied immediately after the scan is finished. Also, most previous implementations of real‐time fMRI required scanners with modified hardware and image reconstruction on external workstations. In our implementation, real‐time image reconstruction was performed on a standard clinical scanner, which simplified the implementation of FIRE and allowed us to perform real‐time data analysis on a standard UNIX workstation.
Despite these advances, our implementation of real‐time fMRI has certain limitations: Detrending of baseline drifts can reduce functional sensitivity in single trials [Lowe and Russell, 1999]. More flexible methods for detrending of baseline drifts and physiological noise are required. Currently, only simple paradigms that compare an activated state with a control state can be used. More flexible approaches such as multivariate analysis and analysis methods based on the general linear model as implemented in SPM [Friston et al., 1995] are highly desirable. The user interface needs to be improved to enable the user to more rapidly extract relevant information. The display of the abundant information that is available in real‐time can easily lead to information overload of the experimenter. The development of a stereoscopic real‐time display of 3D brain activity using a virtual reality holobench is in progress [Eickermann et al., 1999]. Methods to compress information and to train the user to make more efficient use of the methodology must be developed. Faster image reconstruction and processing algorithms to enable multislice Turbo‐PEPSI in real time are desirable to increase sensitivity. The use of real‐time fMRI with open scanners that are currently being developed opens up exciting opportunities for functional brain mapping during surgical interventions.
Activation experiments
This study demonstrates the feasibility of detecting single‐stimulus bound activity in real time on a clinical whole‐body scanner. This capability was accomplished by major increases in sensitivity of data acquisition techniques and by advances in data analysis. The wide range of stimulation protocols, which were employed in this study, demonstrates the flexibility and robustness of our methodology. Our initial expectation was that real‐time fMRI was suitable for localizing activity in primary sensory systems and in the motor system. However, to our surprise, even higher cognitive functions during a language task, using single‐block design paradigms, could be monitored quite robustly. The reliable detection of activation of language‐eloquent areas during the performance of the standard word generation task indicates the feasibility of this method for presurgical diagnostic. The capability of monitoring nonaveraged single‐event responses by real‐time fMRI extends the possibilities of event‐related fMRI and is complementary to similar efforts using EEG [Tomberg and Demedt, 1996] and MEG [Liu et al., 1996] to assess the time course of single‐trial activation. Real‐time fMRI can detect changes in activity patterns and in activation strength in consecutive trials of one experiment, providing information about short‐term learning or habituation. Detection of short living changes between consecutive trials is not possible in conventional event related fMRI due to averaging of trials. It will be of interest to investigate the limits of temporal resolution for distinguishing regional differences in the onset of neuronal activation. Combination of real‐time fMRI with EEG or MEG may improve spatial‐temporal resolution for measuring transient brain activity.
Real time fMRI can potentially be applied as a biofeedback mechanism for operant conditioning of BOLD signal changes. For example, schizophrenic patients who suffer from a lack of amygdala activation during sad mood [Schneider et al., 1998] might profit therapeutically if real time biofeedback of amygdala activation was feasible. In previous experiments with healthy subjects, we demonstrated that the amygdala is activated during states of sadness [Schneider et al., 1997]. In ongoing experiments we are investigating whether healthy subjects can be trained to modulate regional activity in the amygdala during sad mood induction with the aid of brain activation maps that are displayed inside the scanner in real time [Schneider et al., 1999].
CONCLUSIONS
Single‐trial real‐time fMRI provides exciting opportunities for novel study designs, such as interactive paradigms. It is beginning to open up entirely new opportunities to study the temporal dynamics of brain activation, including the detection of short‐lasting changes between consecutive trials. The possibility to monitor ones own brain activity offers intriguing opportunities for biofeedback studies. However, it requires experience to fully understand its capabilities and limitations, which may not be immediately obvious. We expect that real‐time fMRI will be more widely used in the near future for both clinical and research studies.
Acknowledgements
We gratefully acknowledge the support of J.G. Taylor (King′s College, London) with the design of optimization algorithms for sliding window correlation and reference vector optimization. We thank Siemens Medical Systems (S. Schor, E. Müller, W. Loeffler, M. Peyerl, R. Kroeker) for generous software support for the FIRE project. We thank H. Zilken (NIC), M. Göbel (GMD,) and G. Goebbels (GMD) for their continuing efforts to develop a virtual‐reality visualization for real‐time fMRI. We thank Helmut Schumacher (NIC) for help with 3D visualization (Fig. 5). S. Dager (University of Seattle), H.‐J. Freund, R. Seitz (both from the University of Düsseldorf), P. Indefrey (MPI of Psycholinguistics), L. Kemna (IME), L. Jäncke (University of Magdeburg), and C. Konrad (University of Münster) have made valuable suggestions regarding task design and methodology. We thank the director of the Institute for Medicine, K. Zilles, for supporting this project. We thank D. Suter (University of Dortmund) for supervising the diploma work and the PhD thesis of one of the authors (D. Gembris). S. Posse was supported by EU grant BIOMED II PL 950870. The implementation on the Cray T3E was performed as part of the BMBF‐funded DFN‐project “Gigabit Testbed West.”
REFERENCES
- Behr D, Posse S, Grosse‐Ruyken ML, Shah NJ, Wiese S, Müller‐Gärtner HW (1997): Spatial resolution and EKG‐gating in single‐shot functional echo planar MRI: a statistical analysis. Neuroimage 5: 515. [Google Scholar]
- Binkofski F, Dohle C, Posse S, Stephan KM, Hefter H, Seitz RJ, Freund H‐J (1998): Human anterior intraparietal area subserves prehension. A combined lesion and fMRI study. Neurology 50: 1253–1259. [DOI] [PubMed] [Google Scholar]
- Binkofski F, Buccino G, Posse S, Seitz RJ, Rizzolatti G, Freund H‐J (1999): A fronto‐parietal circuit for object manipulation in man. Evidence from a fMRI‐study. Eur J Neurosci 11: 3276–3268. [DOI] [PubMed] [Google Scholar]
- Boynton GM, Engel SA, Glover GH, Heeger DJ (1996): Linear systems analysis of functional magnetic resonance imaging in human V1. J Neurosci 16: 4207–4221. [DOI] [PMC free article] [PubMed] [Google Scholar]
- Buckner RL, Bandettini PA, O′Craven KM, Savoy RL, Petersen SE, Raichle ME, Rosen BR (1996): Detection of cortical activation during averaged single trials of a cognitive task using functional magnetic resonance imaging. Proc Natl Acad Sci U S A 93: 14878–14883. [DOI] [PMC free article] [PubMed] [Google Scholar]
- Cohen MS, Dubois RA, Scheding WL (1998): Rapid artifact detection and correction for real‐time fMRI. Neuroimage 7: S564. [Google Scholar]
- Cox RW, Jesmanowicz A, Hyde JS (1995): Real‐time functional magnetic resonance imaging. Magn Reson Med 33: 230–236. [DOI] [PubMed] [Google Scholar]
- Dale AM, Buckner RL (1997): Selective averaging of rapidly presented individual trials using fMRI. Hum Brain Mapp 5: 329–340. [DOI] [PubMed] [Google Scholar]
- Eickermann T, Frings W, Posse S, Goebbels G, Voelpel R (1999): Distributed applications in a German gigabit WAN Procceedings of the eighth IEEE international symposium on high performance distributed computing. Piscataway, New Jersey: The Institute of Electrical and Electronics Engineers, Inc. p 143–148. [Google Scholar]
- Frank JA, Ostuni JL, Yang Y, Shiferaw Y, Patel A, Qin J, Mattay VS, Lewis BK, Levin RL, Duyn JH (1999): Technical solution for an interactive functional MR imaging examination: application to a physiologic interview and the study of cerebral physiology. Radiology 210: 260–268. [DOI] [PubMed] [Google Scholar]
- Frahm J, Merboldt KD, Hänicke W (1993): Functional MRI of the human brain at high spatial resolution. Magn Reson Med 29: 139–144. [DOI] [PubMed] [Google Scholar]
- Friston KJ, Worsley KJ, Frackowiak RSJ, Mazziotta JC, Evans AC (1994): Assessing the significance of focal activations using their spatial extent. Hum Brain Mapp 1: 214–220. [DOI] [PubMed] [Google Scholar]
- Friston KJ, Holmes AP, Worsley KJ, Poline JP, Frith CD, Frackowiak RSJ (1995): Statistical parametric maps in functional imaging: a general linear approach. Hum Brain Mapp 2: 189–210. [Google Scholar]
- Gaschler‐Markefski B, Baumgart F, Tempelmann C, Schindler F, Stiller D, Heinze H, Scheich H (1997): Statistical methods in functional magnetic resonance imaging with respect to nonstationary time‐series: auditory cortex activity. Magn Reson Med 38: 811–820. [DOI] [PubMed] [Google Scholar]
- Gembris D, Taylor JG, Schor S, Frings W, Suter D, Posse S (2000): Functional MR Imaging in Real‐Time using a sliding‐window correlation technique. Magn Reson Med 43: 259–268. [DOI] [PubMed] [Google Scholar]
- Gering DT, Weber DM (1998): Intraoperative, real‐time, functional MRI. J Magn Res Imaging 8: 254–257. [DOI] [PubMed] [Google Scholar]
- Goddard NH, Hood G, Cohen JD, Eddy WF, Genovese CR, Noll DC, Nystrom LE (1997): Online analysis of functional MRI data sets on parallel platforms. J Supercomput 11: 295–318. [Google Scholar]
- Jäncke L, Posse S, Shah NJ, Nösselt T, Schmitz N, Müller‐Gärtner H‐W (1997): Attentional factors modify the BOLD‐response in the human auditory cortex to auditory stimuli. Neuroimage 5: 191. [Google Scholar]
- Jäncke L, Peters M, Schlaug G, Posse S, Steinmetz H, Müller‐Gärtner H‐W (1998): Differential magnetic resonance signal changes in human sensorimotor cortex to finger movements of different rate of the dominant and subdominant hand. Cogn Brain Res 6: 279–284. [DOI] [PubMed] [Google Scholar]
- Kim S, Richter W, Ugurbil K (1997): Limitations of temporal resolution in functional MRI. Magn Reson Med 37: 631–666. [DOI] [PubMed] [Google Scholar]
- Konishi S, Yoneyama R, Itagaki H, Uchida I, Nakajima K, Kato H, Okajima K, Koizumi H, Miyashita Y (1996): Transient brain activity used in magnetic resonance imaging to detect functional areas. Neuroreport 8: 19–23. [DOI] [PubMed] [Google Scholar]
- Kuppusamy K, Lin W, Haacke E (1997): Statistical assessment of cross correlation and variance methods and the importance of electrocardiogram gating in functional magnetic resonance imaging. Magn Reson Imaging 15: 169–181. [DOI] [PubMed] [Google Scholar]
- Lee CC, Jack CR Jr, Rossman PJ, Riederer SJ (1998): Real‐time reconstruction and high‐speed processing in functional MR imaging. AJNR Am J Neuroradiol 19: 1297–1300. [PMC free article] [PubMed] [Google Scholar]
- Liu MJ, Fenwick PBC, Lumsden J, Lever C, Stephan KM, Ioannides AA (1996): Averaged and single‐trial analysis of cortical activation sequences in movement preparation, initiation, and inhibition. Hum Brain Mapp 4: 254–264. [DOI] [PubMed] [Google Scholar]
- Liu HL, Gao JH (1999): Perfusion‐based event‐related functional MRI. Magn Reson Med 42: 1011–1013. [DOI] [PubMed] [Google Scholar]
- Lowe M, Sorenson J (1997): Spatially filtering functional magnetic resonance imaging data. Magn Reson Med 37: 723–729. [DOI] [PubMed] [Google Scholar]
- Lowe MJ, Russell DP (1999): Treatment of baseline drifts in fMRI time series analysis. J Comp Assist Tomogr 23: 463–473. [DOI] [PubMed] [Google Scholar]
- Mathiak K, Posse S (2000): Evaluation of motion and realignment for functional magnetic resonance imaging in realtime. Magn Reson Med (in press). [DOI] [PubMed] [Google Scholar]
- Menon RS, Ogawa S, Strupp JP, Ugurbil K (1997): Ocular dominance in human V1 demonstrated by functional magnetic resonance imaging. J Neurophysiol 77: 2780–2787. [DOI] [PubMed] [Google Scholar]
- Meyer ME, Hertz‐Pannier L, Risinger RC, Posse S, Le Bihan D (1994): Effect of spatial resolution on activation ratio in echo‐planar functional MRI. Proc Soc Magn Reson Med: Abstract p 652. [Google Scholar]
- Posse S, Aue WP (1990): Susceptibility artifacts in spin echo and gradient echo imaging. J Magn Reson 88: 473–492. [Google Scholar]
- Posse S, Schor S, Gembris D, Müller E, Peyerl M, Kroeker R, Grosse‐Ruyken ML, Elghawaghi B, Taylor JG (1998a): Real time fMRI on a clinical whole body scanner: single trial detection of sensorimotor stimulation and visual recall activation. Proc Int Soc Magn Reson Med: Abstract p 162. [Google Scholar]
- Posse S, Schor S, Gembris D, Müller E, Peyerl M, Kroeker R, Grosse‐Ruyken ML, Elghawaghi B, Taylor JG (1998b): Real‐time fMRI on a clinical whole body scanner: single‐event detection of sensorimotor stimulation. Neuroimage 7(Pt. 2): 445. [Google Scholar]
- Posse S, Graf T, Frings W, Mathiak K, Wiese S, Goebels S, Zillken H, Goebbels G, Kiselev V, Elghahwagi B, Eickermann T, Gembris D (1999a): Functional Imaging in REal time (FIRE) on a clinical whole body scanner. Neuroimage 9(Pt. 2): 245. [Google Scholar]
- Posse S, Binkofski F, Gembris D, Wiese S, Elghahwagi B, Graf T, Freund H‐J, Zilles K (1999b): Real‐time fMRI of single finger movements using single‐shot multi‐echo EPI. Proc Int Soc Magn Reson Med: Abstract p 774. [Google Scholar]
- Posse S, Binkofski F, Wiese S, Elghahwagi B, Seitz RJ, Freund H‐J, Zilles K (1999c): Real‐time fMRI of single finger movement. Neuroimage 9(Pt. 2): 423. [Google Scholar]
- Posse S, Wiese W, Gembris D, Mathiak K, Kessler C, Grosse‐Ruyken ML, Elghawaghi B, Richards T, Dager SR, Kiselev VG (1999d): Enhancement of BOLD‐contrast sensitivity by single‐shot multi‐echo functional MR imaging. Magn Reson Med 42: 87–97. [DOI] [PubMed] [Google Scholar]
- Press WH, Teukolsky SA, Vetterling WT, Flannery BP (1992): Numerical recipes in C: the art of scientific computing. New York: Cambridge University Press. [Google Scholar]
- Reeder SB, McVeigh ER (1994): The effect of high performance gradients on fast gradient echo imaging. Magn Reson Med 32: 612–621. [DOI] [PMC free article] [PubMed] [Google Scholar]
- Sadato N, Yonekura Y, Yamada H, Nakamura S, Waki A, Ishii Y (1998): Activation patterns of covert word generation detected by fMRI: comparison with 3D PET. J Comput Assist Tomogr 22: 945–52. [DOI] [PubMed] [Google Scholar]
- Savoy RL, Bandettini PA, O′Craven KM, Kwong KK, Davis TL, Baker JR, Weiskoff RM, Rosen BR (1995): Pushing the temporal resolution of fMRI: studies of very brief visual stimuli, onset variability and asynchrony, and stimulus correlated changes in noise. Proc Soc Magn Reson Med, p 450. [Google Scholar]
- Schneider F, Grodd W, Weiss U, Klose U, Mayer KR, Nägele T, Gur RC (1997): Functional MRI reveals left amygdala activation during emotion. Psychiatry Res: Neuroimaging 76: 75–82. [DOI] [PubMed] [Google Scholar]
- Schneider F, Weiss U, Grodd W, Kessler C, Posse S, Müller‐Gärtner H‐W (1998): Differential amygdala activation in schizophrenic patients and healthy controls during sadness. Schizophr Res 35: 133–142. [DOI] [PubMed] [Google Scholar]
- Schneider F, Weiss U, Saloum JB, Posse S (1999): Real time analysis of amygdala activation. Neuroimage 9(Pt. 2): 910. [Google Scholar]
- Schor S, Gembris D, Taylor JG, Peyerl M, Müller E, Posse S (1998): Functional imaging in real‐time (FIRE). Proc Int Soc Magn Reson Med, p 1440. [DOI] [PubMed] [Google Scholar]
- Strupp JP (1996): Stimulate: a GUI based fMRI analysis software package. Neuroimage 3: S607. [Google Scholar]
- Thompson, RM , Jack, CR , Butts, K , Hanson, DP , Riederer, SJ , Ehman, RL , Hynes, RW , Hangiandreou, NJ (1994): Imaging of cerebral activation at 1.5 T: optimizing a technique for conventional hardware. Radiology 190: 873–877. [DOI] [PubMed] [Google Scholar]
- Thulborn K, Chang S, Shen G, Voyvodic J (1997): High‐resolution echo‐planar fMRI of human visual cortex at 3.0 Tesla. NMR in Biomed 10: 183–190. [DOI] [PubMed] [Google Scholar]
- Tomberg C, Demedt JE (1996): Non‐averaged human brain potentials in somatic attention: the short‐latency cognition‐related P40 component. J Physiol (London) 496: 559–574. [DOI] [PMC free article] [PubMed] [Google Scholar]
- Voyvodic JT (1999): Real‐time fMRI paradigm control, physiology, and behavior combined with near real‐time statistical analysis. Neuroimage 10: 91–106. [DOI] [PubMed] [Google Scholar]
- Yang QX, Posse S, Le Bihan DL, Smith MB (1996): Double‐sampled echo‐planar imaging at 3 Tesla. J Magn Reson B 113: 145–150. [DOI] [PubMed] [Google Scholar]
- Yoo SS, Guttmann CRG, Zhao L, Panych LP (1999): Real‐time adaptive functional MRI. Neuroimage 10: 596–606. [DOI] [PubMed] [Google Scholar]