

Abstract
We employed cerebral 18Fluoro‐deoxyglucose positron emission tomography ([18F]FDG‐PET) to visualize neuronal activation of the frontal motor and premotor cortex during suprathreshold repetitive transcranial magnetic stimulation (rTMS) applied to the left primary sensorimotor hand area (SM1HAND). Twelve right‐handed normal subjects underwent two [18F]FDG‐PET measurements at baseline without rTMS and during suprathreshold 2 Hz rTMS of the left SM1HAND. In the rTMS condition, 1,800 magnetic stimuli at an intensity of 140% of motor‐resting threshold were delivered immediately after intravenous injection of [18F]FDG. Relative differences in the normalized regional cerebral metabolic rate for glucose (rCMRglc) between the rTMS condition and baseline were determined using a voxel‐by‐voxel Student's t‐test and a volume‐of‐interest analysis. Data analysis was a priori restricted to primary motor and premotor areas in the frontal cortex, namely the SM1, the supplementary motor area (SMA), the lateral premotor cortex (PMC), and the caudal anterior cingulate cortex (ACC) of either hemisphere. In addition to a relative increase in normalized rCMRglc in the stimulated SM1HAND, suprathreshold rTMS was associated with well‐localized increases in normalized rCMRglc in the caudal SMA and ACC on the medial wall of the frontal cortex and in the right precentral gyrus in the lateral PMC rostrally to the SM1. These data demonstrate that a selective activation of the SM1HAND is paralleled by an activation of a distinct set of remote premotor areas, suggesting a functional interaction between the primary motor and premotor cortex in humans. Hum. Brain Mapping 12:157–167, 2001. © 2001 Wiley‐Liss, Inc.
Keywords: primary sensorimotor hand area, intracerebral connectivity, premotor cortex, repetitive transcranial magnetic stimulation, positron emission tomography
INTRODUCTION
Repetitive transcranial magnetic stimulation (rTMS), which allows the administration of magnetic stimuli at frequencies up to 50 Hz over a focal cortical area, has opened up new possibilities for in vivo studies of human cortex physiology complementary to single‐pulse or paired‐pulse transcranial magnetic stimulation [Wassermann, 1998]. For instance, focal rTMS during positron emission tomography [PET] has emerged as a promising approach to the study of cortical excitability and intracerebral connectivity in awake humans [Paus et al., 1997, 1998; Fox et al., 1997; Siebner et al., 1998, 2000]. While conventional PET activation studies focus on the regional hemodynamic and metabolic changes of an entire functional network during the volitional performance of a particular task, PET scanning in combination with focal rTMS offers complementary information due to the selective activation of specific components of a given cortical network devoid of task performance [Paus et al., 1997]. This approach is of particular interest with respect to the cortical network involved in the generation of hand movements as it is not possible to selectively activate an “executive” cortical motor output area, which sends pyramidal outputs to the spinal motoneurons, without activating additional network components participating in higher‐order motor control such as preparation for movement or sensory guidance of movements. By using a suprathreshold stimulation intensity, rTMS over the SM1HAND can efficiently excite the corticospinal motor output projections and induce a ballistic hand movement devoid of any self‐initiated motor behavior. Because rTMS bypasses the volitional processes of motor preparation and planning, functional imaging of the cortical activation pattern during rTMS‐induced hand movements may provide new insights with regard to the specific contribution of SM1HAND to cerebral activation patterns observed during voluntary hand movements.
Due to the tight coupling between regional neuronal activity and regional cerebral metabolic rate of glucose (rCMRglc), [18F]Fluoro‐2‐deoxy‐D‐glucose positron emission tomography ([18F]FDG‐PET) is suitable to map the cerebral pattern of altered functional neuronal activity in awake human volunteers [Phelps et al., 1979; Fox et al., 1988]. We have previously shown that the concurrent use of [18F]FDG‐PET and rTMS allows quantification and localization of immediate regional brain activation during the administration of rTMS [Siebner et al., 1998] as well as the assessment of outlasting brain activation after the cessation of rTMS [Siebner et al., 2000]. Combining rTMS and [18F]FDG‐PET, the present study reports the functional activation in remote “executive” frontal motor output areas during rTMS of the left SM1HAND.
METHODS
Subjects and experimental design
Twelve healthy right‐handed volunteers (nine males and three females) aged 24 to 64 years (mean age: 38 ± 14 years) were studied. All subjects gave their written informed consent and the protocol was approved by the ethics committee of the Technische Universität München and the radiation protection authorities. In each subject, two measurements of rCMRglc were performed with [18F]FDG‐PET during two experimental conditions acquired in a random order on different days. The experimental conditions consisted of a baseline condition without rTMS and an activation condition with suprathreshold rTMS delivered to the left SM1HAND during the uptake‐period of [18F]FDG (i.e., “rTMS condition”).
In both experimental conditions, the subjects were instructed to keep their arms completely relaxed. Prior to the study, the subjects were familiarized with the intended rTMS and PET procedures. The subjects were comfortably seated in a room near to the PET scanner for 20 min following the injection of 4 mCi [18F]FDG. The arms were supported by a splint. All subjects wore earplugs and eye patches during the entire study. Twenty minutes after the injection of [18F]FDG, the subjects were guided into the PET scanner for data acquisition, which started 30 min after tracer injection.
Repetitive transcranial magnetic stimulation
An eight‐shaped, tangentially orientated coil MC‐B70 and a Mag‐Pro stimulator were used for rTMS (Medtronic‐neuromuscular, Skovlunde, Denmark). The stimulus had a biphasic waveform with a pulse width of 200 μs and a rise time of 50 μs. The intersection of the two wings of the magnetic coil was placed over the optimum scalp position to evoke a motor response from the right index finger extensor muscle with the handle of the coil pointed occipitally. With the coil center placed 4 cm laterally to the vertex and the handle of the coil pointing occipitally, stimulator output was increased until a magnetically evoked extension of the index finger was reliably obtained. The motor cortex was searched using a grid of sites spaced at 1‐cm intervals to locate the stimulation site producing the largest muscle twitches during five consecutive stimuli. In order to ensure constant stimulation conditions, a mechanical coil holder was used and the coil position was drawn on the skin of the scalp. Constant coil position was continuously monitored during the rTMS session. No stereotactic methods for coil positioning were employed, since coregistration studies have shown that the optimum position of the magnetic coil for eliciting a motor response in the contralateral distal upper limb corresponds closely to the functionally activated SM1HAND during volitional hand movements [Wassermann et al., 1996; Krings et al., 1997].
During the rTMS‐condition, rTMS was delivered over the left SM1HAND at an average frequency of 2 Hz and at an intensity of 140% of motor resting threshold. Prior to rTMS, motor resting threshold of the right index finger extensor muscle was determined according to published IFCN guidelines [Rossini et al., 1994]. In order to avoid anticipation of the magnetic stimuli, the interstimulus interval varied randomly between 0.4 to 0.6 sec. Suprathreshold 2 Hz rTMS started immediately after the injection of the radioisotope. One rTMS session consisted of a total number of fifteen 1‐minute trains separated by an intertrain interval of 10 sec. Thus, a total number of 1,800 magnetic stimuli were applied during the rTMS condition. In all subjects, 2 Hz rTMS elicited a stereotyped pattern of ballistic arm movements, consisting of an extension of the fingers and the hand and a flexion of the forearm. Movement pattern did not change throughout the rTMS session. Figure 1 illustrates the experimental procedure during the rTMS condition.
Figure 1.
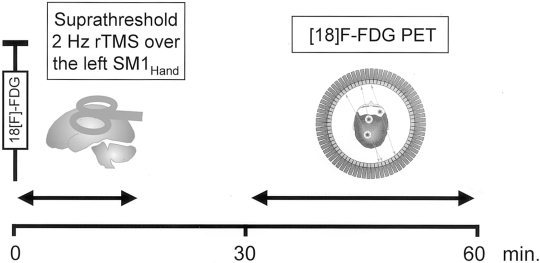
Graphic representation of the experimental procedures during the “rTMS condition.” Immediately after the intravenous injection of the radioisotope, rTMS was delivered over the left SM1HAND at an average frequency of 2 Hz and at an intensity of 140% of motor resting threshold. One rTMS session consisted of a total number of fifteen 1‐min trains separated by an intertrain interval of 10 sec, corresponding to a total number of 1,800 magnetic stimuli. Data acquisition started 30 min after tracer injection.
Our stimulation protocol used parameters, which, at first glance, exceeded the parameters recommended in the preliminary safety guidelines for rTMS [Wassermann, 1998]. However, it is worth noting that the guidelines published by Wassermann [1998] provide no detailed information about the safety margins of rTMS at 2 Hz. Moreover, the safety margins referred to “regularly repeated TMS” at a constant frequency [Wassermann, 1998]. By contrast, we applied irregular rTMS at interstimulus intervals varying between 0.4 to 0.6 sec. As the risk of potential adverse effects may differ between regular rTMS and irregular rTMS, it is difficult to transfer the published safety margins for regular rTMS to the stimulation protocol used in the present study.
Positron emission tomography scanning and image reconstruction
PET measurements were performed using a Siemens 951 R/31 PET scanner (CTI, Knoxville, TN) in 2D mode with a total axial field of view of 10.5 cm and no interplane dead space under standard resting conditions with the ears plugged and the eyes closed in dimmed ambient light. Attenuation was corrected using a head‐holder transmission scan (2D) with an external 68Ge/68Ga ring source obtained prior to the tracer injection. An intravenous bolus of 4 mCi [18F]FDG was injected 30 min prior to the acquisition, which consisted of three 10‐min frames. Images were reconstructed by filtered back‐projection with a Hanning filter (cut‐off frequency 0.4 cycles/projection element), resulting in 31 slices with a 128 × 128 pixel matrix (pixel size 2.0 mm) and an interplane separation of 3.375 mm.
Predefined cortical areas of interest
Instead of inspecting all volume elements, data analysis was prospectively restricted to a distinct set of brain areas in the frontal agranular cortex, which could be expected to participate in the actual generation of the corticospinal motor output during hand movements in humans. On the basis of previous PET activation studies on humans and the anatomic and physiological literature on nonhuman primates, we defined a frontal “executive” motor network including the primary sensorimotor cortex (SM1), the supplementary motor area (SMA), the lateral premotor cortex (PMC), and the motor part of the anterior cingulate cortex (ACC) of either hemisphere. The notion that the SM1, the SMA, the lateral PMC, and the ACC constitute an “executive” frontal motor network is based on three lines of reasoning. First, all these areas have been reported to be functionally active during the execution of simple hand movements in previous functional imaging studies on human volunteers [Colebatch et al., 1991; Matelli et al., 1993; Dettmers et al., 1995]. Second, studies on monkeys have shown that each area is strongly interconnected with the somatotopically corresponding part of the other frontal executive motor areas [Luppino et al., 1991, 1993; Morecraft and Van Hoesen, 1992]. Third, in monkeys, all these areas send direct corticospinal pyramidal projections, including large corticospinal neurones, to the cervical cord [MacPherson et al., 1982; Dum and Strick, 1991; He et al., 1993, 1995]. Based on these data, we hypothezised that the functional effects of rTMS on synaptic brain activity may not be limited to the stimulated left SM1HAND but may also involve anatomically and functionally interconnected motor and premotor areas in the frontal cortex.
Because data analysis was a priori restricted to a distinct set of “executive” primary motor and premotor areas, the present study investigated only a subset of brain regions that are interconnected with SM1HAND [Stepniewska et al., 1993; Tokuno and Tanji, 1993]. In order to achieve maximal statistical power, other known bilateral connections to sensory cortical areas in the parietal lobe and deep brain structures, such as the basal ganglia and the thalamus, were not included as areas of interest [Stepniewska et al., 1993; Tokuno and Tanji, 1993]. Thus, we like to stress the point that the present study brings into focus the functional activation of the frontal primar motor and premotor cortex during suprathreshold rTMS of the left SM1HAND, but it does not provide comprehensive information about intracortical connectivity of the stimulated SM1HAND.
Because PET images were anatomically standardized to the stereotactic atlas of Tailairach and Tournoux [1988] as a prerequisite for across subject comparisons, the Talairach coordinates (x/y/z in millimetres) were employed to spatially define three cubes, covering the SM1HAND, the caudal SMA, the motor part of the ACC, and the lateral PMC of both hemispheres. The use of the stereotactic coordinates for the definition of area of interest also minimized observer biases. The two cubes, which bounded the SM1HAND and the adjacent lateral PMC of both hemispheres included all voxels with the x/y/z coordinates: x = 15 to 55 (right hemisphere), ‐15 to ‐55 (left hemisphere), y = 5 to ‐35, and z = 30 to 60. A medial cube was placed over both caudal SMAs and adjacent ACC and comprised all voxels with the x/y/z coordinates: x = ‐15 to 15, y = 15 to ‐25, and z = 30 to 60. This bounding procedure resulted in a total search volume of 132 ml. Only the voxels within this search volume were subjected to data analysis.
Image analysis
PET image analysis was performed using a fully automated program (NEUROSTAT, Department of Internal Medicine, University of Michigan, Ann Arbor, MI). Data analysis involves coregistration between scans obtained with different conditions for each subject, realignment of the PET images to the bicommissure stereotactic coordinate system [Minoshima et al., 1992], and transformation of the PET data into the stereotactic space of Talairach and Tournoux [1988] using linear scaling and nonlinear warping [Minoshima et al., 1994]. In order to account for small residual interindividual differences in gyral anatomy, PET images were smoothed with a three‐dimensional Gaussian filter to an estimated resolution of approximately 19 mm full‐width at half‐maximum (FWHM). Radioactivity distribution (i.e., [18F]FDG uptake and trapping) was analyzed semiquantitavely by normalizing regional cerebral [18F]FDG utilization to the global mean with the use of a linear proportional model to remove baseline differences between scans and subjects [Fox et al., 1984].
Relative differences in normalized rCMRglc between the baseline condition and the rTMS condition were calculated on a voxel‐by‐voxel basis using a two‐sample Student's t‐test and a pooled variance estimated from the whole brain grey matter [Minoshima et al., 1992]. Subsequently, the calculated t‐values were transformed into normally distributed Z‐values (i.e., number of standard deviations) and the level of significance of areas of activation was assessed by peak height of their foci, using estimations based on the theory of random Gaussian fields [Worsley et al., 1992].
Because the a priori research hypotheses were limited to a distinct subset of brain areas, a significance threshold was determined by controlling a type I error rate at P < 0.05 based on the estimated smoothness of the images and the predefined volume of interest (i.e., resulting in a number of seven resels). The estimated statistical threshold for the a priori hypothesized cortical areas was Z = 3.13 (corresponding to an uncorrected P value of 0. 0008).
Intra‐individual volume‐of‐interest analysis
In addition to the categorical comparison of the pooled group data, an intra‐individual volume‐of‐interest (VOI) analysis was applied as a descriptive approach to estimate spatial patterns of relative changes in normalized rCMRglc. The same image‐processing tool was used for coregistration and pixel‐value normalization but without stereotactic normalization. The images were interpolated to 60 slices, and smoothing was necessary only up to an effective resolution of approximately 8 mm FWHM. For exact neuroanatomical localization, the resulting subtraction images were overlaid onto individual T1‐weighted MRIs [Pietrzyk et al., 1994]. Anatomic landmarks such as the “precentral knob” for the primary motor hand area were used to guide accurate placement of the VOI [Yousry et al., 1997]. On three adjacent planes, a circular VOI of 2 cm in diameter was placed in five cortical areas of interest: the left and right SM1HAND, the caudal parts of the SMA and ACC, and an area in the right precentral gyrus 2 cm rostrolaterally to the right SM1HAND. With regard to the VOI in the SMA and ACC, the VOI were symmetrically placed rostrally to the medial precentral sulcus over the midline. Identical axial sections were used for the VOI placement in the SMA and the left SM1HAND. Whereas, the VOI in the ACC was determined using the axial sections about 1.5 cm more ventrally to the SM1HAND.
RESULTS
None of the subjects reported any adverse side effect during the course of the study. Suprathreshold irregular 2 Hz rTMS of the left SM1HAND resulted in a distinct pattern of relative changes in rCMRglc in the predefined set of motor and premotor areas within the frontal cortex. With respect to the sense of rCMRglc changes, suprathreshold irregular 2 Hz rTMS exclusively caused focal increases in normalized rCMRglc in the cortical areas of interest. No relative decreases in rCMRglc occured in the predefined cortical areas during the rTMS condition, even when a lower statistical threshold of P < 0.01 (uncorrected) was applied. Figure 2 shows axial color‐coded Z‐score subtraction maps indicating categorial rCMRglc increases in the cortical regions of interest during 2 Hz rTMS of SM1HAND as compared to baseline without rTMS. Note that the maps are superimposed onto stereotactically normalized axial T1‐weighted MRI images and thresholded to an uncorrected value of P < 0.01 in order to show both the spatial extent of respective rCMRglc increases and the lack of additional rCMRglc increase within the frontal cortex. Table I gives the stereotaxic coordinates and Z‐values for the maxima of relative rCMRglc increases in the predefined frontal motor and premotor areas.
Figure 2.
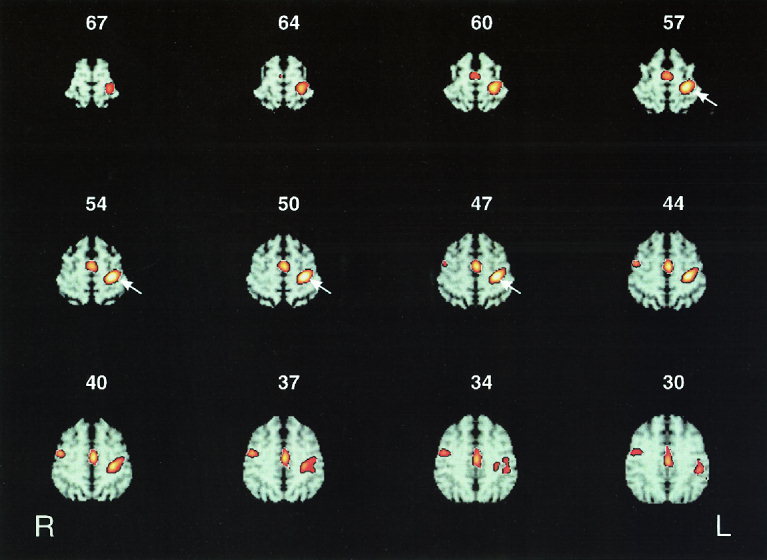
Twelve axial sections of color‐coded statistical Z‐score maps showing regions of significant relative increases in normalized rCMRglc at the level of the primary sensorimotor area representing the hand (SM1HAND), the supplementary motor area (SMA) and the anterior cingulate cortex (ACC). The number at the top of each axial section denotes the axial position relative to the intercommissural line in millimeters. For illustrative purposes, the statistical parametric maps are superimposed onto corresponding axial sections of stereotactically normalized T1‐weighted MRI images and thresholded at an uncorrected P value of 0.01. Right side of the axial sections corresponds to the left hemisphere. White arrows delineate the stimulated left SM1HAND. In addition to a relative increase in normalized rCMRglc in the stimulated left SM1HAND, suprathreshold rTMS at a mean frequency of 2 Hz resulted in relative rCMRglc increases in the caudal parts of the SMA and the ACC on the medial wall of the hemispheres as well as in the right precentral gyrus on the hemispheric surface.
Table I.
| Cortical region | Brodmann Area (BA) | Z‐score | P value (uncorrected) | Talairach coordinates in millimetres | ||
|---|---|---|---|---|---|---|
| x | y | z | ||||
| Left precentral gyrus | BA 3/4 sinister | 4.44 | 0. 000004* | −30 | −22 | 52 |
| Mesial frontal cortex | BA 6/24 mesial | 3.78 | 0. 00008* | 3 | −8 | 47 |
| Anterior cingulate gyrus | BA 24 mesial | 3.45 | 0. 0003* | −1 | −17 | 34 |
| Right precentral gyrus | BA 6 dexter | 3.30 | 0. 0005* | 48 | −1 | 45 |
P < 0.05, corrected for multiple nonindependent comparisons within the predefined brain volume.
Suprathreshold 2 Hz rTMS over the left SM1HAND was associated with a local relative increase of rCMRglc in the stimulated cortex (BA 3/4). VOI analysis revealed a consistent focal increase in rCMRglc within the stimulated SM1HAND, ranging from 3.0% to 11.6% (Table II). In addition to the “under‐the‐coil” increase of rCMRglc in the stimulated left SM1HAND, suprathreshold 2 Hz rTMS resulted in a cluster of significant relative rCMRglc increase in remote executive motor areas within the medial wall of the frontal cortex, including the caudal parts of the SMA (BA 6) and the ACC (BA 24). The medial cluster was centered on the midline and the extension of the cluster showed no apparent shift toward the right or left cerebral hemisphere (Fig. 2). Within this medial cluster, within‐group subtraction analysis revealed two distinct foci of maximal activation (Table I). The first peak activation was located 8 mm posteriorly to the vertical anterior commissural line at the border between caudal SMA and ACC (BA 6/24; x/y/z = 3/‐8/47). A second focal peak of relative rCMRglc increase was situated more ventrally and caudally in the posterior portion of the ACC (BA 24; x/y/z = 1/‐17/34). The axial Z‐score subtraction maps showed that the relative rCMRglc increase in the medial frontal cortex extended to the axial slices 60 mm cranially to the AC‐PC line, indicating that rTMS‐related activation of the medial frontal cortex included the SMA (Fig. 2). Accordingly, VOI‐analysis showed a mean relative increase of about 5% in both mesial areas, caudal SMA and caudal ACC (Table II).
Table II.
| Volume of interest | |||||
|---|---|---|---|---|---|
| Left SM1(HAND) | Right SM1(HAND) | Caudal SMA | Caudal ACC | Right lateral PMCa | |
| Subject 1 | 10.4% | −3.9% | 2.3% | 0.7% | −2.6% |
| Subject 2 | 8.1% | 3.9% | 1.1% | 8.7% | 8.1% |
| Subject 3 | 3.0% | −2.4% | 1.4% | 2.1% | 3.9% |
| Subject 4 | 4.4% | −3.3% | 4.3% | 7.5% | 7.7% |
| Subject 5 | 4.5% | 0.7% | 3.8% | 6.9% | 3.0% |
| Subject 6 | 10.0% | −2.6% | 4.8% | 3.8% | 2.2% |
| Subject 7 | 8.7% | 1.8% | 4.3% | 5.1% | 8.9% |
| Subject 8 | 4.7% | −1.6% | 5.2% | 6.5% | 4.7% |
| Subject 9 | 8.5% | 2.3% | 5.6% | 7.8% | 5.7% |
| Subject 10 | 8.6% | 2.2% | 5.6% | 5.3% | 5.9% |
| Subject 11 | 11.6% | 4.1% | 3.5% | 2.9% | 3.1% |
| Subject 12 | 8.6% | −1.5% | 6.9% | 6.3% | 2.3% |
| Average | 7.6% | 0.5% | 4.1% | 5.3% | 4.8% |
rostrolaterally to the right SM1(HAND).
No consistent changes in rCMRglc were found within the homologous hand representation of the contralateral right SM1HAND during the rTMS condition. This was observed even when a low statistical threshold of P < 0.01 (uncorrected) was applied (Fig. 2). Revealing a mean rCMRglc change of less than 1%, VOI analysis confirmed that there was no consistent rCMRglc change in the homologous right SM1HAND (Table II). However, a circumscribed area of increased rCMRglc was observed in the right precentral gyrus on the hemispheric surface, which was located rostrally to SM1 (BA 6; x/y/z = 48/‐1/45). Peak activation of this cluster in the right precentral cortex was located about 2 cm more laterally and anteriorly, and about 1 cm more ventrally as compared to the site of maximum activation in the stimulated left SM1HAND. VOI analysis revealed a mean rCMRglc increase of about 5% during suprathreshold rTMS of the left SM1HAND (Table II).
DISCUSSION
We found a well‐circumscribed neuronal activation in both the medial wall and on the right hemispheric surface of the frontal agranular cortex during suprathreshold irregular 2 Hz rTMS of the left SM1HAND (Fig. 2). This finding confirms and extends a recent H2 15O‐PET activation study on three healthy subjects, which has shown that focal suprathreshold rTMS of the primary sensorimotor cortex is associated with significant relative changes in rCBF in functionally interconnected cortical areas distant from the stimulation site [Fox et al., 1997].
In the first section of the discussion, we will address the principal neurophysiological mechanisms that might have contributed to the functional activation in remote areas of the frontal premotor cortex. In the second section, we will discuss the local activation within the stimulated left SM1HAND, and in the third section, we will comment on the remote activation of the frontal premotor areas.
Methodological considerations
A principal mechanism underlying rTMS‐related activation of remote cortical areas appears to be a suprathreshold activation of corticocortical neuronal connections that link remote functionally related cortical areas. Several studies, using either a double‐stimulus paradigm [Ferbert et al., 1992; Ugawa et al., 1993; Schnitzler et al., 1996] or event‐related electroencephalography after focal TMS [Cracco et al., 1989; Ilmoniemi et al., 1997] have demonstrated that focal rTMS of SM1HAND is capable of excitating corticocortical fibers linking both precentral gyri. Corticocortical activation during focal rTMS may be caused by an orthodromic activation of remote cortical areas via efferent corticofugal neurons. Alternatively, Fox et al. [1997] suggested that an antidromic activation of recurrent axon collaterals of afferent corticocortical neurons might also occur during focal rTMS. Moreover, the activation of cortico‐subcortico–cortical reentry circuits may result in a modulation of neuronal activity in remote cortical areas.
Because the goal of the present study was to image the primary motor cortex “at work” (i.e., while actually generating a limb movement), we applied rTMS at a suprathreshold stimulation intensity, which consistently evoked stereotyped ballistic movements of the contralateral upper limb. Therefore, sensory feedback from the moving limb may have contributed to functional activation in remote frontal motor executive areas, especially in the caudal SMA. A previous study in monkeys demonstrated an abundant number of neurons responding to passive somatosensory stimuli in the caudal part of the SMA [Hummelsheim et al., 1988] and PET activation studies in humans have reported a significant activation of the SMA in response to vibrotactile stimulation of the distal upper limb [Seitz and Roland, 1992; Tempel and Perlmutter, 1992].
In addition to corticocortical activation and sensory feedback from the moving limb, unspecific effects related to rTMS have to be considered when remote effects of rTMS are assessed in combined rTMS / PET activation studies [Siebner et al., 1999]. The acoustic input from the noise generated by the discharging coil, the somatosensory input from TMS‐related stimulation of trigeminal afferents, and emotional or cognitive reactions to rTMS (i.e., unpleasantness or attention) may modulate the neuronal activity in brain areas remote from the stimulation site.
Functional activation of the stimulated primary motor hand area (SM1HAND)
Several coregistration studies have demonstrated that TMS applied at the optimum scalp position for eliciting a motor reponse in the contralateral hand muscles results in a cortex activation of the precentral gyrus forming the anterior lip, which coincides with the activated region during finger tapping [Krings et al., 1997; Wassermann et al., 1996]. Accordingly, the Talairach coordinates of peak activation in the transcranially stimulated left SM1HAND (x/y/z = ‐30/‐22/50) matched closely with the average probabilistic location of the left SM1HAND (x/y/z = ‐31/‐22/52) as derived from a meta‐analysis of previous blood flow activation studies [Paus et al., 1998]. This finding strongly suggests that no stereotactic methods are required to define the optimum scalp position in combined rTMS/PET studies targeting the SM1HAND.
Functional activation of remote premotor areas
Suprathreshold 2 Hz rTMS of the left SM1HAND resulted in a significant rCMRglc increase in the caudal SMA and the adjacent caudal ACC (BA 6/24). Recent combined anatomic and microstimulation studies in monkeys have provided convincing evidence that in the monkeys the SMA can be segregated into at least two functionally distinct areas: a caudal area F3 and a rostral area F6 [Luppino et al., 1991; Matelli et al., 1991]. It appears that caudal SMA proper (F3) is more related to movement execution, whereas the rostral pre‐SMA (F6) is more related to higher‐level motor functions [see, for review, Tanji, 1994]. Moreover, at least two additional motor areas (24d and 24c) were identified in the adjacent agranular caudal part of the ACC [Luppino et al., 1991; Matelli et al., 1991; Morecraft and Van Hoesen, 1992]. In monkeys, the caudal part of the SMA and the adjacent ACC send strong projections to the cervical spinal cord underscoring their involvement in motor execution, and these areas are heavily interconnected with the primary motor cortex [Dum and Strick, 1991]. In humans, cytoarchitectonic and receptor autoradiographic data as well as functional neuroimaging suggest a similar rostro‐caudal segregation of the SMA [Matelli et al., 1993; Tanji et al., 1994; Zilles et al., 1996]. In the present study, peak activations in the SMA and the ACC were located posteriorly to the vertical anterior commissural line (VAC line). Because the rostral and caudal SMA appear to be roughly separated by the VAC line [Zilles et al., 1996], the location of the activation foci in the mesial premotor cortex demonstrates that focal rTMS of SM1HAND activated the “executive” caudal portions of the SMA and ACC, well fitting to the connectivity pattern between the primary motor cortex and the mesial frontal motor areas in monkeys [Luppino et al., 1993].
The present data suggest a symmetric activation of left and right SMA and ACC (Fig. 2). Because the projections from the primary motor cortex to bilateral SMA and ACC are not alike [Rouiller et al., 1994], one may expect an asymmetric activation pattern of the mesial frontal motor areas. Indeed, Fox et al. [1997] reported a preponderant right‐hemispheric activation of the SMA during focal suprathreshold rTMS of the left primary sensorimotor cortex. Thus, the apparent symmetric activation of left and right SMA and ACC is likely caused by smoothing of the data, resulting in a limited spatial resolution. It is hypothesized that other functional imaging modalities such as functional magnetic resonance imaging may reveal an asymmetric activation of frontal midline structures during unilateral rTMS of the SM1HAND.
In addition to the activation of mesial frontal motor areas, suprathreshold 2 Hz rTMS of the left SM1HAND was associated with focal neuronal activation in the contralateral right precentral gyrus on the hemispheric surface. This finding is in accordance with previous TMS studies that reported an interhemispheric functional interaction between both precentral gyri during suprathreshold focal TMS of SM1HAND [Ferbert et al., 1992; Schnitzler et al., 1996; Ilmoniemi et al., 1997]. The center of activation in the rostral part of the right precentral gyrus was located about 2 cm more anteriorly and laterally and about 1 cm more ventrally as compared to the activation focus within the stimulated left SM1HAND. In terms of Talairach coordinates, the right precentral activation during suprathreshold focal rTMS of the left SM1HAND may reflect functional activation of either the right frontal eye field (FEF) [Paus et al., 1996] or the ventrodorsal part of the lateral PMC [Fink et al., 1997]. We can only speculate about the functional relevance of the activated focus in the right precentral gyrus. It is likely that suprathreshold rTMS over the left SM1HAND caused an activation of the right precentral gyrus because of increased spatial attention triggered by either left‐sided somatosensory sensation of the skull or rTMS‐evoked movements of the right forearm [Nobre et al., 1997; Corbetta, 1998]. Alternatively, the well‐circumscribed functional activation of the right precentral gyrus may be caused by a corollary transcallosal motor discharge from the stimulated left SM1HAND and adjacent left PMC, which may be used by the right lateral PMC for online monitoring of movement execution [Geffen et al., 1994] or for accurate coding of oculomotor and somatomotor space [Iacobini et al., 1997].
In the present study, we found no evidence for a change in net neuronal activity within the right primary motor cortex, including the right homologous SM1HAND. This lack of change in rCMRglc in the right homologous SM1HAND seems at odds with neurophysiological TMS studies that have suggested a strong but short‐lasting transcallosal inhibitory interaction between the homologous primary motor hand areas following unilateral suprathreshold TMS of SM1HAND [Ferbert et al., 1992; Meyer et al., 1998; Schnitzler et al., 1996]. Moreover, in a combined rTMS/H2 15O‐PET study, Fox et al. [1997] found a negative correlation between rCBF in the stimulated left SM1 and the contralateral right SM1, which they referred to a transcallosally mediated inhibition. Although Fox et al. [1997] used the same number of stimuli of suprathreshold rTMS (i.e., 1,800) as in the present study, there are notable differences between both studies, which render a direct comparison difficult. It is worth noting that Fox et al. [1997] stimulated a different subdivision of the left SM1, which, in terms of Talairach coordinates (peak activation at x/y/z = ‐37/–9/28), was located more than 2 cm ventrolaterally from the probabilistic localization of SM1HAND [Paus et al., 1998]. This ventrolateral subdivision of the SM1, presumably representing the neck and face area of the left SM1, is expected to have stronger transcallosal connections with its homologous counterpart in the opposite hemisphere than the SM1HAND [Pandya and Vigolo, 1971; Rouiller et al., 1994]. Moreover, in contrast to our study, Fox et al. [1997] applied rhythmic rTMS at a constant interstimulus interval and performed a regression analysis of the PET data (i.e., statistical parametric mapping of correlation coefficients).
There are several possible explanations for a lack of relative change in rCMRglc within the right homologous SM1HAND during suprathreshold 2 Hz rTMS of the left SM1HAND in the present study. Because inhibitory postsynaptic potentials are themselves caused by energy‐requiring mechanisms [Ackermann et al., 1984; Raichle et al., 1987; Nudo and Masterton, 1996], it is conceivable that the inhibitory synaptic activity of transcallosal corticocortical neurons deriving from the stimulated SM1HAND may have balanced the depression of intracortical synaptic activity caused by the same inhibitiory transcallosal neurons without any change in net neuronal activity in the right SM1HAND. Moreover, a recent event‐related fMRI study demonstrated that inhibitory events appear to be less metabolically demanding and, thus, may produce no measurable change in functional imaging [Waldvogel et al., 2000]. The failure to detect a discrete change in rCMRglc in the right homologous SM1HAND may also be related to the task‐subtraction design of the present study. A parametric study design may be a more sensitive approach to assess functional transcallosal connectivity between SM1HAND [Paus et al., 1998]. Finally, functional connectivity between SM1HAND may be less functionally relevant as previously suggested by TMS studies [Ferbert et al., 1992; Meyer et al., 1998; Schnitzler et al., 1996]. In favour of this notion, studies on nonhuman primates have shown that in monkeys, the callosal connections between the homologous SM1HAND are sparse compared with the numerous connections between the SM1 representation of proximal arm muscles [Pandya and Vigolo, 1971; Rouiller et al., 1994]. Moreover, a study by Gerloff et al. [1998] demonstrated that TMS‐induced ipsilateral motor inhibition of hand muscles is mediated to a significant extent at a subcortical level.
In conclusion, the present study underscores the feasibility of repeated [18F]FDG‐PET measurements of normalized rCMRglc for visualizing functional brain activation in remote cortical areas during focal rTMS. Simultaneous rTMS and nonquantitative [18F]FDG‐PET can be performed more routinely than combined rTMS / H2 15O PET studies, as this method requires neither an onsite cyclotron unit nor magnetic shielding of the PET detectors. Using the combined rTMS / [18F]FDG‐PET approach, the present data have provided complementary insights into the function of the primary motor and premotor cortex as compared to conventional functional imaging studies during volitional hand movements. During suprathreshold rTMS of the left SM1HAND, corticocortical excitation and sensory feedback information resulted in a functional activation of distinct premotor areas. This concurrent activation of remote premotor areas during suprathreshold rTMS of SM1HAND strongly suggests that the frontal motor output areas are functionally linked together, allowing for cooperation during the generation of hand movements.
Acknowledgements
The authors thank Mr. H. Riescher for his technical assistance, Mrs. S. Fürst, Ms. G. Dzewas, and Ms. C. Kruschke for their assistance during PET acquisition; and Ms. N. Nguyen for careful review of the manuscript.
REFERENCES
- Ackermann RF, Finch DM, Babb TL, Engel J (1984): Increased glucose metabolism during long‐duration recurrent inhibition of hippocampal pyramidal cells. J Neurosci 4: 251–264. [DOI] [PMC free article] [PubMed] [Google Scholar]
- Colebatch JG, Deiber MP, Passingham RE, Friston KJ, Frackowiak RSJ (1991): Regional cerebral blood flow during voluntary arm and hand movements in human subjects. J Neurophysiol 65: 1392–1401. [DOI] [PubMed] [Google Scholar]
- Corbetta M (1998): Frontoparietal cortical networks for directing attention and the eye to visual locations: identical, independent, or overlapping neural systems? Proc Natl Acad Sci USA 95: 831–838. [DOI] [PMC free article] [PubMed] [Google Scholar]
- Cracco RQ, Amassian VE, Maccabee PJ, Cracco JB (1989): Comparison of human transcallosal resonses evoked by magnetic coil and electrical stimulation. Electroenceph Clin Neurophysiol 74: 417–424. [DOI] [PubMed] [Google Scholar]
- Dettmers C, Fink GR, Lemon RN, Stephan KM, Passingham RE, Silbersneig D, Holmes A, Ridding MC, Brooks DJ, Frackowiak RS (1995): Relation between cerebral activity and force in motor areas of human brain. J Neurophysiol 74: 802–815. [DOI] [PubMed] [Google Scholar]
- Dum RP, Strick PL (1991): The origin of corticospinal projections from the premotor areas in the frontal lobes. J Neurosci 11: 667–689. [DOI] [PMC free article] [PubMed] [Google Scholar]
- Ferbert A, Priori A, Rothwell JC, Day BL, Colebatch JG, Marsden CD (1992): Interhemispheric inhibition of the human motor cortex. J Physiol (Lond) 453: 525–546. [DOI] [PMC free article] [PubMed] [Google Scholar]
- Fink GR, Frackowiak RSJ, Pietrzyk U, Passingham RE (1997): Multiple nonprimary motor areas in the human cortex. J Neurophysiol 77: 2164–2174. [DOI] [PubMed] [Google Scholar]
- Fox PT, Raichle ME (1984): Stimulus rate dependence of regional cerebral blood flow in human striate cortex demonstrated by positron emission tomography. J Neurophysiol 51: 1109–1120. [DOI] [PubMed] [Google Scholar]
- Fox PT, Raichle ME, Mintun CD, Dence C (1988): Nonoxidative glucose consumption during focal physiologic neural activity. Science 241: 462–464. [DOI] [PubMed] [Google Scholar]
- Fox P, Ingham R, George MS, Mayberg H, Ingham J, Roby J, Martin C, Jerabek P (1997): Imaging intra‐cerebral connectivity by PET during TMS. Neuroreport 8: 2787–2791. [DOI] [PubMed] [Google Scholar]
- Geffen GM, Jones DL, Geffen LB (1994): Interhemispheric control of manual motor activity. Behav Brain Res 64: 131–140. [DOI] [PubMed] [Google Scholar]
- Gerloff C, Cohen LG, Floeter MK, Chen R, Corwell B, Hallett M (1998): Inhibitory influence of the ipsilateral motor cortex on responses to stimulation of the human cortex and pyramidal tract. J Physiol (Lond) 510: 249–259. [DOI] [PMC free article] [PubMed] [Google Scholar]
- He SQ, Dum RP, Strick PL (1993): Topographic organization of corticospinal projections from the frontal lobe: motor areas on the lateral surface of the hemisphere. J Neurosci 13: 952–980. [DOI] [PMC free article] [PubMed] [Google Scholar]
- He SQ, Dum RP, Strick PL (1995): Topographic organization of corticospinal projections from the frontal lobe: motor areas on the medial surface of the hemisphere. J Neurosci 15: 3284–3306. [DOI] [PMC free article] [PubMed] [Google Scholar]
- Hummelsheim H, Bianchetti M, Wiesendanger M, Wiesendanger R (1988): Sensory inputs to the agranular motor fields: a comparison between precentral, supplementary‐motor and premotor areas in monkey. Exp Brain Res 69: 289–298. [DOI] [PubMed] [Google Scholar]
- Iacobini M, Woods RP, Lenzi GL, Mazziotta JC (1997): Merging of oculomotor and somatomotor space coding in the human right precentral gyrus. Brain 120: 1635–1645. [DOI] [PubMed] [Google Scholar]
- Ilmoniemi RJ, Virtanen J, Ruohonen J, et al. (1997): Neuronal responses to magnetic stimulation reveal cortical reactivity and connectivity. Neuroreport 8: 3537–3540. [DOI] [PubMed] [Google Scholar]
- Krings T, Buchbinder BR, Butler WE, Chiappa KH, Jiang HJ, Cosgrove GR, Rosen BR (1997): Functional magnetic resonance imaging and transcranial magnetic stimulation: complementary approaches in the evaluation of cortical motor function. Neurology 48: 1406–1416. [DOI] [PubMed] [Google Scholar]
- Luppino G, Matelli M, Camarda RM, Gallese V, Rizzolatti G (1991): Multiple representations of body movements in mesial area 6 and the adjacent cingulate cortex: an intracortical microstimulation study in the macaque monkey. J Comp Neurol 311: 463–482. [DOI] [PubMed] [Google Scholar]
- Luppino G, Matelli M, Camarda R, Rizzolatti G (1993): Corticocortical connections of area F3 (SMA‐proper) and area F6 (pre‐SMA) in the macaque monkey. J Comp Neurol 338: 114–140. [DOI] [PubMed] [Google Scholar]
- MacPherson JM, Wiesendanger M, Marangoz C, Miles TS (1982): Corticospinal neurones of the supplementary motor area of monkeys. A single unit study. Exp Brain Res 48: 81–88. [DOI] [PubMed] [Google Scholar]
- Matelli M, Luppino G, Rizzolatti G (1991): Architecture of superior and mesial area 6 and the adjacent cingulate cortex in the macaque monkey. J Comp Neurol 311: 445–446. [DOI] [PubMed] [Google Scholar]
- Matelli M, Rizzolatti G, Bettinardi V, Gilardi MC, Perani D, Rizzo G, Fazio F (1993): Activation of precentral and mesial motor areas during the execution of elementary proximal and distal arm movements. A PET study. Neuroreport 4: 1295–1298. [DOI] [PubMed] [Google Scholar]
- Meyer BU, Röhricht S, Woiciechowsky C (1998): Topography of fibers in the human corpus callosum mediating interhemispheric inhibition between the motor cortices. Ann Neurol 43: 360–369. [DOI] [PubMed] [Google Scholar]
- Minoshima S, Koeppe RA, Mintun MA, Berger KL, Taylor SF, Frey KA, Kuhl DE (1993): Automated detection of the intercommissural line for stereotactic localization of functional brain images. J Nucl Med 34: 322–329. [PubMed] [Google Scholar]
- Minoshima S, Koeppe RA, Frey KA, Kuhl DE (1994): Anatomic standardization: linear scaling and nonlinear warping of functional brain images. J Nucl Med 35: 1528–1537. [PubMed] [Google Scholar]
- Morecraft RC, Van Hoesen GW (1992): Cingulate input to the primary and supplementary motor cortices in the rhesus monkey: evidence for somatotopy in area 24c and 23c. J Comp Neurol 323: 471–489. [DOI] [PubMed] [Google Scholar]
- Nobre AC, Sebestyen GN, Gitelman DR, Mesulam MM, Frackowiak RS, Frith CD (1997): Functional localization of the system for visuospatial attention using positron emission tomography. Brain 120: 515–533. [DOI] [PubMed] [Google Scholar]
- Nudo RJ, Masterton RB (1986): Stimulation‐induced (14C)2‐deoxyglucose labeling of synaptic activity in the central auditory system. J Comp Neurol 245: 553–565. [DOI] [PubMed] [Google Scholar]
- Pandya DN, Vignolo LA (1971): Intra‐ and interhemispheric projections of the precentral, premotor and arcuate areas in the rhesus monkey. Brain Res 32: 31–43. [PubMed] [Google Scholar]
- Paus T (1996): Location and function of the human frontal eye field: a selective review. Neuropsychologica 34: 475–483. [DOI] [PubMed] [Google Scholar]
- Paus T, Jech R, Thompson C, Comeau R, Peters T, Evans A (1997): Transcranial magnetic stimulation during positron emission tomography: a new method for studying connectivity of human creebral cortex. J Neurosci 17: 3178–3184. [DOI] [PMC free article] [PubMed] [Google Scholar]
- Paus T, Jech R, Thompson C, Comeau R, Peters T, Evans AC (1998): Dose‐dependent reduction of cerebral blood flow during rapid‐rate transcranial magnetic stimulation of the human sensorimotor cortex. J Neurophysiol 79: 1102–1107. [DOI] [PubMed] [Google Scholar]
- Phelps ME, Huang SC, Hoffmann EJ, Selin C, Sokoloff L, Kuhl DE (1979): Tomographic measurement of local cerebral glucose metabolic rate in humans with (F‐18)2‐Fluoro‐2‐Deoxy‐D‐Glucose: validation of method. Ann Neurol 6: 371–388. [DOI] [PubMed] [Google Scholar]
- Pietrzyk U, Herholz K, Fink G, Jacobs A, Mielke R, Slansky I, Wurker M, Heiss WD (1994): An interactive technique for three‐dimensional image registration: validation for PET, SPECT, MRI and CT brain studies. J Nucl Med 35: 2011–2018. [PubMed] [Google Scholar]
- Raichle ME (1987): Circulatory and metabolic correlates of brain function in humans In: Mountcastle VM, Plum F, Geiger SR, editors. Handbook of physiology. Bethesda, MD: American Physiology Society; p 643–674. [Google Scholar]
- Rossini PM, Barker AT, Berardelli A, Caramia MD, Caruso G, Gracco RQ, Dimitrijevic MR, Hallet M, Katayama Y, Luecking CH, Maertens de Noorhuit AL, Marsden CD, Murray NMF, Rothwell JC, Swash M, Tomberg C (1994): Non‐invasive electrical and magnetic stimulation of the brain, spinal cord and roots: basic principles and procedures for routine clinical application. Report of an IFCN committee. Electroencephalogr Clin Neurophysiol 91: 79–92. [DOI] [PubMed] [Google Scholar]
- Rouiller, EM , Babalian A, Kazennikov O, Moret V, Yu XH, Wiesendanger M. (1994): Transcallosal connections of the distal forelimb representations of the primary and supplementary motor cortical areas in macaque monkeys. Exp Brain Res 102: 227–243. [DOI] [PubMed] [Google Scholar]
- Schnitzler A, Kessler KR, Benecke R (1996): Transcallosally mediated inhibition of interneurons within human primary motor cortex. Exp Brain Res 112: 381–391. [DOI] [PubMed] [Google Scholar]
- Seitz RJ, Roland PE (1992): Vibratory stimulation increases and decreases the regional cerebral blood flow and oxidative metabolism: a positron emission tomography (PET) study. Acta Neurol Scand 86: 60–67. [DOI] [PubMed] [Google Scholar]
- Siebner HR, Willoch F, Peller M, Aver C, Boecker H, Conrad B, Bartenstein P (1998): Imaging brain activation by long trains of repetitive transcranial magnetic stimulation. Neuroreport 9: 943–948. [DOI] [PubMed] [Google Scholar]
- Siebner HR, Peller M, Willoch F, Aver C, Barstenstein P, Drzezga A, Schwaiger M, Conrad B (1999): Imaging functional activation of the auditory cortex during focal repetitive transcranial magnetic stimulation of the primary motor cortex in normal subjects. Neurosci Lett 270: 37–40. [DOI] [PubMed] [Google Scholar]
- Siebner HR, Peller M, Willoch F, Minoshima S, Boecker H, Aver C, Drzezga A, Conrad B, Bartenstein P (2000): Lasting cortical activation after repetitive TMS of the motor cortex—a glucose metabolic study. Neurology 54: 956–963. [DOI] [PubMed] [Google Scholar]
- Stepniewska I, Preuss TM, Kaas JH (1993): ) Architectonics, somatotopic organization, and ipsilateral cortical connections of the primary motor area (SM1) of owl monkeys. J Comp Neurol 330: 238–271. [DOI] [PubMed] [Google Scholar]
- Talairach J, Tournoux P (1988): Co‐planar stereotaxic atlas of a human brain. Stuttgart: Thieme. [Google Scholar]
- Tanji J (1994): The supplementary motor area in the cerebral cortex. Neurosci Res 19: 251–268. [DOI] [PubMed] [Google Scholar]
- Tempel LW, Perlmutter JS (1992): Vibration‐induced regional blood flow responses in normal aging. J Cereb Blood Flow Metab 12: 554–561. [DOI] [PubMed] [Google Scholar]
- Tokuno H, Tanji J. (1993): Input organization of distal and proximal forelimb areas in the monkey primary motor cortex: a retrograde double labeling study. J Comp Neurol 333: 199–209. [DOI] [PubMed] [Google Scholar]
- Ugawa Y, Hanajima R, Kanazawa I (1993): Interhemispheric facilitation of the hand area of the human motor cortex. Neurosci Lett 160: 153–155. [DOI] [PubMed] [Google Scholar]
- Waldvogel D, van Gelderen P, Muellbacher W, Ziemann U, Immisch I, Hallett M (2000): The relative metabolic demand of inhibition and excitation. Nature 406: 995–998. [DOI] [PubMed] [Google Scholar]
- Wassermann EM, Wang B, Zeffiro TA, Sadato N, Pascual‐Leone A, Toro C, Hallett M (1996): Locating the motor cortex on the MRI with transcranial magnetic stimulation and PET. Neuroimage 3: 1–9. [DOI] [PubMed] [Google Scholar]
- Wassermann EM (1998): Risk and safety of repetitive transcranial magnetic stimulation: report and suggested guidelines from the international workshop on the safety of repetitive transcranial magnetic stimulation, June 7, 1996. Electroencephalogr Clin Neurophysiol 108: 1–16. [DOI] [PubMed] [Google Scholar]
- Worsley KL, Evans AC, Marrett S, Neelin P (1992): A three‐dimensional statistical analysis for CBF activation studies in human brain. J Cereb Blood Flow Metab 12: 900–918. [DOI] [PubMed] [Google Scholar]
- Yousry TA, Schmid UD, Alkadhi H, et al. (1997): Localization of the motor hand area to a knob on the precentral gyrus. Brain 120: 141–157. [DOI] [PubMed] [Google Scholar]
- Zilles K, Schaug G, Geyer S, Luppino G, Matelli M, Qu M, Schleicher A, Schormann T (1996): Anatomy and transmitter receptors of the supplementary motor areas in the human and nonhuman primate brain In: Lüders HO, editor. Advances in neurology, vol. 70 Supplementary sensorimotor area. Philadelphia: Lippincott‐Raven Publishers; p 29–43. [PubMed] [Google Scholar]