Abstract
Verifying task compliance during functional magnetic resonance imaging (fMRI) experiments is an essential component of experimental design. To date, studies of oculomotor tasks such as smooth pursuit eye movements have either measured task performance outside the magnet and assumed similar performance during functional neuroimaging, or have used MR‐compatible eye movement recording devices, which can be costly and technically difficult to use. We describe a simple method to visualize and quantify eye movements during an imaging experiment using the gradient echo images. We demonstrate that local eye movements will influence whole‐head motion correction procedures, resulting in inaccurate movement parameters and potentially lowering the sensitivity to detect activations. Hum. Brain Mapping 17:238–244, 2002. © 2002 Wiley‐Liss, Inc.
Keywords: smooth pursuit, compliance, registration, task‐correlated motion
INTRODUCTION
Smooth‐pursuit eye movements and other oculomotor tasks are frequently used to study mental illnesses such as schizophrenia [Holzman, 1985; Levy et al., 1993; Radant and Hommer, 1992; Ross et al., 1998], Alzheimer's disease [Fletcher and Sharpe, 1988; Jones et al., 1983; Kuskowski et al., 1989; Zaccara et al., 1992] and antisocial personality disorder [Costa and Bauer, 1998; Rosse et al., 1992]. As functional neuroimaging of eye movement abnormalities becomes more widespread, the problem of verifying task performance during image acquisition is highlighted.
Current techniques for recording eye movements during functional image acquisition include specially modified electrooculographic (EOG) methods [Felblinger et al., 1996] or short‐ or long‐range infrared oculography [Gitelman et al., 2000; Kimmig et al., 1999]. Although these methods potentially yield high spatial resolution information about eye movements, they are often costly and technically difficult to implement. Because of these limitations, most fMRI studies assess eye movement outside of the magnet and assume them to be similar during image acquisition, a situation that clearly is not optimal.
We describe a simple technique of visualizing movement of the eye and optic nerve in the echo planar images (EPI) acquired during functional magnetic resonance imaging (fMRI) of a smooth pursuit eye movement task to verify compliance. A method of quantifying this information is also described. Eye movements detected in functional images may introduce artifacts in the registration process, yielding inaccurate parameters describing task‐correlated whole‐head motion that could lower the registration quality. We examine the effects of local eye movement information on image registration and the subsequent brain activation map.
SUBJECTS AND METHODS
Subjects
Fifteen healthy volunteers (7 male, 8 female; mean age 31 ± 8.5 years) participated in our study. All subjects gave written, informed consent. The study was approved by the University of Colorado Health Sciences Center Internal Review Board.
Task design and experimental setup
Magnetic resonance images were obtained while subjects carried out a visual smooth pursuit task adapted from Radant and Hommer [1992]. Briefly, the task consisted of visually tracking a small white dot that moved horizontally back and forth over 26 degrees at a constant velocity of 16.7 degrees/sec followed by a 700 msec fixation period at the edges. Subjects were asked to “keep your eyes on the dot, wherever it goes.” The stimulus was presented in the magnet via an LCD back projection to a screen mounted inside the bore of the magnet at the head of the subject. The subject viewed the screen via an angled mirror above the head coil. For each of four runs in this blocked design, a 10‐sec equilibration period was followed by eight cycles of 25‐sec task/25‐sec rest. During “rest,” subjects were instructed to look straight ahead at the black screen.
fMRI parameters and data analysis
All MR images were collected on a 1.5 T MR system (Magnetom VISION; Siemens AG, Iselin, NJ), using a standard quadrature head coil. Functional images were acquired with a gradient‐echo T2* BOLD technique, with a 642 matrix (in‐plane resolution of 3.75 × 3.75) over at 240 mm2 FOV with TE = 50 msec and TR = 2,500 msec. Each functional volume consisted of 20 axial slices, 6 mm thick with a 1 mm gap, angled parallel to the planum sphenoidale.
Data was analyzed off‐line using SPM99 software (Wellcome Foundation, London, UK) and in‐house software written in IDL (Interactive Data Language; RSI, Boulder, CO). Spatial pre‐processing, model specification and estimation, and statistical inference were carried out with SPM99 [Friston et al., 1995b]. The first four image volumes from each run were excluded for saturation effects. The four runs from each subject were concatenated. Images were motion‐corrected, normalized to the Montreal Neurological Institute (MNI) template in Talairach space [Talairach and Tournoux, 1988], and smoothed with a 4 mm FWHM Gaussian kernel. After accounting for re‐slicing for motion correction, normalization to stereotactic space, and the applied smoothing kernel, the effective smoothing was approximately 8 × 8 × 8 mm3. The model consisted of a simple boxcar convolved with the hemodynamic response function. To identify brain regions activated consistently across subjects, a random effects model was implemented. Briefly, the parameter estimates from each individual's first level analysis (SPM contrast images) were entered into the second level analysis consisting of a one‐sample t‐test of the main effect of task. The second level model was set at a threshold of P < 0.05, corrected for multiple comparisons using the false‐discovery rate (FDR) method [Curran‐Everett, 2000; Genovese et al., 2002].
Qualitative eye movement analysis
Qualitative analyses of eye movements during the smooth pursuit task were carried out in each subject by viewing the time series of the axial slice that included the most information about eye movement. The movement was most obvious when the optic nerve was imaged, but this was not necessary to observe movement. The time series was viewed with an in‐house program written in IDL (RSI) or with spm_movie (Wellcome Foundation, London, UK).
Quantitative eye movement analysis
Eye movements were quantified using a local motion analysis routine written in IDL. Image registration generally focuses on the alignment of large structures, with localized motion of smaller objects, such as the eyes and optic nerve, remaining mostly uncorrected. To analyze this type of motion, a routine was written in IDL to quantify translation and rotation of objects on the order of 3 × 3 voxels in size. For a given volume, the routine takes every voxel and its surrounding 8 in‐plane voxels and compares them to the corresponding region in a baseline volume, minimizing the intensity differences through a combination of rigid body transformations (6 df). This technique was applied to all volumes in the time series, using the first volume as the baseline. To reduce computation time, the analysis was only carried out on a region of interest surrounding the eyes and optic nerve. The resulting translation and rotation parameters were used to generate a color map of displacement values, which was then overlaid on the EPI data. The color map allows easy identification of those regions experiencing substantial amounts of localized motion.
Assessing significance of difference in task‐related movement parameters after exclusion of eye movements
For each degree of freedom (3 rotational, 3 translational), realignment parameters before excluding eye movements were compared to parameters obtained after excluding eye movement information. Only movement parameters for periods in which the smooth pursuit stimulus was present were included in the analysis. Because the distribution of values was right‐skewed, a Wilcoxon rank sum test was carried out.
Assessing impact of eye movement on image registration and activation
Functional images were initially registered with SPM99. To examine the effect of local eye movement information on image registration, areas containing significant local movement assessed visually and with the local motion analysis routine were excluded from the registration procedure by setting intensities of voxels to zero in the first functional image of the data set. SPM99 registration of the data set (including the modified first image) was then repeated, yielding a new set of realigned images and plots of registration parameters in which eye movement information was not present. Activation maps were generated using the same procedure discussed above. The t‐values of local maxima were compared.
RESULTS
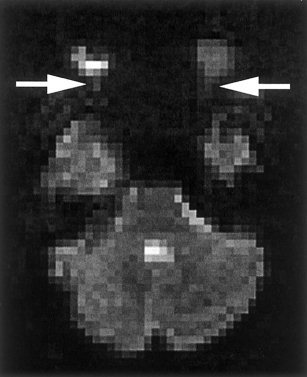
A time‐lapse series of 80 echo‐planar images representing one of four sessions from a subject can be viewed online (http://www.uchsc.edu/sm/psych/neuroimg/SPEMmovie.htm). A single image from this time series is shown in Figure 1. In this axial view, movement of the eye and the optic nerve can clearly be seen to occur in a periodic pattern that coincides with the presence and horizontal movement of the stimulus. Periods of no‐movement correspond to 25‐sec periods of a black screen, during which the subjects were instructed to “look straight ahead.” Periods of eye movement correspond to 25‐sec intervals in which the smooth pursuit target was traversing the screen as subjects were instructed to “follow the dot, wherever is goes.” This run consisted of 8 off/on blocks of no‐dot/dot, for a run time of 3.5 min.
Figure 1.

An axial slice from a time series of 80 echo‐planar images (online at http://www.uchsc.edu/sm/psych/neuroimg/SPEMmovie.htm). Arrows point to the attachment of the optic nerve to the eyes. The movement of the eyes and optic nerves occurs in a periodic pattern reflecting the presence and horizontal trajectory of the stimulus.
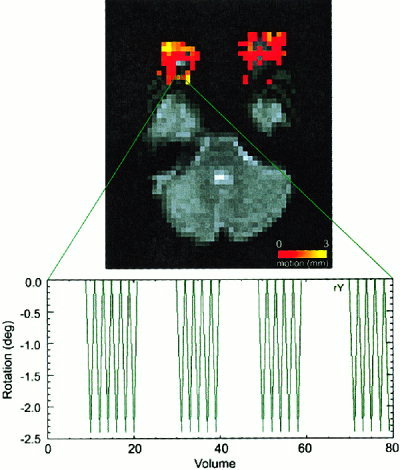
Figure 2 demonstrates a color movement map that has been overlaid onto the registered functional image. Movement parameters from a single voxel located on the edge of the eye is shown. Rotational movement of the optic nerve corresponds to the movement of the stimulus.
Figure 2.

Results of a local movement registration analysis. The color map corresponding to the amount (mm of average translation and rotation arc length) of local motion is overlaid on the echo‐planar image. Rotational (yaw) movement parameters from a single voxel near the optic nerve are plotted at bottom.
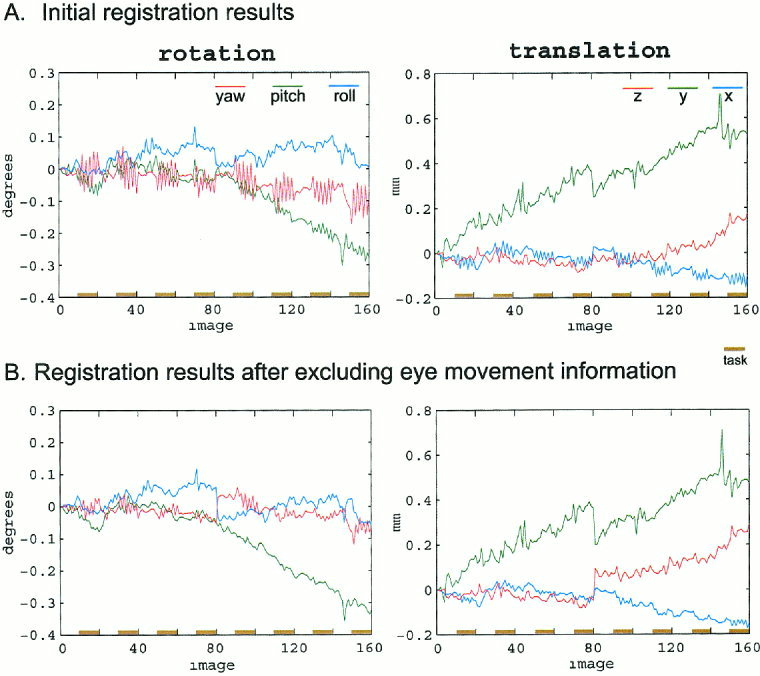
Figure 3 demonstrates the effect of eye movements on the image registration process. Figure 3A shows the initial registration parameters for the above subject. The obvious feature of these plots is the large amount of rotational movement (yaw, in red) corresponding to the movement of the stimulus. Task‐correlated translational movement in the x direction (x, in blue) is also observed. Figure 3B shows the results of motion correction after excluding localized motion of the eye and optic nerve. Note the substantial reduction in task‐related movement, particularly in yaw rotation (red) and x translation (blue). The magnitude of task‐related movement parameters for all six movement parameters were significantly (P < 0.01) reduced. This indicates that much of the motion detected in the original registration does not involve the whole head, but rather local eye movements. Additionally, a slight increase in the amplitude of several other non task‐related movement parameters, including y and z translation and roll rotation, is observed. This is especially noticeable in image 80, where two runs are concatenated. It is likely that this change reflects an increase in sensitivity of the registration process, and suggests a higher quality data set (see Discussion ).
Figure 3.

Effects of eye movements on image registration. A: SPM99 registration parameters for two concatenated runs totaling 160 images. Note the large amount of rotational movement (yaw, in red) corresponding to the movement of the stimulus. B: Registration parameters after excluding eye movement information. A reduction the amplitude of most movement parameters, particularly yaw, is observed.
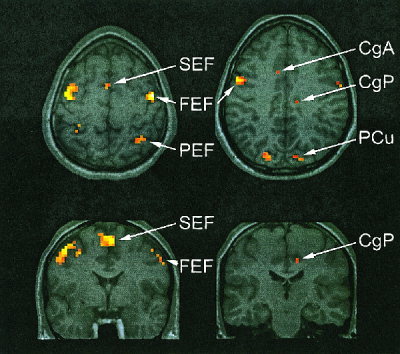
Figure 4 shows an axial slice showing brain activation associated with the smooth pursuit eye movement task. Activation can be seen in the frontal eye fields (FEF), supplementary eye fields (SEF) and parietal eye fields (PEF) and cingulate (CgA, CgP). These results are consistent with previous fMRI studies of smooth pursuit [Berman et al., 1999; Petit and Haxby, 1999]. Activation was also demonstrated in the occipital visual areas including V1 and V5, and thalamus, including the lateral geniculate nucleus (data reported elsewhere, not shown here.)
Figure 4.

Activation associated with smooth pursuit eye movements. Activation is demonstrated in the frontal (FEF), supplementary (SEF) and parietal eye fields (PEF), precuneus (PCu), and anterior (CgA) and posterior cingulate (CgP). Data are thresholded at P < 0.05, corrected for multiple comparisons.
Analysis of data excluding eye movement information revealed a SPM that was nearly identical to the original data, but with subtle differences in the level of significance of reported local maxima. Of the 42 local maxima with an FDR‐corrected P‐value <0.05, 29 had higher t‐values (mean increase 0.13, SD 0.12) and 13 had lower t‐values (mean decrease 0.14, SD 0.09) after excluding local motion.
DISCUSSION
We describe a novel method of verifying task compliance by subjects participating fMRI experiments involving eye movements. The most straightforward application of this technique involves locating an axial slice in an EPI functional data set that contains the eye, and, optimally, the optic nerve. Viewing this slice as a time series with a routine such as spm_movie (code available online in the SPM mailbase archives: go to http://jiscmail.ac.uk/lists/SPM.html, and select item 90 in the October 1999 list) is a practical method to gain qualitative information about eye movement during a functional experiment.
The convenience of this technique is highlighted by the fact that eye movement information can be obtained post hoc, with no special effort required during the imaging experiment. In our study, slices for all functional images were positioned to gain maximum brain coverage, with no attention given to placement of slices in regards to the optic nerves. Nevertheless, we observed the same periodic movement of the eyes in every subject. Data for some subjects (see the time series at http://www.uchsc.edu/sm/psych/neuroimg/SPEMmovie.htm) included both globes and a readily distinguishable portion of the optic nerve attachment. Data for some other subjects, however, did not include the optic nerve, but still contained an adequate portion of the eyes to allow a similar visualization of movement.
Even though this method can be applied easily to pre‐existing data sets acquired with no care taken to image the eye, higher quality data about eye movement can be more consistently obtained if the placement of the acquired images is considered before scanning. A slight adjustment in the location of the acquired slices to cover the exit of the optic nerve from the eye may yield more complete eye movement data in many cases. This is not always possible, however, as individual variation in the location and condition of the sinuses, which causes data loss due to susceptibility artifact, may preclude consistent, reliable visualization of this landmark.
Although in many cases a qualitative inspection of eye movement data as a time series may be adequate, our study demonstrates the effectiveness of using a local motion registration routine to quantify this data (Fig. 2) to gain a more precise understanding of eye movement during a task. This method may be particularly valuable when trying to study eye movements during a more complex task, in which it may be possible to quantify the relation of eye movements to task performance. This technique may be more useful at higher resolutions, as the relatively low resolution used in our study (64 × 64) frequently yielded noisy plots of local movement. This problem was solved by plotting the movement associated with voxels on the edge of high‐movement areas. This approach results in movement plots that lack complete directional information, but provides a clearer understanding of the temporal occurrence of movement.
In addition to more detailed information about task performance, eye movement information can be useful in assessing potential sources of artifact in fMRI data acquisition. For example, Chen and Zhu [1997] demonstrated that involuntary eye movements during resting conditions can cause signal fluctuations in the phase‐encoding direction during image acquisition using an EPI sequence. If such eye movements are detected using methods described herein, investigators may consider the effects of these artifacts on their data and means to minimize them such as the oblique slab presaturation technique described by Chen and Zhu [1997].
Movement of the eye and optic nerve may also be important in the functional image registration process and subsequent data analysis. Task‐correlated subject motion has been shown to increase false activations in functional data [Field et al., 2000; Hajnal et al., 1994]. Although appropriate image processing methods may reduce the effects of such motion [Bullmore et al., 1999], obvious task‐correlated motion that is readily detectable in the realignment process remains problematic. We have demonstrated, however, that very localized movement of the eye and optic nerve in studies involving significant eye movements falsely increases the amount of apparent task‐correlated whole‐head movement reported by standard image realignment routines such as the procedure implemented in SPM99 [Friston et al., 1995b]. When eye movement information is removed from consideration during realignment (Fig. 3B), the reported global task‐correlated head motion is significantly reduced, indicating that the acquired data set contains much less task‐correlated head motion than initially reported and is therefore of a higher quality than original realignment parameters suggest.
In addition to yielding a more accurate understanding of whole‐head motion during image acquisition, it is likely that excluding eye movements actually improves whole‐head registration. Because any local motion is simply averaged into a global registration routine, the presence of such motion may degrade the performance of a whole‐head registration routine. Removal of this information should produce a more accurate registration result. Our data support this (see Figure 3B). The slight increase in the amplitude of y and z translation and roll rotation suggests that image registration excluding eye movement is more sensitive. Moreover, the statistical parametric map calculated after excluding eye movement information results in an increase in statistical significance in three of every four local maxima. Although this effect is subtle (mean t‐value increase of 0.13), even such a small gain in apparent sensitivity can be valuable in neuroimaging study designs that sacrifice the sensitivity of fixed effects analyses for inferential power of mixed models [Friston et al., 1999].
In conclusion, our study outlines a straightforward method of visualizing and quantifying the movement of the eye and optic nerve during fMRI experiments. Although discussed here in the context of a smooth pursuit eye movement task, this method may be applicable to other experimental paradigms involving eye movements, especially with emergence of high field MR scanners and the capacity for higher spatial resolution. Although the temporal resolution of this technique does not allow a detailed evaluation of the performance of the task, i.e., determination of smooth pursuit accuracy or frequency of saccadic intrusion, it is adequate to make gross determinations of task performance, which is useful for verifying compliance. Eye movements may also cause whole‐head registration routines to report a falsely large amount of head movement, especially task‐correlated movement, when this movement is, in reality, largely restricted to the eyes. Removing eye movement information results in a more accurate representation of head movement and a higher quality registration, potentially improving sensitivity in subsequent data analysis.
REFERENCES
- Berman RA, Colby CL, Genovese CR, Voyvodic JT, Luna B, Thulborn KR, Sweeney JA (1999): Cortical networks subserving pursuit and saccadic eye movements in humans: an FMRI study. Hum Brain Mapp 8: 209–225. [DOI] [PMC free article] [PubMed] [Google Scholar]
- Bullmore ET, Brammer MJ, Rabe‐Hesketh S, Curtis VA, Morris RG, Williams SC, Sharma T, McGuire PK (1999): Methods for diagnosis and treatment of stimulus‐correlated motion in generic brain activation studies using fMRI. Hum Brain Mapp 7: 38–48. [DOI] [PMC free article] [PubMed] [Google Scholar]
- Chen W, Zhu XH (1997): Suppression of physiological eye movement artifacts in functional MRI using slab presaturation. Magn Reson Med 38: 546–550. [DOI] [PubMed] [Google Scholar]
- Costa L, Bauer LO (1998): Smooth pursuit eye movement dysfunction in substance‐dependent patients: mediating effects of antisocial personality disorder. Neuropsychobiology 37: 117–123. [DOI] [PubMed] [Google Scholar]
- Curran‐Everett D (2000): Multiple comparisons: philosophies and illustrations. Am J Physiol Reg Integr Comp Physiol 279: R1–R8. [DOI] [PubMed] [Google Scholar]
- Felblinger J, Muri RM, Ozdoba C, Schroth G, Hess CW, Boesch C (1996): Recordings of eye movements for stimulus control during fMRI by means of electro‐oculographic methods. Magn Reson Med 36: 410–414. [DOI] [PubMed] [Google Scholar]
- Field AS, Yen YF, Burdette JH, Elster AD (2000): False cerebral activation on BOLD functional MR images: study of low‐amplitude motion weakly correlated to stimulus. AJNR Am J Neuroradiol 21: 1388–1396. [PMC free article] [PubMed] [Google Scholar]
- Fletcher WA, Sharpe JA (1988): Smooth pursuit dysfunction in Alzheimer's disease. Neurology 38: 272–277. [DOI] [PubMed] [Google Scholar]
- Friston KJ, Ashburner J, Poline JB, Frith CD, Heather JD, Frackowiak RSJ (1995a): Spatial registration and normalization of images. Hum Brain Mapp 3: 165–189. [Google Scholar]
- Friston KJ, Holmes AP, Worsley KJ (1999): How many subjects constitute a study? Neuroimage 10: 1–5. [DOI] [PubMed] [Google Scholar]
- Friston KJ, Holmes AP, Worsley KJ, Poline JB, Frith CD, Frackowiak RS (1995b): Statistical parametric maps in functional imaging: a general linear approach. Hum Brain Mapp 2: 189–210. [Google Scholar]
- Genovese CR, Lazar NA, Nichols T (2002): Thresholding of statistical maps in functional neuroimaging using the false discovery rate. Neuroimage 15: 870–878. [DOI] [PubMed] [Google Scholar]
- Gitelman DR, Parrish TB, LaBar KS, Mesulam MM (2000): Real‐time monitoring of eye movements using infrared video‐oculography during functional magnetic resonance imaging of the frontal eye fields. Neuroimage 11: 58–65. [DOI] [PubMed] [Google Scholar]
- Hajnal JV, Myers R, Oatridge A, Schwieso JE, Young IR, Bydder GM (1994): Artifacts due to stimulus correlated motion in functional imaging of the brain. Magn Reson Med 31: 283–291. [DOI] [PubMed] [Google Scholar]
- Holzman PS (1985): Eye movement dysfunctions and psychosis. Int Rev Neurobiol 27: 179–205. [DOI] [PubMed] [Google Scholar]
- Jones A, Friedland RP, Koss B, Stark L, Thompkins‐Ober BA (1983): Saccadic intrusions in Alzheimer‐type dementia. J Neurol 229: 189–194. [DOI] [PubMed] [Google Scholar]
- Kimmig H, Greenlee MW, Huethe F, Mergner T (1999): MR‐eyetracker: a new method for eye movement recording in functional magnetic resonance imaging. Exp Brain Res 126: 443–449. [DOI] [PubMed] [Google Scholar]
- Kuskowski MA, Malone SM, Mortimer JA, Dysken MW (1989): Smooth pursuit eye movements in dementia of the Alzheimer type. Alzheimer Dis Assoc Disord 3: 157–171. [DOI] [PubMed] [Google Scholar]
- Levy DL, Holzman PS, Matthysse S, Mendell NR (1993): Eye tracking dysfunction and schizophrenia: a critical perspective. Schizophr Bull 19: 461–536. [DOI] [PubMed] [Google Scholar]
- Petit L, Haxby JV (1999): Functional anatomy of pursuit eye movements in humans as revealed by fMRI. J Neurophysiol 82: 463–471. [DOI] [PubMed] [Google Scholar]
- Radant AD, Hommer DW (1992): A quantitative analysis of saccades and smooth pursuit during visual pursuit tracking. A comparison of schizophrenics with normals and substance abusing controls. Schizophr Res 6: 225–235. [DOI] [PubMed] [Google Scholar]
- Ross RG, Olincy A, Harris JG, Radant A, Adler LE, Freedman R (1998): Anticipatory saccades during smooth pursuit eye movements and familial transmission of schizophrenia. Biol Psychiatry 44: 690–697. [DOI] [PubMed] [Google Scholar]
- Rosse RB, Risher‐Flowers D, Peace T, Deutsch SI (1992): Evidence of impaired smooth pursuit eye movement performance in crack cocaine users. Biol Psychiatry 31: 1238–1240. [DOI] [PubMed] [Google Scholar]
- Talairach J, Tournoux J (1988): Co‐planar stereotactic atlas of the human brain. New York: Thieme Medical Publishers. [Google Scholar]
- Zaccara G, Gangemi PF, Muscas GC, Paganini M, Pallanti S, Parigi A, Messori A, Arnetoli G (1992): Smooth‐pursuit eye movements: alterations in Alzheimer's disease. J Neurol Sci 112: 81–89. [DOI] [PubMed] [Google Scholar]


