

Abstract
We examined the effects of two doses of alcohol (EtOH) on functional magnetic resonance imaging (fMRI) activation during a visual perception task. The Motor‐Free Visual Perception Test–Revised (MVPT‐R) provides measures of overall visual perceptual processing ability. It incorporates different cognitive elements including visual discrimination, spatial relationships, and mental rotation. We used the MVPT‐R to study brain activation patterns in healthy controls (1) sober, and (2) at two doses of alcohol intoxication with event‐related fMRI. The fMRI data were analyzed using a general linear model approach based upon a model of the time course and a hemodynamic response estimate. Additionally, a correlation analysis was performed to examine dose‐dependent amplitude changes. With regard to alcohol‐free task‐related brain activation, we replicate our previous finding in which SPM group analysis revealed robust activation in visual and visual association areas, frontal eye field (FEF)/dorsolateral prefrontal cortex (DLPFC), and the supplemental motor area (SMA). Consistent with a previous study of EtOH and visual stimulation, EtOH resulted in a dose‐dependent decrease in activation amplitude over much of the visual perception network and in a decrease in the maximum contrast‐to‐noise ratio (in the lingual gyrus). Despite only modest behavior changes (in the expected direction), significant dose‐dependent activation increases were observed in insula, DLPFC, and precentral regions, whereas dose‐dependent activation decreases were observed in anterior and posterior cingulate, precuneus, and middle frontal areas. Some areas (FEF/DLPFC/SMA) became more diffusely activated (i.e., increased in spatial extent) at the higher dose. Alcohol, thus, appears to have both global and local effects upon the neural correlates of the MVPT‐R task, some of which are dose dependent. Hum. Brain Mapping 21:15–26, 2004. © 2003 Wiley‐Liss, Inc.
Keywords: fMRI, functional, brain, visual perception, alcohol
INTRODUCTION
Visual perception has been investigated in skills such as object recognition [Sugio et al., 1999], visual attention [Nakamura et al., 2000], and examination of the visual properties of letters [Raij, 1999]. The Motor‐Free Visual Perception Test–Revised (MVPT‐R) [Colarusso and Hammill, 1995] was designed to provide a reliable and valid measure of overall visual perceptual processing ability. It has been employed previously as a predictor of driving ability due to the following characteristics: (1) relevance to highway safety, (2) relation to on‐the‐road driving behavior or crashes, (3) capability of assessment on a driving simulator, and (4) sensitivity to ETOH effects [Kaszniak et al., 1991; Keyl et al., 1997; Sivak et al., 1981; Stokx and Gaillard, 1986]. As part of a larger study on simulated driving, we adopted the MVPT‐R to an event‐related fMRI paradigm. In that study, we demonstrated robust activation in 10 healthy participants in visual and visual association areas, as well as frontal eye field areas/dorsolateral prefrontal cortex (FEF/DLPFC) and the supplemental motor area (SMA) [Calhoun et al., 2001].
We investigated the effect that two doses of alcohol had upon the neural correlates of visual perception that we identified previously. This is the first functional magnetic resonance imaging (fMRI) study of the effects of alcohol on the MVPT‐R task and visual perception. There have been few studies addressing the effect of alcohol on brain activity, and to our knowledge, no cognitive imaging studies were conducted at two or more alcohol doses.
The behavioral effects of alcohol intoxication are well known. In contrast to other drugs of abuse, it is widely believed that multiple extra‐cellular signaling pathways are involved in the cognitive and behavioral effects of acute alcohol administration. Acute alcohol administration interferes with performance on neuropsychological tasks assessing a wide variety of cognitive processes, including immediate memory span [Jones, 1973; Parker et al., 1974; Tarter and Jones, 1971], short‐term memory [Rosen and Lee, 1976; Tarter et al., 1991], conceptual and abstracting processes, and motor speed and coordination [Tarter and Jones, 1971], which may relate to prefrontal cortex moderation of complex motor skills [Peterson et al., 1990]. Although some evidence suggests no alcohol‐induced differences on attention tests [Tarter and Jones, 1971], other findings indicate detrimental effects on attention allocation [Lamb and Robertson, 1987]. Learning and memory are also negatively affected by alcohol [Mungas et al., 1994; Ryback, 1971]. In addition, psychophysical [Wegner et al., 2001] and event‐related potential (ERP) measures [Ahveninen et al., 2000] are impaired by intoxication. An analysis of literature examining the P300 ERP response to alcohol challenge suggests slower information processing [Colrain et al., 1993; Krull et al., 1993]. Neuropsychological and neurological deficits in executive function, visuospatial performance, and functions of gait and balance are detectable in alcoholic men even after a month of sobriety [Sullivan et al., 2002b]. Functions most severely affected in alcoholic women involve visuospatial and verbal and nonverbal working memory processes as well as gait and balance [Sullivan et al., 2002b]. In general, these studies support a deleterious effect of alcohol on cognitive functioning.
Despite the results just mentioned, there is relatively little imaging evidence examining how exposure to alcohol might transiently modulate brain function. A PET study found dose‐dependent blood flow decreases in cerebellum and increases (mostly at the higher dose) in right temporal and prefrontal regions [Volkow et al., 1988]. Alcohol is known to have vasoactive properties, confounding fMRI studies relying upon phenomenological hemodynamic changes. Global changes (more specifically decreases) in fMRI signal changes are likely confounded by such changes. A previous fMRI study reported that alcohol resulted in a significant activation decrease in visual areas, with slightly more right‐sided decreases [Levin et al., 1998].
There has been some work examining differences in brain activation between chronic alcoholics and healthy controls [Pfefferbaum et al., 2001]. In general, it is reported that frontal activity is modified in chronic alcohol users. On a working memory task, after controlling for baseline vigilance response, Tapert et al. [ 2001] found decreases in the right superior and inferior parietal, right middle frontal, right postcentral, and left superior frontal cortex. Another fMRI study suggested a reorganization of brain function resulting from long‐term alcohol exposure and reported changes in working memory, decreases in Brodmann areas (BA) 9, 10, and 45, and increases in BA 47 [Pfefferbaum et al., 2001]. Neural correlates of alcohol craving have been reported in subcortical basal ganglia, amygdala, hippocampus [Schneider et al., 2001], prefrontal [George et al., 2001], and orbitofrontal regions [Wrase et al., 2002]. From the Wrase et al. study, it is not clear that brain regions showing changes due to chronic alcohol use are the same as regions that demonstrate transient functional changes in response to acute alcohol.
Given previous findings, we expected to find a global effect of alcohol resulting in signal decrease, but, in addition, we predicted local effects including possible increases due to increased effort in task performance. We hypothesized that frontal and cerebellar regions would exhibit the largest dose‐dependent decrease and that additional frontal regions would show a dose‐dependent increase. We also hypothesized that there would be a dose‐associated task performance decrease.
In this study, healthy right‐handed volunteers performed MVPT‐R tasks presented during an fMRI scan session in an event‐related manner [Friston et al., 1998] followed by a second fMRI scan session 15 min after ingesting a dose of alcohol measured to achieve a blood alcohol content (BAC) of 0.04 or 0.08%. For the MVPT‐R task, as we reported previously [Calhoun et al., 2001], participants were shown a test stimulus on a screen and were asked to identify from four choices the figure that contained the test stimulus within it (see Fig. 1). Following a choice response, a white asterisk was presented on a black background until the next set of stimuli, approximately 17 sec later. Event‐related analyses were performed with a model‐based approach utilizing a canonical hemodynamic response function.
Figure 1.
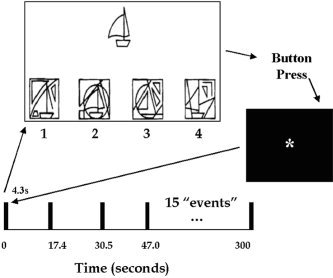
Timeline of the MVPT‐R fMRI paradigm. Figures were presented with an inter‐stimulus interval of approximately 17 sec. The participants were asked to indicate which of the four lower figures contained the upper figure by pressing 1, 2, 3, or 4, after which an asterisk was presented until the next figure appeared. The correct answer for this figure is 2.
SUBJECTS AND METHODS
Participants
Study participants were 10 screened healthy men (n = 7) and women, aged 24.2 ± 5.8 years. Participants were screened with a complete physical and neurological examination and the SCAN interview [Janca et al., 1994] to eliminate participants with Axis I psychiatric disorders or history of drug abuse. All participants had good visual acuity without correction, valid driver's licenses, good driving records assessed by self‐report, and were light (<3×/week) users of alcohol. Participants were requested not to eat high fat food the morning of (which would decrease alcohol absorption) or consume alcohol the day prior to the study. Each participant received either a placebo or a dose of beverage alcohol individualized to participant body weight age, sex, and race, calculated using a published algorithm [Kapur, 1989], and designed to produce a BAC of 0.04 or 0.08%. The alcohol beverage was administered orally as 190pf (95% v/v) ethanol diluted in fruit juice to a constant volume, consumed over 10 min. BAC's were determined immediately before and after the scan session, using a hand‐held breath meter. Participants began their test sessions 15 min post beverage. Each participant was run in two separate sessions, on two separate days, randomly, one at each alcohol blood level, always preceded by a run without alcohol. After drinking this beverage, most subjects felt moderately intoxicated. The principal investigator, a licensed physician, oversaw dosing and administration. Following completion of each scan session, participants were compensated for their time ($75 plus an addition $10 based upon their performance of a separate driving task). The Johns Hopkins Institutional Review Board approved the protocol and written informed consent was provided by all participants.
Experimental Paradigms
A timeline of the experimental paradigm along with an example figure is presented in Figure 1. Fifteen MVPT‐R figures (approximately half the test battery) were presented an average of 17 sec apart using the computer program E‐Prime (Psychology Software Tools, Pittsburgh, PA). A white asterisk on a black background was visible during the inter‐stimulus intervals. For each item, a central test stimulus was presented above four other figures (one target and three distracters). The visual perceptual processing involved in selecting the target can be categorized into (1) spatial relationships, (2) visual discrimination, (3) figure–ground, and (4) visual closure. The target is, in some cases, hidden, rotated, darkened, or resized and thus incorporates a number of visual perceptual elements.
The four figures were arranged below the test stimulus numbered 1 through 4, from left to right, as in the MVPT‐R test. The participants looked into a mirror to see a screen subtending approximately 25 degrees of visual field. The figures were back‐projected onto the screen and the participant indicated his/her item choice by pressing a fiber‐optically monitored button panel. Buttons 1 and 2 were controlled by the index and middle fingers of the right hand, respectively, and buttons 3 and 4 were controlled by the index and middle fingers of the left hand, respectively. The buttons were held with the number 1 closest to the head and the number 4 closest to the feet of the participants. All figures remained on the screen until a choice was made (average, 5–6 sec). We recorded reaction times as well as response accuracy for each item in all participants. Training included showing participants a sample figure from the test battery prior to the task. Scripted instructions were provided and were also displayed on the projection screen prior to beginning the task.
Imaging Parameters
Scans were acquired on a Philips NT 1.5 Tesla scanner at the Kennedy Krieger Institute in Baltimore, Maryland. A sagittal localizer scan was performed first, followed by a T1‐weighted anatomic scan (repeat time (TR) = 500 ms, echo time (TE) = 30ms, field of view = 24cm, matrix = 256 × 256, slice thickness = 5 mm, gap = 0.5 mm) consisting of 18 slices through the entire brain including most of the cerebellum. Next, we acquired axial oblique functional scans over the same 18 slices consisting of a single‐shot, echo‐planar scan (TR = 1 sec, TE = 39 msec, field of view = 24 cm, matrix = 64 × 64, slice thickness = 5 mm, gap = 0.5 mm) obtained consistently over a 5‐min period for a total of 300 scans. Ten “dummy” scans were performed at the beginning to allow for longitudinal equilibrium, after which the paradigm was automatically triggered to start by the scanner.
Data Analysis
Preprocessing
The images were first corrected for timing differences between the slices using windowed Fourier interpolation to minimize the dependence upon the reference slice chosen [Calhoun et al., 2000; van de Moortele et al., 1997]. Next, the data were imported into the Statistical Parametric Mapping software package, SPM99 [Worsley and Friston, 1995]. Data were motion corrected, spatially smoothed with a 6 × 6 × 10 mm Gaussian kernel, and spatially normalized into the standard space of Talairach and Tournoux [ 1988]. The data were slightly sub‐sampled to 3 × 3 × 5 mm, resulting in 53 × 63 × 28 voxels. For display, slices 4–28 were presented.
Statistical analysis
Data from each participant was entered into a general linear model “fixed‐effect” group analysis framework using SPM99. The statistical model, using the conventional SPM analysis, employed stimulus functions (consisting of the times when the figures were presented to the participants) convolved with the standard SPM99 canonical hemodynamic response function consisting of the sum of two gamma functions. Data were high‐pass (drift removal) filtered by entering sinusoidal functions into the model up to a frequency of 1/34 sec as covariates and low‐pass filtered by smoothing the data temporally with a 4‐sec Gaussian kernel. The resultant statistics were height corrected for multiple comparisons to P < 0.05 using a method derived from Gaussian random field theory [Friston et al., 1996]. Individual analyses were also performed to verify that the trends seen in this “fixed effect” group analysis were also seen in each individual data set. Additionally, a secondary “random effects” analysis was performed on the individual analyses with similar results to the fixed effects analysis, suggesting these results are somewhat representative of the population as a whole [Woods, 1996]. For the random effects analysis, because of low degrees of freedom, a more liberal corrected threshold of P < 0.05, which controls for the false discovery rate, was used [Genovese et al., 2002].
In order to examine dose‐dependent differences, we performed a second‐level (paired t‐test) analysis of the fixed‐effect contrasts between each EtOH dose and its baseline scan. That is, we compared the amplitude difference between the sober (S) and drug (D) conditions for the high (H) dose with the amplitude difference between the sober and intoxicated conditions for the low (L) dose, indicated as (ΔH+L [D‐S].We also performed a correlation analysis using the participants' own BAC levels, with similar results.
RESULTS
All participants performed well on the MVPT‐R task having an 85% average correct response (within 5% of the norm) as summarized in Table I. Incorrect and correct responses were treated as equivalent in the model because we were primarily interested in gross visual perceptual processing rather than differences in decision‐making. We explored the effect of alcohol (EtOH) at two blood alcohol content levels on MVPT‐R task performance. At the lower BAC (mean 0.041 ± 0.016), on a 5‐point analog scale (where 5 indicated maximal intoxication) participants indicated subjective intoxication of mean 1.0 ± 0.7 and at the higher BAC (mean 0.096 ± 0.040), participants self‐rated intoxication of mean 3.1 ± 0.8. The difference on the subjective intoxication scores was highly significant (P < e‐6).
Table I.
Individual accuracy rates and reaction times*
| Trial | Sober | Intoxicated | Change | ||||
|---|---|---|---|---|---|---|---|
| Percent correct | Median RT (sec) | Percent correct | Median RT (sec) | BAC | Δ Percent correct | Δ Median RT (sec) | |
| Low dose | 89 ± 5 | 4.35 ± 0.70 | 88 ± 6 | 3.63 ± 0.40 | 0.041 ± 0.016 | 1 ± 5 | 0.72 ± 0.45 |
| High dose | 89 ± 10 | 3.95 ± 0.26 | 93 ± 9 | 4.67 ± 0.52 | 0.096 ± 0.040 | −4 ± 7 | −0.72 ± 0.43 |
Average duration (in seconds) the participants took to determine the matching figure along with accuracy results for the two sober conditions, the low‐dose condition, and the high‐dose condition (±SD). Scores were within 5% of the norm for the MVPT‐R test. Participants receiving the low dose of alcohol tended (P < 0.07) towards slightly decreased reaction time whereas participants receiving the high dose of alcohol slightly (P < 0.08) increased in reaction time.
Within participants, median response times were calculated, and the group average of these values are also presented in Table I. Participants receiving the low dose of alcohol tended (P < 0.07) towards slightly decreased reaction time whereas participants receiving the high dose of alcohol slightly (P < 0.08) increased in reaction time. No significant differences in accuracy were found (P > 0.47; low dose; P > 0.11; high dose). With regard to alcohol‐free task‐related brain activation, SPM group analysis revealed robust activation in visual and visual association areas, FEF/DLPFC, and the supplemental motor area (SMA). EtOH resulted in a dose‐dependent decrease in activation amplitude over much (but not all) of the visual perception network including primary visual and visual association areas. This is evident upon visual inspection of Figure 2. Additionally, dose‐dependent increases were observed in bilateral insular regions.
Figure 2.
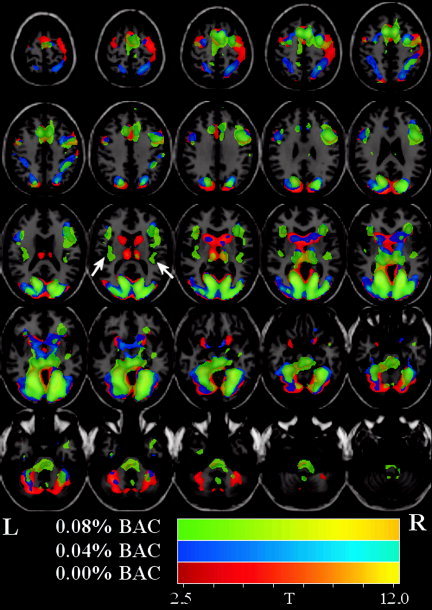
Main effect group maps for (mean) sober, low‐dose, and high‐dose conditions. T‐maps are displayed over the T1‐weighted template. Images were thresholded at P < 0.05 (corrected for multiple comparisons). All colored regions in the figure represent activations and are color‐coded to discriminate the alcohol dosing level. The main effect SPM group analysis for (1) (mean) sober (colored red/orange), (2) low‐dose (colored blue/cyan), and (3) high‐dose (colored green/yellow) are displayed on the same image for clarity. Alcohol dose results in a global decrease in contrast‐to‐noise and also that there are some localized increases and decreases.
The main effect SPM group analysis for (1) (mean) sober (colored red/orange), (2) low dose (colored blue/cyan), and (3) high dose (colored green/yellow) is displayed in Figure 2. Upon examination of estimated motion parameters, no participant was found to have moved more than 2 mm. Consistent with our previous study (on an independent sample of participants), the SPM analysis revealed activation in visual and visual association areas as well as FEF/DLPFC and the SMA. A summary of the detected regions is provided in Table II. At the highest dose, some regions (FEF/DLPFC/SMA) became more diffusely activated; i.e., at the given threshold the cluster size in each of these regions was greater.
Table II.
Summary of areas detected in the main effects analysis*
| Area | Brodmann | L/R volume (cc) | L/R fixed effects: Max T (x, y, z) |
|---|---|---|---|
| Sober (Max T = 13.64) | |||
| Lingual gyrus | 19,18,17 | 17.4/13.8 | 13.6(−21,−64,3)/13.0(21,−61,3) |
| Cuneus | 17,18,19,30,23,7 | 17.4/16.4 | 12.1(−12,−75,8)/11.4(15,−78,18) |
| Precuneus | 31,7,19 | 7.7/4.6 | 9.0(−15,−69,22)/9.9(24,−77,27) |
| Fusiform gyrus | 19,37,20,18 | 11.3/13.3 | 10.3(−21,−64,−5)/10.5(24,−64,−5) |
| Middle occipital gyrus | 18,19,37 | 10.2/12.8 | 9.9(−12,−93,14)/10.8(27,−82,0) |
| Parahippocampal gyrus | 19,30,36,18,37,27,35,34,28 | 12.3/6.7 | 11.4(−24,−58,−1)/9.2(24,−53,−6) |
| Posterior cingulate | 30,31 | 4.6/2.6 | 10.9(−15,−61,8)/10.6(18,−67,8) |
| Cingulate gyrus | 32,24,9 | 5.1/2.0 | 6.7(−6,17,41)/4.5(12,20,45) |
| Superior frontal gyrus | 8,6 | 3.1/3.1 | 8.2(−6,14,50)/7.8(6,9,55) |
| Middle frontal gyrus | 9,6,8,46 | 4.1/10.2 | 4.4(−48,2,41)/8.1(50,5,37) |
| Medial frontal gyrus | 6,8 | 3.1/2.6 | 6.9(0,0,60)/4.9(9,3,60) |
| Inferior frontal gyrus | 45,9,47,13,44,46 | 5.1/8.2 | 5.6(−48,5,32)/6.9(36,26,3) |
| Thalamus | 7.7/5.6 | 8.1(−6,−20,10)/6.8(12,−29,−3) | |
| Precentral gyrus | 6,9,4 | 2.0/7.2 | 5.2(−30,−9,56)/6.8(36,−6,56) |
| Inferior parietal lobule | 40 | 0.5/4.6 | 3.1(−33,−38,48)/5.3(42,−38,48) |
| Superior parietal lobule | 7 | 1.5/4.6 | 4.7(−21,−68,45)/5.2(24,−65,40) |
| Middle temporal gyrus | 19,39,37 | 3.1/2.0 | 4.9(−42,−80,22)/6.6(42,−78,18) |
| Low dose (Max T = 11.49) | |||
| Lingual gyrus | 18,19,17 | 12.8/11.3 | 10.6(−21,−70,3)/11.5(27,−76,0) |
| Cuneus | 18,23,17,19,30,7 | 13.8/13.3 | 9.2(−15,−72,13)/9.4(24,−83,27) |
| Precuneus | 7,31,19,18 | 6.1/7.2 | 7.2(−21,−71,40)/8.6(27,−68,36) |
| Fusiform gyrus | 37,19,20 | 9.2/12.3 | 7.7(−21,−59,−5)/10.4(36,−50,−10) |
| Middle occipital gyrus | 18,19,37 | 8.7/10.8 | 8.0(−27,−80,22)/11.0(27,−87,18) |
| Parahippocampal gyrus | 19,30,18,37,36,28,35,34,27 | 7.7/7.7 | 6.3(−15,−32,−3)/8.8(30,−56,−6) |
| Posterior cingulate | 30,31,18 | 3.6/2.0 | 7.6(−18,−66,17)/7.6(24,−61,8) |
| Cingulate gyrus | 32,24 | 2.6/1.5 | 5.4(−12,20,40)/7.4(12,17,45) |
| Superior frontal gyrus | 6,8 | 2.6/3.6 | 6.0(−3,11,50)/9.3(9,11,50) |
| Middle frontal gyrus | 6,9,46,10 | 4.1/9.7 | 5.5(−27,−3,51)/8.1(30,0,51) |
| Medial frontal gyrus | 32,6,8,9 | 1.5/3.6 | 7.8(−9,14,45)/5.7(9,3,55) |
| Inferior frontal gyrus | 9,45,47,44,46,13,11 | 6.1/7.7 | 5.7(−48,7,27)/7.8(45,10,27) |
| Thalamus | 4.1/4.1 | 5.6(−21,−29,1)/5.8(12,−26,−3) | |
| Precentral gyrus | 9,6 | 1.5/1.5 | 4.0(−45,5,37)/5.2(42,5,37) |
| Inferior parietal lobule | 40 | 2.0/6.1 | 4.6(−33,−38,48)/5.8(33,−44,48) |
| Superior parietal lobule | 7 | 2.6/4.1 | 4.1(−15,−55,63)/7.9(24,−68,45) |
| Middle temporal gyrus | 19,39,37 | 2.6/2.6 | 7.1(−39,−78,18)/6.2(42,−69,13) |
| R insula | 3.6 | 5.2(33,23,3) | |
| Postcentral gyrus | 5,7,2,1,3,40 | 1.5/3.6 | 2.9(−18,−49,67)/4.5(33,−44,57) |
| High dose (Max T = 7.56) | |||
| Lingual gyrus | 18,19,17,30 | 10.8/14.3 | 6.8(−21,−61,−1)/7.6(21,−73,−1) |
| Cuneus | 23,7,17,18,30,19 | 7.7/9.7 | 6.6(−12,−70,8)/6.2(15,−75,13) |
| Precuneus | 7,31,19 | 4.1/3.6 | 5.5(−21,−66,26)/5.0(18,−74,27) |
| Fusiform gyrus | 19,37,20 | 7.2/6.1 | 5.7(−27,−41,−11)/7.5(27,−56,−6) |
| Middle occipital gyrus | 18,19,37 | 3.6/8.7 | 3.7(−12,−90,14)/4.5(24,−90,14) |
| Parahippocampal gyrus | 19,30,36,37,27,35,28 | 8.2/5.6 | 6.1(−27,−50,−6)/6.2(24,−50,−2) |
| Posterior cingulate | 30,31 | 3.1/1.5 | 7.3(−18,−64,8)/5.9(21,−61,8) |
| Cingulate gyrus | 32,24 | 4.1/3.1 | 4.3(−9,19,36)/3.9(12,2,46) |
| Superior frontal gyrus | 6,8,9 | 1.5/2.6 | 4.1(−6,11,55)/3.0(9,9,59) |
| Middle frontal gyrus | 6,9,46 | 0.5/3.1 | 2.9(−42,19,22)/3.3(30,0,51) |
| Medial frontal gyrus | 6,32,8,9 | 3.1/5.6 | 5.3(−9,14,45)/5.6(9,8,50) |
| Inferior frontal gyrus | 9,44,13,47,45,46 | 2.6/10.8 | 3.7(−39,21,8)/4.7(50,4,27) |
| Thalamus | 3.1/5.1 | 5.9(−6,−29,1)/5.7(12,−29,1) | |
| Precentral gyrus | 6,9,4,44 | 2.0/6.1 | 3.2(−48,−1,41)/4.4(53,2,37) |
| Insula | 13 | 2.6/2.6 | 3.0(−33,−23,15)/3.0(42,−15,−3) |
A selection of areas detected by the analysis of main effect (determined by selecting a local statistical maximum within each region) along with their Talairach coordinates. Voxels above the threshold were converted to Talairach coordinates and entered into a database to provide anatomic and functional labels for the left (L) and right (R) hemispheres. The volume of activated voxels in each area is provided in cubic centimeters (cc). Within each area, the maximum t value and its coordinate are provided.
We observed both global and local hemodynamic effects of alcohol. There was a global dose‐related decrease in contrast‐to‐noise (CNR) evident both by visual inspection of Figure 2 and by examination of the maximum CNR (as measured by t‐value) in Table II (sober = 13.64, low dose = 11.49, high dose = 7.56) located in the lingual gyrus for all doses. In addition to the global effects, there were also localized increases and decreases. In particular, the contrast‐to‐noise in frontal regions increased (relative to sober) at the low dose and decreased (relative to sober) in the high dose (see Fig. 3).
Figure 3.
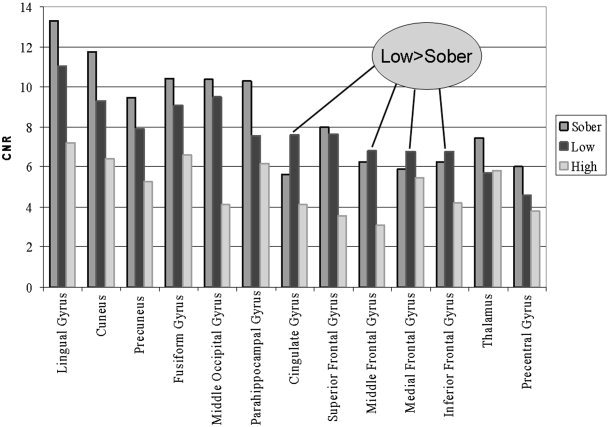
Graphic view of contrast‐to‐noise ratio (CNR) differences detected in the main effects analysis. Bar graph comparison of CNR‐by‐area in the (mean) sober, low‐dose, and high‐dose studies. Visual areas demonstrate a clear dose‐dependent decrease in CNR whereas frontal regions appear to be higher in the low‐dose condition and then lower in the high‐dose condition.
For the correlation analysis, a small, but detectable, effect was observed at a threshold of P < 0.05 (uncorrected) controlled for false positives with a contiguity filter of k = 50 voxels. The largest dose‐dependent decreases were observed in bilateral parietal visual areas such as precuneus and also in bilateral visual area MT (although this was not independently verified with visual cortical mapping). The largest cluster demonstrating a dose‐dependent increase was observed in the precentral gyrus. Corresponding images are presented in Figure 4 and tabulated in Table III.
Figure 4.
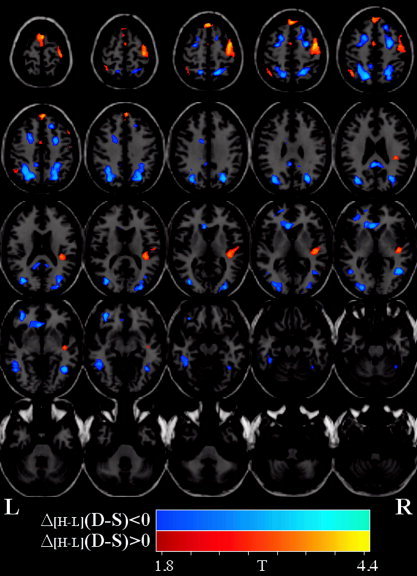
EtOH blood alcohol content correlation maps and plots. Comparison of the amplitude difference between the sober (S) and drug (D) conditions for the high (H) dose with the amplitude difference between the sober and intoxicated conditions for the low (L) dose, that is (ΔH+L [D‐S]). T‐maps are displayed over one of the normalized EPI images. Images were thresholded at P < 0.05 and a cluster size of 50 voxels. Dose‐dependent decreases are depicted in blue/cyan whereas dose‐dependent increases are depicted in red/orange.
Table III.
Summary of areas detected in the correlation analysis*
| Area | Brodmann | L/R volume (cc) | L/R random effects: Max T (x, y, z) |
|---|---|---|---|
| Positive (dose‐dependent decreases) | |||
| Precuneus | 7,19,39,31 | 3.6/3.6 | 4.0(−18,−59,49)/3.9(30,−65,31) |
| Superior parietal lobule | 7 | 1.6/2.0 | 3.6(−21,−62,45)/3.6(18,−52,58) |
| Middle frontal gyrus | 6,11,8,47,10 | 2.1/1.6 | 3.2(−39,46,−11)/3.5(27,−1,46) |
| Middle temporal gyrus | 39,37,19,22,20,21 | 1.6/1.3 | 3.4(−36,−69,26)/3.2(45,−55,3) |
| Middle occipital gyrus | 19,18,37 | 1.4/1.5 | 3.3(−33,−75,18)/2.6(30,−87,18) |
| Anterior cingulate | 24,32,10 | 1.5/0.2 | 3.2(−6,26,−1)/2.2(0,29,3) |
| Posterior cingulate | 23,30,29,31 | 0.5/0.4 | 3.2(−3,−42,25)/2.5(6,−40,25) |
| Inferior parietal lobule | 7,40,39 | 0.9/0.7 | 3.0(−30,−56,44)/2.5(33,−42,44) |
| (Lateral) superior frontal gyrus | 11,6,8,10 | 0.8/0.9 | 3.0(−36,46,−11)/2.6(21,31,44) |
| Posterior cingulate gyrus | 31,32,24 | 1.6/0.2 | 2.5(0,−42,25)/2.0(12,−45,25) |
| Medial frontal gyrus | 32,6,10,8 | 0.5/0.3 | 2.5(−21,11,41)/2.0(15,9,55) |
| Fusiform gyrus | 37,20 | 0.7/0.4 | 2.3(−42,−38,−11)/2.4(42,−56,−6) |
| Negative (dose‐dependent increases) | |||
| (Medial) superior frontal gyrus | 8,6,9 | 1.5/0.8 | 4.2(0,38,53)/4.4(3,38,53) |
| R precentral gyrus | 6,4,43 | 4.0 | 3.8(45,−3,51) |
| Medial frontal gyrus | 8,9,6,32 | 0.6/0.4 | 2.8(0,49,39)/3.2(3,49,39) |
| R superior temporal gyrus | 22,13,29,41 | 1.0 | 2.8(45,−17,1) |
| R insula | 13 | 1.5 | 2.8(39,−28,15) |
| L superior parietal lobule | 7 | 0.2 | 2.5(−42,−56,53) |
| Postcentral gyrus | 3,5,43,1 | 0.2/1.0 | 2.3(−36,−46,62)/2.4(45,−15,56) |
| L inferior parietal lobule | 40 | 0.9 | 2.3(−45,−53,49) |
| L cingulate gyrus | 24 | 0.2 | 2.3(−3,−1,46) |
A selection of areas detected by the correlation‐with‐dose analysis (determined by selecting a local statistical maximum within each region) along with their Talairach coordinates. Voxels above the threshold were converted to Talairach coordinates and entered into a database to provide anatomic and functional labels for the left (L) and right (R) hemispheres. The volume of activated voxels in each area is provided in cubic centimeters (cc). Within each area, the maximum t value and its coordinate are provided.
As each of the two drug conditions was compared to a baseline scan acquired on the same day, it was important to verify the consistency of results in these scans. To determine the consistency of results in the pre‐drug condition, an omnibus F‐test was performed on the two sober‐condition imaging sessions. At a threshold of P < 0.05 (uncorrected), there were only a few voxels that survived, and none of these were in areas that survived the threshold in other analyses, thus supporting the robustness of the results from the fMRI experiment.
We performed an analysis examining the differential effect that alcohol has on the seven male participants compared with the three female participants. Overall, the maps were quite similar (due possibly to our small sample size). Only a few areas were found to be differentially modulated by EtOH. At the high dose, males demonstrated a larger decrease in the right superior temporal gyrus [maximum at (51, −6, 5)]. At the low dose, females had a larger decrease in primary visual and visual association areas, suggesting that the low dose had a greater global effect on female than on male participants. Performance measures showed female performance less than male performance at baseline (median reaction time = 3.62 sec for males vs. 4.26 sec for females). Performance decreases were greater for females than males (change in reaction time was −0.16 sec and +0.59 sec for males and −0.78 sec and +1.36 for females in the low dose and high dose, respectively). Thus, both male and female participants showed a performance increase at the low dose and a performance decrease at the high dose. There was no difference in accuracy measures. Note than none of the male vs. female performance results were statistically significant due to the small number of female participants.
DISCUSSION
The MVPT‐R provides an overall measure of visuospatial processing ability. In our previous study, we demonstrated that the MVPT‐R activates a large network of regions involved in visual and spatial perception [Calhoun et al., 2001]. The goal of this study was to examine the modulatory effect that alcohol has upon the fMRI activation patterns associated with this task, as well as any behavior effects.
There have been few studies addressing the effect of alcohol on brain activity, and, to our knowledge, no fMRI studies have been conducted using two or more dose levels of alcohol. Alcohol is known to have vasoactive properties, and a previous fMRI study reported that alcohol resulted in a decrease in visual activation, with a slightly greater decrease on the right side [Levin et al., 1998]. We hypothesized there would be a global decrease in CNR. Such a decrease is evident both by visual inspection of Figure 2 and by examination of the maximum t‐value in Table II (sober = 13.64, low dose = 11.49, high dose = 7.56). In addition to the global effects, there were also localized increases and decreases.
We hypothesized that frontal and cerebellar regions would exhibit a dose‐dependent decrease [Sullivan et al., 2000]. Consistent with our hypothesis, bilateral negative correlations were observed in frontal regions just anterior and superior to the frontal eye fields. In particular, the CNR in frontal regions increased (relative to sober) at the low dose and decreased (relative to sober) at the high dose. From Figure 3, it can thus be seen that there is an inverted U relationship between dose and activation for prefrontal regions. This may indicate more active (but the same) frontal regions at the low dose of alcohol as participants attempt to perform the task during mild intoxication, whereas at the high dose, additional frontal regions are recruited and are activated less efficiently. Contrary to our hypothesis, we observed no dose‐dependent decreases in cerebellar activation. Occipital and parietal visual areas demonstrated the largest dose‐dependent decreases (but the relationship was linear in this case). Though most of the primary visual cortex did not meet our significance criterion, there was a dose‐dependent trend in many of these areas. This is evident upon visual inspection of Figure 2.
Additionally, regions demonstrated dose‐dependent decreases. We observed a dose‐dependent decrease in regions consistent with visual area MT (VMT). VMT additionally revealed robust activation for the main effect of the MVPT‐R task (see Fig. 2). It was recently shown that area MT, an area primarily responsive to motion, is also responsible for processing shape [Kourtzi et al., 2002], and hence may reflect the task performance.
Dose‐dependent increases were also observed. The largest dose‐dependent increases observed in medial prefrontal and precentral gyri were consistent with greater effort as the participant tried to overcome their impairment. Increases were also observed in the right insula, consistent with a PET study that found alcohol increases in right temporal and prefrontal regions [Volkow et al., 1988]. The same study also demonstrated decreased cerebellar metabolism. A dose‐dependent increase was observed in the right precentral gyrus. It has been shown that EtOH produces a psychomotor performance deficit in a dose‐dependent manner [Hiltunen, 1997].
We also hypothesized that there would be a dose‐related performance decrease. We found that low‐dose alcohol slightly (P < 0.07) decreased reaction time whereas high‐dose alcohol slightly (P < 0.08) increased reaction time. This is consistent with performance measures on a study of a simulated driving task in which low‐dose recipients indicated an awareness of their intoxication and made an attempt to compensate [McGinty et al., 2001]. In the current study, participant self‐reports at the lower dose of intoxication are consistent with an attempt to compensate at the lower dose. The high dose was associated with increased reaction time but unimpaired accuracy, consistent with a study showing impairments in speed and efficiency but not accuracy of timing on a variety of motor performance measures [Sullivan et al., 2002a]. While it might have been interesting to explore the relationship between task performance and brain activation, such an analysis would require more participants and a greater degree of performance variability.
We chose the MVPTR task in the context of a larger study on simulated driving. In a series of studies [Bylsma et al., 1992; Rebok et al., 1990, 1994] of Alzheimer's disease (AD), AD patients and normal elderly controls participated in an 18‐month longitudinal study of automobile driving skills to determine which cognitive function tests were clinically useful indicators of driving performance assessed on a driving simulator and state driving records. Tests associated with driving simulator performance for both AD and controls were scores on the Motor‐Free Visual Perception Test, Trails A; Logical Memory and Visual Reproduction tests; and mean choice reaction times. In a longitudinal extension of the study, decline in MVPT scores in the elderly drivers was associated with an increased rate of subsequent motor vehicle accidents.
It is informative to consider which component of visual perception might be most implicated in driving performance deficits. The most behaviorally relevant component of this visual perception task is the attentional aspect, but this is conjecture. The current study provides a map of the neural correlates involved in the MVPTR visual perception task as well as those involved regions that are modulated by alcohol. In our previous study of simulated driving in sober individuals, we extracted, in addition to visual and motor components, separate components that were (1) in attentional and error monitoring areas and (2) modulated by driving speed [Calhoun et al., 2002]. In addition, this prior MVPTR study revealed separate components for visual and parietal regions, presumably involved in attention and spatial processing [Calhoun et al., 2001]. In the future, we plan to explore directly the relationship between the driving and MVPTR tasks, and the impact of alcohol upon this relationship.
Limitations of the current study include the lack of additional types of imaging information (such as perfusion) in order to quantify the global effects of alcohol upon resting cerebral blood flow. Additionally, as we scanned both the sober and the drug condition in a single‐scan session, it was necessary to have the sober condition always precede the drug condition. We attempted to minimize the possibility of order effects by randomizing the order in which participants received the doses. A third scan session starting with the drug condition would have been useful in this regard. It is also possible that there may have been practice effects between the sober and the drug condition. However, we did not find significant differences between the two sober conditions, nor were there systematic changes in performance over time. A larger test battery would have been useful for detecting behavioral changes in the scanner. However, due to a desire to have novel stimuli during each session, and the limited number of MVPT‐R templates, it was not possible to increase the number of stimuli. While it is not likely cardiac and respiratory changes would induce specific localized dose‐related changes in relevant regions but not other regions, and since we did not collect physiologic information such as cardiac rate, respiratory rate, or eye movements, it is not possible to rule out whether these may have induced dose‐related changes.
The effects of EtOH are complicated and can differ depending upon whether one is on the ascending or descending limb of the BAC curve [Conrod et al., 1997]. It was for this reason we measured BAC before and after the scan session and attempted to scan participants as close to peak BAC as possible. However, more frequent measurement of BAC would have been useful. It would have also been useful to have a third, higher dose of EtOH, since a trend towards behavioral decrements was observed only at the high dose. We would expect, in this case, to see greater dose‐related decreases in frontal regions and increased amplitude changes in regions associated with the visual perception task.
Strengths of the current study include the measurement of fMRI activation at two doses of EtOH, thus enabling detection of dose‐dependent changes. Additionally, we were able to detect EtOH associated changes in both global and local fMRI activation during a visual perception task. Many of the areas detected were also detected in a previous study of simulated driving [Calhoun et al., 2002]. In the future, it would be useful to directly compare regional activation during the two tasks.
CONCLUSIONS
We examined the neural correlates of a driving related visual perception task under conditions of alcohol intoxication. We replicate our previous finding that the MVPT‐R test battery activates a large network of areas including primary visual, visual association, frontal, parietal, and cerebellar regions, similar to those activated in simulated driving [Calhoun et al., 2002]. Performance accuracy was consistent across all sessions; reaction time slightly decreased in the low‐dose condition and slightly increased in the high‐dose condition. Despite only modest behavior changes, albeit in the expected direction, significant dose‐dependent correlations were observed in insula, DLPFC, and precentral regions consistent with greater task effort whereas dose‐dependent decreases were observed in anterior and posterior cingulate, precuneus, and middle frontal areas. Some areas (FEF/DLPFC/SMA) became more diffusely activated (i.e., increased in spatial extent) at the highest dose. Alcohol, thus, appears to have both global and local effects upon the neural correlates of the MVPT‐R task, some of which are dose dependent.
Acknowledgements
The research was support by funding from the Johns Hopkins Outpatient General Clinical Research Center (NIH RR 00722), and a pilot grant from the FM Kirby Center for Functional Brain Imaging at Kennedy Krieger Institute in Baltimore Maryland to GP.
REFERENCES
- Ahveninen J, Jaaskelainen IP, Pekkonen E, Hallberg A, Hietanen M, Naatanen R, Sillanaukee P. (2000): Global field power of auditory n1 correlates with impaired verbal‐memory performance in human alcoholics. Neurosci Lett 285: 131–134. [DOI] [PubMed] [Google Scholar]
- Bylsma FW, Rebok GW, Gallo JJ. (1992): Cognitive and simulated driving performance in alzheimer's disease and normal aging. Clin Exp Neuro Psych 14: 17. [Google Scholar]
- Calhoun VD, Golay X, Pearlson GD. (2000): Improved FMRI slice timing correction: interpolation errors and wrap around effects. Denver, CO: Proc ISMRM. [Google Scholar]
- Calhoun VD, Adali T, McGinty V, Pekar JJ, Watson T, Pearlson GD. (2001): FMRI activation in a visual‐perception task: network of areas detected using the general linear model and independent components analysis. Neuroimage 14: 1080–1088. [DOI] [PubMed] [Google Scholar]
- Calhoun VD, Pekar JJ, McGinty VB, Adali T, Watson TD, Pearlson GD. (2002): Different activation dynamics in multiple neural systems during simulated driving. Hum Brain Mapping 16: 158–167. [DOI] [PMC free article] [PubMed] [Google Scholar]
- Colarusso RP, Hammill DD. (1995): Motor‐free visual perception test, revised. Novato, CA: Academic Therapy Publications. [Google Scholar]
- Colrain IM, Taylor J, McLean S, Buttery R, Wise G, Montgomery I. (1993): Dose dependent effects of alcohol on visual evoked potentials. Psychopharmacology (Berl) 112: 383–388. [DOI] [PubMed] [Google Scholar]
- Conrod PJ, Peterson JB, Pihl RO, Mankowski S. (1997): Biphasic effects of alcohol on heart rate are influenced by alcoholic family history and rate of alcohol ingestion. Alcohol Clin Exp Res 21: 140–149. [PubMed] [Google Scholar]
- Friston KJ, Holmes A, Poline JB, Price CJ, Frith CD. (1996): Detecting activations in PET and FMRI: levels of inference and power. Neuroimage 4: 223–235. [DOI] [PubMed] [Google Scholar]
- Friston KJ, Fletcher P, Josephs O, Holmes A, Rugg MD, Turner R. (1998): Event‐related FMRI: characterizing differential responses. Neuroimage 7: 30–40. [DOI] [PubMed] [Google Scholar]
- Genovese CR, Lazar NA, Nichols T. (2002): Thresholding of statistical maps in functional neuroimaging using the false discovery rate. Neuroimage 15: 870–878. [DOI] [PubMed] [Google Scholar]
- George MS, Anton RF, Bloomer C, Teneback C, Drobes DJ, Lorberbaum JP, Nahas Z, Vincent DJ. (2001): Activation of prefrontal cortex and anterior thalamus in alcoholic subjects on exposure to alcohol‐specific cues. Arch Gen Psychiatry 58: 345–352. [DOI] [PubMed] [Google Scholar]
- Hiltunen AJ. (1997): Acute alcohol tolerance in cognitive and psychomotor performance: influence of the alcohol dose and prior alcohol experience. Alcohol 14: 125–130. [DOI] [PubMed] [Google Scholar]
- Janca A, Ustun TB, Sartorius N. (1994): New versions of world health organization instruments for the assessment of mental disorders. Acta Psychiatr Scand 90: 73–83. [DOI] [PubMed] [Google Scholar]
- Jones BM. (1973): Memory impairment on the ascending and descending limbs of the blood alcohol curve. J Abnorm Psychol 82: 24–32. [DOI] [PubMed] [Google Scholar]
- Kapur BM. (1989): Computer Blood Alcohol Calculator V1.20 ARF Software. Toronto, Canada: Addiction Research Foundation. [Google Scholar]
- Kaszniak AW, Keyl PM, Albert MS. (1991): Dementia and the older driver. Hum Factors 33: 527–537. [DOI] [PubMed] [Google Scholar]
- Keyl PM, Rebok GW, Gallo JJ. (1997): Screening elderly drivers in general medical setting: toward the development of a valid and feasible assessment procedure. Washington, DC: AARP Andrus Foundation. [Google Scholar]
- Kourtzi Z, Bulthoff HH, Erb M, Grodd W. (2002): Object‐selective responses in the human motion area MT/MST. Nat Neurosci 5: 17–18. [DOI] [PubMed] [Google Scholar]
- Krull KR, Smith LT, Sinha R, Parsons OA. (1993): Simple reaction time event‐related potentials: effects of alcohol and sleep deprivation. Alcohol Clin Exp Res 17: 771–777. [DOI] [PubMed] [Google Scholar]
- Lamb MR, Robertson LC. (1987): Effect of acute alcohol on attention and the processing of hierarchical patterns. Alcohol Clin Exp Res 11: 243–248. [DOI] [PubMed] [Google Scholar]
- Levin JM, Ross MH, Mendelson JH, Kaufman MJ, Lange N, Maas LC, Mello NK, Cohen BM, Renshaw PF. (1998): Reduction in BOLD FMRI response to primary visual stimulation following alcohol ingestion. Psychiatry Res 82: 135–146. [DOI] [PubMed] [Google Scholar]
- McGinty VB, Shih RA, Garrett ES, Calhoun VD. (2001): Assessment of Intoxicated Driving With a Simulator: A validation study with on road driving. Proc Human Centered Trans Sim Conf.; Iowa City, IA.
- Mungas D, Ehlers CL, Wall TL. (1994): Effects of acute alcohol administration on verbal and spatial learning. Alcohol Alcohol 29: 163–169. [PubMed] [Google Scholar]
- Nakamura K, Honda M, Okada T, Hankawa T, Fukuyama H, Konishi J, Shibasaki H. (2000): Attentional modulation of parieto‐occipital cortical responses: implications for hemispatial neglect. J Neurol Sci 176: 136–143. [DOI] [PubMed] [Google Scholar]
- Parker ES, Alkana RL, Birnbaum IM, Hartley JT, Noble EP. (1974): Alcohol and the disruption of cognitive processes. Arch Gen Psychiatry 31: 824–828. [DOI] [PubMed] [Google Scholar]
- Peterson JB, Rothfleisch J, Zelazo PD, Pihl RO. (1990): Acute alcohol intoxication and cognitive functioning. J Stud Alcohol 51: 114–122. [DOI] [PubMed] [Google Scholar]
- Pfefferbaum A, Desmond JE, Galloway C, Menon V, Glover GH, Sullivan EV. (2001): Reorganization of frontal systems used by alcoholics for spatial working memory: an FMRI Study. Neuroimage 14: 7–20. [DOI] [PubMed] [Google Scholar]
- Raij T. 1999. Patterns of brain activity during visual imagery of letters. J Cogn Neurosci 11: 282–299. [DOI] [PubMed] [Google Scholar]
- Rebok GW, Bylsma FW, Keyl PM. 1990. The effects of Alzheimer's Disease on elderly drivers. Gerontonology 30: 194A. [Google Scholar]
- Rebok GW, Keyl PM, Bylsma FW, Blaustein MJ, Tune L. 1994. The effects of Alzheimer disease on driving‐related abilities. Alzheimer Dis Assoc Disord 8: 228–240. [DOI] [PubMed] [Google Scholar]
- Rosen LJ, Lee CL. 1976. Acute and chronic effects of alcohol use on organizational processes in memory. J Abnorm Psychol 85: 309–317. [DOI] [PubMed] [Google Scholar]
- Ryback RS. 1971. The continuum and specificity of the effects of alcohol on memory. A Review. Q J Stud Alcohol 32: 995–1016. [PubMed] [Google Scholar]
- Schneider F, Habel U, Wagner M, Franke P, Salloum JB, Shah NJ, Toni I, Sulzbach C, Honig K, Maier W, Gaebel W, Zilles K. 2001. Subcortical correlates of craving in recently abstinent alcoholic patients. Am J Psychiatry 158: 1075–1083. [DOI] [PubMed] [Google Scholar]
- Sivak M, Olson PL, Kewman DG, Won H, Henson DL. 1981. Driving and perceptual/cognitive skills: behavioral consequences of brain damage. Arch Phys Med Rehab 62: 476–483. [PubMed] [Google Scholar]
- Stokx LC, Gaillard AW. (1986): Task and driving performance of patients with a severe concussion of the brain. J Clin Exp Neuropsychol 8: 421–436. [DOI] [PubMed] [Google Scholar]
- Sugio T, Inui T, Matsuo K, Matsuzawa M, Glover GH, Nakai T. (1999): The role of the posterior parietal cortex in human object recognition: a functional magnetic resonance imaging study. Neurosci Lett 276: 45–48. [DOI] [PubMed] [Google Scholar]
- Sullivan EV, Rosenbloom MJ, Pfefferbaum A. (2000): Pattern of motor and cognitive deficits in detoxified alcoholic men. Alcohol Clin Exp Res 24: 611–621. [PubMed] [Google Scholar]
- Sullivan EV, Desmond JE, Lim KO, Pfefferbaum A. (2002a):. Speed and efficiency but not accuracy or timing deficits of limb movements in alcoholic men and women. Alcohol Clin Exp Res 26: 705–713. [PubMed] [Google Scholar]
- Sullivan EV, Fama R, Rosenbloom MJ, Pfefferbaum A. (2002b):. A profile of neuropsychological deficits in alcoholic women. Neuropsychology 16: 74–83. [DOI] [PubMed] [Google Scholar]
- Talairach J, Tournoux P. 1988. A co‐planar sterotaxic atlas of a human brain. Stuttgart: Thieme. [Google Scholar]
- Tapert SF, Brown GG, Kindermann SS, Cheung EH, Frank LR, Brown SA. (2001): FMRI measurement of brain dysfunction in alcohol‐dependent young women. Alcohol Clin Exp Res 25: 236–245. [PubMed] [Google Scholar]
- Tarter RE, Jones BM. (1971): Absence of intellectual deterioration in chronic alcoholics. J Clin Psychol 27: 453–455. [PubMed] [Google Scholar]
- Tarter RE, Arria AM, Van Thiel DH. (1991): Hepatic encephalopathy coexistent with alcoholism. Recent Dev Alcohol 9: 205–224. [PubMed] [Google Scholar]
- van de Moortele PF, Cerf B, Lobel E, Paradis AL, Faurion A, Le Bihan D. (1997): Latencies in FMRI time‐series: effect of slice acquisition order and perception. NMR Biomed 10: 230–236. [DOI] [PubMed] [Google Scholar]
- Volkow ND, Mullani N, Gould L, Adler SS, Guynn RW, Overall JE, Dewey S. (1988): Effects of acute alcohol intoxication on cerebral blood flow measured with PET. Psychiatry Res 24: 201–209. [DOI] [PubMed] [Google Scholar]
- Wegner AJ, Gunthner A, Fahle M. (2001): Visual performance and recovery in recently detoxified alcoholics. Alcohol Alcohol 36: 171–179. [DOI] [PubMed] [Google Scholar]
- Woods RP. (1996): Modeling for intergroup comparisons of imaging data. Neuroimage 4: S84–S94. [DOI] [PubMed] [Google Scholar]
- Worsley KJ, Friston KJ. (1995): Analysis of FMRI time‐series revisited—again. Neuroimage 2: 173–181. [DOI] [PubMed] [Google Scholar]
- Wrase J, Grusser S, Klein S, Diener C, Hermann D, Flor H, Mann K, Braus D, Heinz A. (2002): Development of alcohol‐associated cues and cue‐induced brain activation in alcoholics. Eur Psychiatry 17: 287. [DOI] [PubMed] [Google Scholar]