

Abstract
A Multi‐Start Spatio‐Temporal (MSST) multidipole localization algorithm was used to study sources on the anterior and posterior banks of the central sulcus localized from early somatosensory magnetoencephalography (MEG) responses. Electrical stimulation was applied to the right and left median nerves of 8 normal subjects. Two sources, one on the anterior and one on the posterior bank of the central sulcus, were localized from 16 data sets (8 subjects, 2 hemispheres). Compared with the more traditional practice of single‐dipole fits to peak latencies, MSST provided more reliable source locations. The temporal dynamics of the anterior and posterior central sulcus sources, obtained using MSST, showed considerable temporal overlap. In some cases, the two sources appeared synchronous. On the other hand, in the traditional single‐dipole peak‐latency fit approach, there is no time course other than a focal dipole moment activated only at the selected peak latency. The same group of subjects also performed a motor task involving index‐finger lifting; the anterior central sulcus source obtained from electrical median nerve stimulation localized to the same or similar region in the primary motor area identified from the finger‐lift task. The physiological significance of the anterior central sulcus source is discussed. The findings suggest that one can test the integrity of cortical tissue in the region of primary motor cortex using electrical somatosensory stimulation. Hum. Brain Mapping 11:59–76, 2000. © 2000 Wiley‐Liss, Inc.
Keywords: magnetoencephalography, MEG, somatosensory, motor, SI, MI, inverse problem, forward problem, spatio‐temporal modeling
INTRODUCTION
Evoked magnetic fields generated by median nerve stimulation can be measured by magnetoencephalography (MEG). For the early intervals of the MEG responses, a posterior central sulcus source (primary somatosensory cortex or SI), can be routinely localized [Wood et al., 1985; Hari et al., 1993; Forss et al., 1994; Kawamura et al., 1996; Mauguiere et al., 1997a, 1997b; Forss and Jousmaki, 1998; Jousmaki and Forss, 1998; Hari and Forss, 1999]. In addition, evidence of an anterior central sulcus source on the motor strip has also been reported using MEG [Kawamura et al., 1996]. However, some discrepancies exist concerning the exact locations of the two sources identified in the early portion of somatosensory MEG data. The majority of the data from Kawamura et al. [1996] suggest anterior and posterior central sulcus sources, but an MEG study by Forss et al. [1994] suggests that both sources are posterior to the central sulcus. In Kawamura et al.'s study, the posterior central sulcus sources were obtained by fitting the earliest major peak (around 20 ms poststimulus) of the evoked magnetic fields, generated by electrical median nerve stimulation, using a single‐dipole model. Similarly, the anterior central sulcus source was obtained by fitting the second major peak (around 30 ms poststimulus), again using a single‐dipole model. The same strategy was used to localize sources by Forss et al. [1994]. This traditional single‐dipole approach is meaningful only if one source is active at each selected latency. If more than one source is active, the simple single‐dipole model may not be adequate. In our study, we find that both the anterior and posterior central sulcus sources are active throughout the interval that contains the first and second major peaks. In this case, the strategy of using a single‐dipole fit to peak latencies may cause the sources to be inaccurately localized. Examples and detailed discussion of such mislocalization are presented.
We applied a newly developed spatio‐temporal, multiple dipole analysis technique, Multi‐Start Spatio‐Temporal (MSST) method [Huang et al., 1998; Aine et al., 2000] to localize the anterior and posterior central sulcus sources. The algorithm was applied to the entire interval (15–34 ms) containing the first (∼ 20 ms) and second (∼ 30 ms) major peaks of evoked magnetic responses following electrical median nerve stimulation, in order to obtain the temporal dynamics, as well as the locations, of the anterior and posterior central sulcus sources.
The posterior central sulcus source associated with primary somatosensory cortex (SI) has been well studied by MEG [Wood et al., 1985; Hari et al., 1993; Forss et al., 1994; Kawamura et al., 1996; Mauguiere et al., 1997a, 1997b; Forss and Jousmaki, 1998; Jousmaki and Forss, 1998; Hari and Forss, 1999]. However, the meaning and potential physiological significance of the anterior central sulcus source has not been addressed. Because the anterior central sulcus source appears to localize to a region of motor cortex, we compared its actual location to the location of a primary motor source that also localized to the anterior side of the central sulcus when subjects were engaged in an index‐finger lift task. Both sources localized to the same region (primary motor cortex). The physiological significance of this source is discussed.
METHODS
MEG Somatosensory Measurement
Eight subjects with no known neurological disorders and normal brain MRI were included in the study. Four were male and four were female with an age range of 25–46 (mean value 34.8). All subjects signed consent forms approved by the Human Subjects Committee of the VA Medical Center at Albuquerque. The median nerve was stimulated with a bipolar Grass constant current stimulator. Stimuli were brief 0.2 ms square waves. The intensity of the electrical stimuli (voltage) was adjusted until clear thumb twitches were observed. Stimulus presentation was randomized between right and left median nerves and presented at 2 Hz. A simultaneous trigger provided by the stimulator was sent to the MEG acquisition system for signal averaging. Evoked magnetic fields generated by this median nerve stimulation were measured using a Neuromag whole head MEG system [Ahonen et al., 1992] with 122 planar gradiometers in a magnetically shielded room (IMEDCO‐AG, Switzerland). The data were averaged across 300 individual responses with respect to the stimulus trigger to increase the signal to noise ratio (SNR). An interval of 400 ms poststimulus signal was recorded, with 100 ms prestimulus data for noise measurement. The baseline of the MEG data for each channel was adjusted by adjusting the mean value of the prestimulus data to zero. The sampling frequency of the data was 1,000 Hz, and the data were run through a band‐pass filter (0.1 Hz–300 Hz) and through a notch filter to remove the 60 Hz power‐line noise.
MEG Motor Task
In this task, the same group of subjects who participated in the somatosensory task were asked to place their hands on a table and were asked to lift their right/left index finger in a self‐paced manner (6 subjects) approximately every 2 sec, or following a visual cue (2 subjects). Interruption of a laser‐light beam by the finger lifting generated a trigger for stimulus averaging. Three hundred trials were averaged with respect to the onset of the finger movement. The prestimulus and poststimulus intervals of the recording were 1,000 ms and 500 ms, respectively. The interval of −250 ms to −50 ms was used to localize the primary motor source. The same sampling rate and filter setup that were used in the median nerve task were also adopted for this motor task.
Analysis of MEG Responses
To localize the neuronal activation using MEG, one must approximate the conductivity distribution of the head (head model). Using a human skull phantom [Leahy et al., 1998], we showed that, for the region at the central sulcus, a spherical model [Ilmoniemi et al., 1985; Sarvas, 1987] and a generally more accurate Boundary Element Method (BEM) [Meijs et al., 1987; Hämäläinen and Sarvas, 1989; Ferguson et al., 1994; Schlitt et al., 1995] yielded very similar results, due to the high spherical symmetry of the skull in this region. Therefore, in this study, the spherical MEG head model [Sarvas, 1987] was adopted. In this approach, a sphere is fitted to the inner surface of the skull overlying the central sulcus (obtained from the subject's MR images). In addition, certain approximations are necessary to describe brain neuronal activity (source model). In this study, an equivalent current dipole model was applied to approximate the underlying focal sources. The physiological validity of the dipole model for somatosensory responses has been well demonstrated by Okada et al. [1996] using animal studies. Localizing the dipoles is a highly nonlinear fitting process. Traditionally, the search algorithms required the user to provide initial guesses of the dipole locations when the number of modeled dipoles is greater than one. This procedure can be subjective and time consuming. In addition, it is difficult to localize sources that are not known in advance. In this study, using our newly developed automated MEG source localization algorithm, Multi‐Start Spatio‐Temporal (MSST) downhill simplex method [Huang et al., 1998], multiple source locations and their temporal dynamics can be obtained in an objective and effective fashion. This method performs the downhill simplex search [Nelder and Mead, 1965] a number of times with randomly selected initial guesses of the dipole locations within a user‐selected brain volume. In this study, the selected volume was a 9‐cm‐radius sphere approximating the brain. The number of the multiple starting locations increases with the number of modeled dipoles (see Huang et al. [1998] for details). If the number of modeled dipoles is two (as for most of the cases shown in this study), usually 300 multiple sets of starting locations are needed. When the program finishes the multiple searches, the 15 best‐fitting solutions are usually averaged to obtain the dipole locations. Unlike the traditional approaches, MSST does not require users to provide initial guesses for the dipole parameters, hence the fitting procedure is more objective and user friendly.
Before applying the MSST algorithm to localize sources, Singular Value Decomposition (SVD) [Golub and Van Loan, 1984] was used to obtain the number of signal‐related singular values (i.e., the number of asynchronous sources) [De Munck, 1990; Berg and Scherg, 1994; Huang et al., 1998] for a given interval of data. Then, a search across different numbers of dipole sources (also defined as “model order”) is performed to account for synchronous sources that may exist in the data and to obtain the appropriate model order. After the locations of the sources are obtained, the temporal dynamics (time course) of each dipole is calculated using a linear least‐squares fit [Scherg and Von Cramon, 1986; Achim et al., 1991; Mosher et al., 1992; Huang et al., 1998]. The locations of the sources provided by MEG were then superimposed on the 3D‐volumetric GRE T1‐weighted anatomical MR images of the subjects collected on a Picker‐Outlook 0.23T MR scanner. To coregister the MEG with MRI, three anatomical landmarks, namely, nasion, right, and left preauriculars, were measured for each subject using the Probe Position Identification system (Polhemus). Then, the same three points were identified from the subject's MR images, and a transformation matrix that involved rotation and translation between the MEG and MRI coordinate systems was generated.
To estimate the error in the dipole source localization in each individual subject, a Monte Carlo analysis [Medvick et al., 1989] was performed. In this approach, multiple copies of the “ideal” field measurements produced by the model are generated. Each of these ideal fields is then perturbed by a different set of simulated errors. These sets of simulated noise are randomly generated on a computer with distributions that mimic the noise in the measurement process. Then, direct searches (e.g., downhill simplex search [Nelder and Mead, 1965]) were performed to find the best‐fitting locations for each of the above data sets with different random noise added. In this study, an estimate of the noise based on the 100 ms prestimulus baseline was made and 100 trials of Monte‐Carlo analysis were performed. The uncertainty information associated with each dipole location was reflected in the size of the plotted locations covering all 100 trials. A paired t‐test was performed in x, y, and z directions to see if the anterior and posterior central sulcus sources were resolvable under the signal and noise conditions of the data. In addition to the within‐subject analyses, across‐subject analyses were also performed on the anterior and posterior central sulcus sources and their time courses. In particular, we calculated the distances of the posterior/anterior central sulcus sources relative to the posterior/anterior wall of the central sulcus.
For the purposes of comparison, we also fit the first (∼ 20 ms) and the second (∼ 30 ms) major peaks in the MEG waveforms using the traditional single dipole fit on all 16 cases from the 8 subjects. The corresponding distances of the single dipole fitted locations relative to the central sulcus were also calculated. Furthermore, the results of the single dipole fit were compared with those of the MSST.
RESULTS
Somatosensory Anterior and Posterior Central Sulcus Sources
Figure 1 plots the magnetic field waveforms and singular value decompositions for one subject's median nerve somatosensory responses. The waveforms from all 122 MEG channels are superimposed. The SVD was performed on the data matrix that contains 122 MEG channels with different time intervals. Figure 1a shows the MEG responses from each of 122 channels superimposed for the 15–26 ms poststimulus time interval. Figure 1b shows the singular value plot for the same interval. Clearly, two signal‐related singular values are present, indicating that two asynchronous sources are active during this interval. The small singular values (< 200) in this plot are noise related. A detailed description on how to separate signal‐related singular values from noise‐related singular values can be found elsewhere [De Munck, 1990; Chen et al., 1991; Mosher et al., 1992; Berg and Scherg, 1994; Huang et al., 1998]. Similarly, Figure 1c and d show the waveforms and singular value plots for the 26–34 ms interval poststimulus. Again, two signal‐related singular values are seen, which means that two asynchronous sources are active during this interval as well. When SVD is performed on the entire interval of 15–34 ms (waveforms shown on Fig. 1e, two signal‐related singular values are still evident (Fig. 1f). This result illustrates that the same two sources are active across the entire interval containing the first two major peaks of early somatosensory responses.
Figure 1.
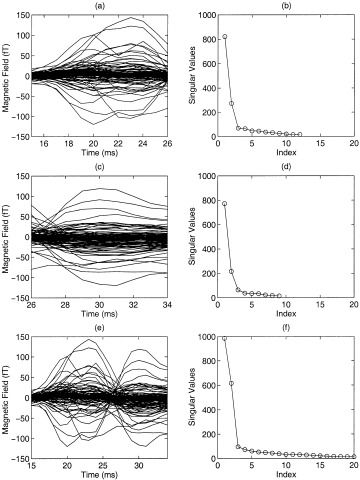
A case of asynchronous anterior and posterior central sulcus sources. MEG waveforms and singular value plots of a subject's somatosensory responses for three intervals. (a)(b): Waveforms and singular value plot for the 15–26 ms poststimulus interval; (c)(d) for the 26–34 ms poststimulus interval; (e)(f) for the entire 15–34 ms interval.
Figure 2 shows the locations and orientations of two sources localized using two different approaches to analyze the same data sets for this subject: (1) a two‐dipole Multi‐Start Spatio‐Temporal fit for the entire interval containing the major two peaks (15–34 ms); (2) a traditional single‐dipole fit for the two major peaks at successive latencies (21 ms and 29 ms, respectively). Left and right median nerve MEG responses were analyzed and the source locations were superimposed on the MR images of this subject. To obtain the uncertainty of the locations, 100 Monte‐Carlo analyses were performed on all the solutions from the two approaches. MSST clearly shows an anterior and a posterior central sulcus source for the left (Fig. 2a) and right (Fig. 2b) median nerve responses. The posterior central sulcus sources were on the posterior bank of the central sulcus (area 3b) and the anterior central sulcus sources were on the anterior bank of the central sulcus (area 4). The traditional single‐dipole peak‐latency fit for the right median nerve response (Fig. 2d) showed similar locations as MSST on the posterior bank of the central sulcus. However, the locations for the left median response, using the traditional method (Fig. 2c), were closer to the postcentral sulcus than the central sulcus (on the posterior bank of the gyrus).
Figure 2.
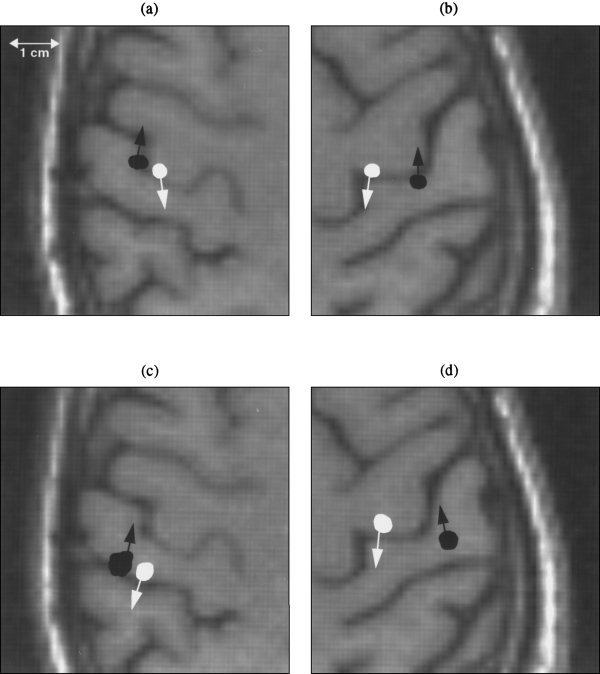
Locations and orientations of asynchronous anterior and posterior central sulcus sources localized by Multi‐Start Spatio‐Temporal (MSST) 2‐dipole fit and a traditional peak‐latency single‐dipole fit for median nerve MEG responses. One hundred Monte‐Carlo analyses were performed to obtain the uncertainty of the locations, reflected by the size of the plotted locations. Radiological convention is adopted in the figures; left and right hemispheres are displayed on the right and left portions of the page, respectively. (a) Anterior and posterior central sulcus sources obtained by MSST for the left median nerve stimulation, indicated by white and black color, respectively. (b) Anterior and posterior central sulcus sources obtained by MSST for right median nerve stimulation. (c) Two sources obtained by traditional single‐dipole fit using the first and second major peak‐latencies for left median nerve response, indicated by black and white colors, respectively. Note that the source locations were almost an entire sulcus posterior to the MSST solutions. (d) Anterior and posterior central sulcus sources obtained by single dipole fit using the early two major peak‐latencies for right median nerve response.
The appropriate model order in MSST is provided by Singular Value Decomposition only if the temporal dynamics of the sources are asynchronous. The majority of the responses (11 out of 16) in this study had asynchronous sources. However, in some cases (5 out of 16), the anterior and posterior central sulcus sources were nearly synchronous. In these cases, the SVD of the 15–34 ms interval only shows one signal‐related singular value (see example of another subject in Fig. 3a and b). For these data, a search across different numbers of modeled dipoles was performed to determine the appropriate model order. The result is shown in Figure 3d. In this figure, the error measurement function (reduced Chi‐square value) [Supek and Aine, 1993] is plotted as a function of the number of modeled dipoles. In general, before the number of modeled dipole(s) reaches the appropriate model order, an increase in model order by 1 will result in a marked decrease of the reduced Chi‐square value. However, after passing the appropriate model order, an increase in the model order will not generate a significant decrease of the reduced Chi‐square value. Computer simulations [Supek and Aine, 1993] have shown that if there are no errors in the source model and head model, and the only noise in the data is white noise, an increase in the number of modeled dipoles after the appropriate model order has been reached will not result in a decrease in the reduced Chi‐square value. However, when analyzing data from human subjects, the noise may not be completely white, and moreover, other errors always exist (i.e., head modeling error, source modeling error). So, there is usually a slight decrease of the reduced Chi‐square value after passing the appropriate model order as shown in Figure 3d, but the rate of change is smaller. In this example, the appropriate model order was 2, indicated by the dashed vertical line. The normalized time courses of the two sources obtained by MSST, which were nearly synchronous, are plotted in Figure 3c.
Figure 3.
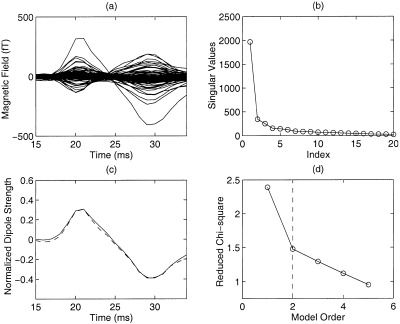
A case of synchronous anterior and posterior central sulcus sources. (a) Waveforms of the subject for the 15–34 ms interval; (b) SVD only shows one signal‐related singular value; (c) Synchronous time courses of the anterior (dashed line) and posterior (solid line) central sulcal sources obtained by MSST using a 2‐dipole model; (d) Reduced Chi‐square plotted as a function of modeled dipoles. The vertical dashed line indicates that the data is appropriately modeled by 2 dipoles.
The locations of these two dipoles were clearly located anterior and posterior to the central sulcus, for both the left and right median nerve responses using MSST (Fig. 4a and b). Again, to obtain the uncertainty of the locations, Monte‐Carlo analyses were performed. For comparison, the dipole locations obtained by the traditional single‐dipole peak latency fit are plotted on Figures 4c and 4d. The locations were posterior of the fits using MSST, and they became difficult to resolve visually, especially for the left median response (Fig. 4c).
Figure 4.
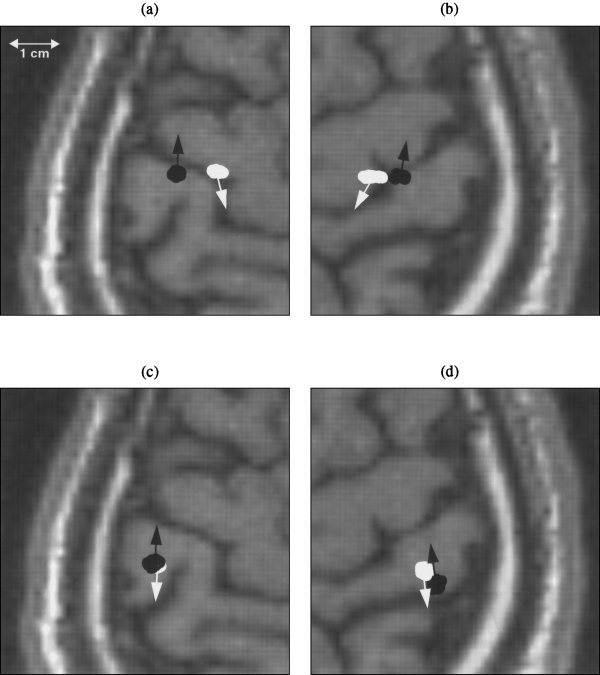
Locations and orientations of near synchronous anterior and posterior central sulcus sources localized by MSST and the traditional single dipole peak latency fit for one subject. (a) Anterior and posterior central sulcus sources obtained by MSST for the left median nerve response, indicated by white and black color, respectively. (b) Anterior and posterior central sulcus sources obtained by MSST for right median nerve response. (c) Two sources obtained by traditional single‐dipole fit using the first and second major peak‐latencies for left median nerve response, indicated by black and white colors, respectively. (d) Two sources obtained by single‐dipole fit using the first and second major peak‐latencies for right median nerve response.
Figure 5 shows the locations and orientations of the anterior and posterior central sulcus sources for 16 responses from 8 normal subjects. The spread of the locations is the result of the Monte‐Carlo analyses. Responses with high SNR showed smaller spread in the source locations than those with low SNR. In all subjects' right and left median nerve responses, the locations of the anterior and posterior central sulcus sources were clearly distinguishable (P < 0. 0001 using paired t‐test). In all cases (16 hemispheres), one source localized immediately anterior of the central sulcus, and the other localized immediately posterior of the central sulcus without any adjustment of the calculated locations. The majority (13 cases) showed that the anterior central sulcus sources were more medial than the posterior central sulcus sources. In three cases, the anterior central sulcus sources were lateral to the posterior central sulcus sources. In all cases, the anterior central sulcus sources were located slightly superior to the posterior central sulcus sources. The relative positions of the centers of the anterior central sulcus sources with respect to those of the posterior central sulcus sources were calculated. The overall mean distance between these two sources was 11.2 mm. This result is larger than what was calculated from Kawamura et al.'s [1996] published data (4.3 mm). In 15 out of the total 16 cases (93.75%), the posterior central sulcus sources were localized directly on the posterior bank of the central sulcus. In only one response (6.25%) the posterior central sulcus source appeared to be closer to the postcentral sulcus than the central sulcus (on the posterior bank of the gyrus, Fig. 5h, right plot). The mean distance and standard deviation (SD) of the posterior central sulcus sources relative to the posterior wall of the central sulcus were measured on the subjects' MRI and the results were 1.6 ± 1.4 mm. Furthermore, all anterior central sulcus sources were on the anterior bank of the central sulcus. The corresponding mean distance and SD of the anterior central sulcus sources relative to the anterior wall of the central sulcus were 1.5 ± 1.6 mm. In our experiment, we measured the mean distances of the posterior/anterior sources with respect to the nearest point of the posterior/anterior wall of the central sulcus. This nearest point on the wall may not be exactly along the direction of the dipole orientation (although most of them were close). Also, we performed the measurement with respect to the cortical wall, not the center of the CSF layer in the sulcus like some of the researchers did. The results using MSST are summarized in Table I. The mean angle and SD between the dipole orientations of anterior central sulcus sources relative to that of the posterior central ones were 171.8 ± 9.6. This indicates that these two sources pointed in nearly opposite directions.
Figure 5.
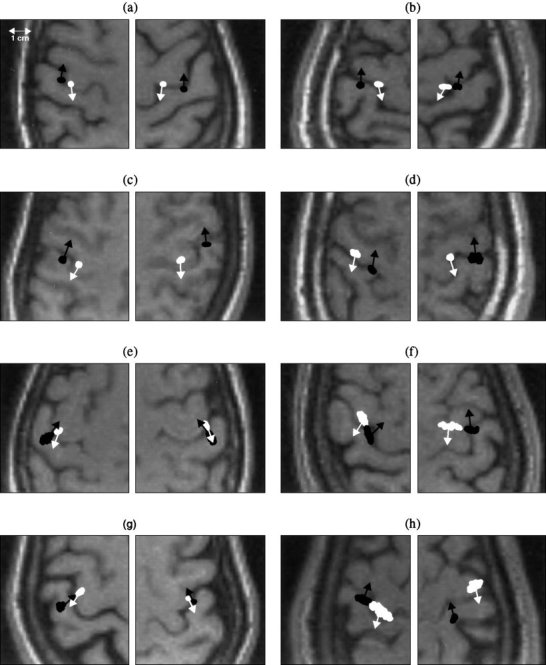
Anterior and posterior central sulcus sources and their orientations localized by MSST for the left and right median nerve responses of 8 normal subjects. The anterior central sulcus sources are indicated by white color and posterior central sulcus sources by black color. One hundred Monte‐Carlo analyses were conducted for all the sources to obtain the uncertainty of the source locations.
Table I.
Peak latencies of the anterior and posterior central sulcus sources using MSST (ms)
| The 20 ms peaka | The 25 ms peakb | The 30 ms peak | |
|---|---|---|---|
| Anterior central sulcus source | 20.7 ± 1.9 | 24.3 ± 1.4 | 30.1 ± 1.3 |
| Posterior central sulcus source | 20.0 ± 1.5 | 24.1 ± 1.3 | 29.8 ± 1.8 |
The difference between the anterior and posterior central sulcus sources is significant for the 20 ms peak (P < 0.05, paired t‐test).
The 25 ms peak was calculated using the sources with identified 25 ms peak.
For comparison, we also performed single dipole fits for the 20 ms and 30 ms peak latencies. The results for the 20 ms peak showed a single dipole localized to the postcentral gyrus in 14 out of 16 responses (87.5%) from the 8 subjects, while the remaining 2 cases (12.5%) showed locations in the anterior side of the central sulcus. Among the 14 cases in which posterior central locations were obtained, 10 cases (62.5% of the total) were directly on the posterior bank of the central sulcus (or anterior bank of the postcentral gyrus). However, in the remaining 4 cases (examples shown in Figs. 3 and 5), the dipoles were closer to the anterior bank of the postcentral sulcus (or the posterior bank of the postcentral gyrus) than the posterior bank of the central sulcus. The mean value and STD of the 20 ms single‐dipole fitted locations relative to the posterior wall of the central sulcus were 3.6 ± 2.9 mm. Furthermore, the results for the 30 ms peak showed that in 9 out of 16 cases (56.25%), the single dipole fitted locations were localized directly on the anterior bank of the central sulcus. The remaining 7 cases (43.75%) showed locations in the posterior side of the central sulcus. The mean distance and SD of the 30 ms single‐dipole fitted locations, relative to the anterior wall of the central sulcus, were 3.0 ± 2.7 mm. The single dipole fit results are also listed in Table I.
Figure 6 shows the normalized time courses of the anterior (dashed line) and posterior (solid line) central sulcus sources. The overall strength ratio of posterior versus anterior central sulcus sources is also provided in the upper‐right corner of each plot. This ratio shows that posterior central sulcus sources were stronger (in some cases, substantially stronger) than the anterior central ones. In all 16 cases, both the anterior and posterior central sulcus sources showed two peaks of opposite polarities, the first around 20 ms and the second around 30 ms. In several cases, a peak at about 25 ms was also visible. For most cases (11 of 16), activity of the posterior central sulcus sources preceded the anterior central sulcus sources slightly. For the remaining 5 cases (indicated by asterisks), the anterior and posterior central sulcus sources were essentially synchronous. The mean values and standard deviations of the 20 ms and 30 ms peaks of the time courses are listed in Table II. In addition, the mean value and standard deviation of the 25 ms peak is listed for those cases where this peak was visible. Paired t‐tests show that the posterior central sulcus sources are significantly earlier (P < 0.05) than the anterior central sulcus sources for the 20 ms peak.
Figure 6.
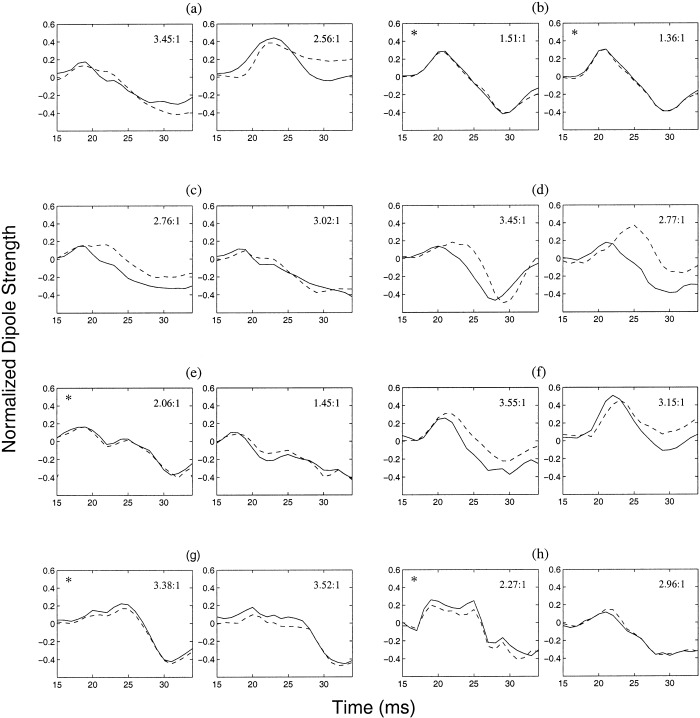
Temporal dynamics of the anterior (dashed line) and posterior (solid lines) central sulcus sources obtained by using MSST on the left and right median nerve responses of eight normal subjects. For most of the 16 data sets (11), the posterior central sulcus sources preceded the anterior ones, but this temporal ordering was not evident in the remaining 5 cases (indicated by asterisks). All the responses show two peaks at about 20 ms and 30 ms with different polarities. The majority of them (except for the right and left responses for subjects (b)(d)(f) and the right response for subject (a)) also show a peak at about 25 ms with the same polarity as that of the 20 ms peak. The ratio of the time courses for the posterior central source vs. the anterior central source is shown in the upper‐right corner of each plot.
Table II.
Comparing locations of the posterior and anterior central sulcus sources obtained by MSST and by single dipole fit in 16 cases
| Posterior central sulcus source | Locations directly on the posterior bank of the central sulcus | Distance to the posterior wall of the central sulcus (mm) |
|---|---|---|
| MSST fit the 15–34 ms interval | 15/16 (93.75%) | 1.6 ± 1.4 |
| Single dipole fit to the 20 ms peak | 10/16 (62.5%) | 3.6 ± 2.9 |
| Anterior central sulcus source | Locations directly on the anterior bank of the central sulcus | Distance to the anterior wall of the central sulcus (mm) |
|---|---|---|
| MSST fit the 15–34 ms interval | 16/16 (100%) | 1.5 ± 1.6 |
| Single dipole fit to the 30 ms peak | 9/16 (56.25%) | 3.0 ± 2.7 |
Primary Motor Sources from Normal Subjects
For the index‐finger lift motor task, conducted on the same group of 8 normal subjects, the primary motor region was localized by applying MSST to the −250 ms to −50 ms interval before the onset of the movement. Again, 100 trial Monte‐Carlo analyses were conducted to obtain the uncertainty of the dipole locations. The primary motor regions for the 16 hemispheres of the same 8 subjects are shown in Figure 7. When comparing these responses with the locations of the anterior central sulcus sources from median nerve somatosensory responses (Fig. 5), we found that these two sets of sources are either in the same regions or, in some cases, the primary motor sources are slightly more medial than the anterior central sulcus sources evoked by median nerve stimulation. The relative locations of the primary motor sources associated with index finger movement and the anterior central sulcus source from electrical median nerve stimulation were calculated; the histogram plots are shown in Figure 8. Near‐Gaussian distributions were obtained in all three orientations (i.e., anterior‐posterior, medial‐lateral, and superior‐inferior). The mean values and standard deviations of the relative locations are listed in Table III. The difference is not statistically significant (P > 0.1, paired t‐test) in either the anterior‐posterior direction or the superior‐inferior direction, indicating that there is no significant difference in locations between the primary motor sources from index‐finger lift and the anterior central sulcus source from somatosensory stimulation in these two directions. The P‐value for the medial‐lateral direction, however, is 0.048, just below the 0.05 threshold, indicating that the primary motor sources from the index‐finger lift are slightly more medial than the anterior central sulcus sources from median nerve stimulation. In addition, we calculated the locations of the primary motor sources relative to the anterior bank of the central sulcus and the results were 2.7 ± 2.2 mm. The mean angle and SD, between the dipole orientations of the primary motor sources in this index finger lifting task and those of the anterior central sulcus sources from median responses, were also calculated and the results were 5.4 ± 13.8°.
Figure 7.
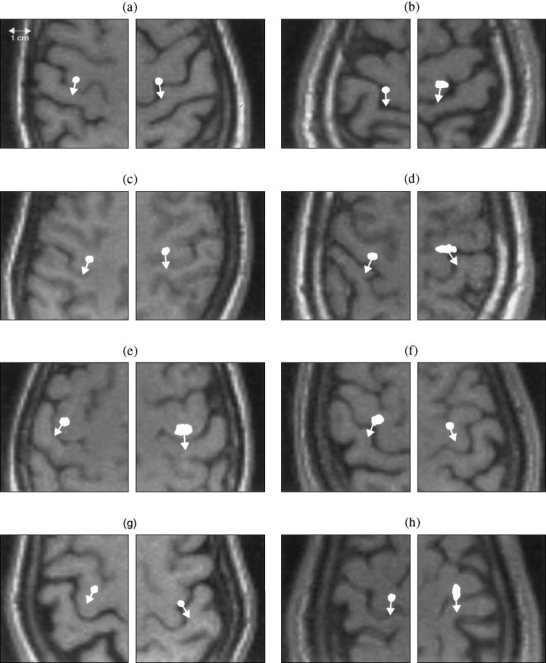
Primary motor sources and their orientations localized by MSST for the left and right index finger‐lifting responses of eight normal subjects. Again, 100 trial Monte‐Carlo analyses were conducted to obtain the uncertainty of the source locations. A comparison of these sources with the anterior central sulcus sources from median nerve responses (Fig. 5) reveal that either they are in the same regions, or the primary motor sources evoked by index‐finger lifts are slightly more medial.
Figure 8.
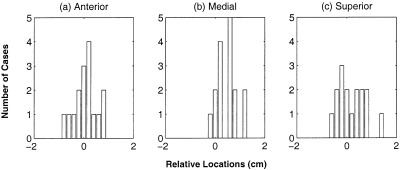
Histogram plots of the relative locations of the primary motor sources from index‐finger lift task to the anterior central sulcus sources from median nerve responses. The sources were localized by MSST for eight normal subjects.
Table III.
Relative positions of the primary motor source from index finger‐lift to the anterior central sulcus source from electrical median nerve stimulation (mm)
| Anterior | Mediala | Superior |
|---|---|---|
| 0.8 ± 4.7 | 4.6 ± 3.9 | 2.2 ± 5.4 |
The difference between the primary motor sources by finger lifting and the anterior central sulcus sources by median nerve stimulation is significant only for the medial‐lateral direction (P < 0.05, paired t‐test).
To illustrate the potential effect of mislocalization due to undermodeling using a single dipole model, we performed a simple computer simulation. In Figure 9a, 2‐dipole configuration is shown with the dipole moments of 20 and 10 nA‐m for the stronger and weaker dipoles, respectively. This dipole configuration was selected as being representative of the early somatosensory responses seen in our group of subjects. A best‐fitting single dipole solution is shown in Figure 9b. The distance of this single dipole location relative to the stronger dipole in Figure 9a was 7.6 mm. Such a mislocalization could easily place the dipole on the wrong side of the sulcus or gyrus. Figure 9c and 9d show similar magnetic field distributions from the original 2‐dipole and the fitted 1‐dipole configurations, respectively.
Figure 9.
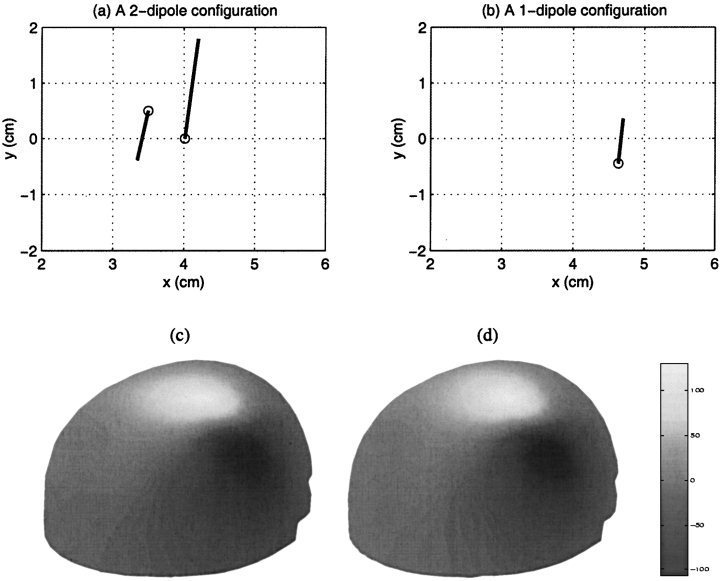
Fitting magnetic fields generated by two dipoles when fitted with a single dipole can cause observable mislocation. (a) The original 2‐dipole configuration; (b) A single dipole fit. The distance between this single dipole‐fitted location and the stronger dipole in (a) is 7.6 mm; (c) The magnetic field pattern generated by the 2‐dipole configuration; (d) Field pattern by the single dipole fit.
DISCUSSION
Reliability of MSST to the Posterior and Anterior Central Sulcus Sources
With the Multi‐Start Spatio‐Temporal multidipole localization technique, closely apposed anterior and posterior central sulcus sources were localized for all 16 median nerve responses studied. In general, this result agrees with the results of Kawamura et al. [1996]. However, a detailed comparison below reveals some obvious improvements in reliability using the MSST approach versus the single dipole‐fitting approach. First, in the MSST results, all posterior central sulcus sources were localized to the postcentral gyrus (100%) while the results of Kawamura et al. [1996, see Fig. 3 in their paper] showed a considerable number of locations (about 30%) on the anterior side of the central sulcus with the remaining 70% on the posterior side, when a single dipole model was used to fit the 20 ms peak. Furthermore, in 15 out of our total 16 cases (93.75%), the posterior central sulcus sources were directly on the posterior bank of the central sulcus. The exact percentage of locations directly on the posterior bank of the central sulcus was not provided by Kawamura et al. [1996]. However, from Figure 3 of their paper, we estimated that it was about 64%; that was markedly less than that of MSST. In our approach, using a single dipole fit to the 20 ms peak, 87.5% of the sources localized to the postcentral gyrus and 62.5% cases localized to the posterior bank of the central sulcus. The above ratios from our own single dipole fits were comparable to those from Kawamura and colleagues' data but were markedly less than the MSST results.
Second, we also compared the mean distance and SD of the posterior central sulcus sources relative to the posterior wall of the central sulcus using MSST. Our result (1.6 ± 1.4 mm) appears to be larger than the result from Kawamura and his colleagues (0.5 ± 3.5 mm) using a single‐dipole fit to the 20 ms peak. However, a second look at their result (Fig. 3 in Kawamura et al., [1996]) revealed that their small mean value may be the result of their different way of calculating this number. Figure 3 of their paper indicates that they may assign different signs to the distance values for those on the anterior side of the central sulcus versus those on the posterior side (e.g., negative sign for anterior central locations and positive sign for the posterior central locations). It appears that their relative small mean localization error is due to the cancellation between the errors of their considerable number of anterior central sulcus locations and those of the posterior central sulcus locations. We tried to recalculate the mean distance using the unsigned average (rather than the signed average) from the data published by Kawamura et al. [1996]. The mean value we derived was about 2.5–3.0 mm in their case. This number is comparable to the unsigned average that we achieved using a single‐dipole fit to the 20 ms (3.6 ± 2.9) and previous MEG results (about 4 mm) by Sutherling et al. [1988] using a similar approach. However, all of these values were larger than the result we obtained by using MSST (1.6 ± 1.4 mm).
In addition, with MSST, all the locations of the anterior sources (mean 1.5 ± 1.6 mm) were on the anterior bank of the central sulcus (100%). We were unable to obtain the corresponding values from the paper by Kawamura et al. [1996]. In our own single‐dipole fits to the 30 ms peak, 56.25% of the sources localized to the anterior bank of the central sulcus and 43.75% localized to the posterior side of the sulcus. Again, marked improvement in reliability was shown with MSST.
Furthermore, we studied previously published results by Sutherling and colleagues [1988] who attempted to examine the validity of MEG single dipole fits by comparing these results with ECoG results. They showed results in two cases where both MEG and ECoG recordings were obtained. In case 1 (Fig. 2 from Sutherling et al. [1988]), the MEG single dipole fit to the 20 ms peak was shown on the anterior side of the central sulcus. The 30 ms single‐dipole fit, on the other hand, was on the posterior bank of the central sulcus. The ECoG 20 ms single‐dipole fit was on the posterior bank of the central sulcus and the ECoG 30 ms dipole was on the anterior bank of the central sulcus. In case 2 (Fig. 4 from Sutherling et al. [1988]), the MEG 20 ms single‐dipole fit was on the posterior bank and the 30 ms dipole was on the anterior bank of the central sulcus. The exact location of the ECoG 20 ms single‐dipole fit, though in the correct postcentral gyrus, was closer to the postcentral sulcus than the central sulcus (i.e., on the anterior bank of the postcentral sulcus rather than the posterior bank of the central sulcus). A similar phenomenon was seen in our single‐dipole MEG fits to the 20 ms peak (Figs. 2 and 4 in this paper). The ECoG 30 ms dipole was directly in the sulcus in case 2 of Sutherling et al. [1988]. We believe the previous MEG and ECoG results (including our own MEG results) where single‐dipole fits were applied to the 20 ms and 30 ms peaks show the following common features: Although in the majority of cases, the single‐dipole locations were on the posterior bank of the central sulcus for the 20 ms peak and the anterior bank for the 30 ms peak, a significant number of cases were localized either to the opposite side of the central sulcus or were too posterior to the postcentral sulcus (anterior bank). We believe that such a variation in locations was the result of undermodeling due to the use of single‐dipole fits. The example in Figure 9 demonstrates this point. On the other hand, variation of locations for both the anterior and posterior central sulcus sources with MSST is markedly less and all source locations except for one were in the expected banks of the central sulcus.
We believe that the discrepancy between the results from the two approaches (MSST vs. single dipole) can be explained by the fundamental difference between the spatio‐temporal multidipole fit and the peak‐latency single‐dipole fit. The traditional single‐dipole approach makes the assumption that a single focal source is active at each peak. On the other hand, the spatio‐temporal multidipole approach assumes that a number of sources are active throughout a given time interval, and their summed contributions give rise to the measured signal. In this study, the number of active sources is determined by SVD and a search across a number of modeled dipoles. Since no constraint is imposed on the number of modeled sources, the spatio‐temporal approach should be more objective than the traditional single‐dipole fit to peak‐latency approach.
Furthermore, there is a difference between our Multi‐Start Spatio‐Temporal approach and other typical spatio‐temporal approaches (e.g., BESA [Berg and Scherg, 1994]; Neuromag Software [Neuromag Ltd., 1996]). As mentioned in the Methods section, typical spatio‐temporal approaches require the user to provide initial guesses for the modeled dipole locations. Such an approach can be subjective and biased. If the initial guesses provided by the user are not close enough to the true source locations, the algorithm may be trapped in one of the local minima, without being able to find the true locations. This situation can easily happen when one is dealing with data sets containing sources where the locations are unknown in advance. For example, if one has no reason to suspect the existence of the anterior central sulcus source from median nerve stimulation, one is unlikely to include this location in the starting parameters and consequently, the algorithm may fail to find this location. This is especially true for weaker sources (i.e., the starting parameters should be fairly close to the actual source locations). The Multi‐Start Spatio‐Temporal approach, on the other hand, only requires that the user specify a volume within which to perform the multi‐start search for a specified model order. Since it does not require the user to provide the initial dipole locations, the search tends to be more objective and unbiased [Huang et al., 1998; Aine et al., 2000].
The orientations of the posterior and anterior central sulcus sources obtained by MSST showed nearly opposite directions (Fig. 5). Our previous experience with computer simulations show that one sign of over‐modeling is the presence of two sources in the same general locations with opposing orientations. However, our present results show: (1) these two sources are more separated in space (11.2 mm on average) than sources in the computer simulations that suggest overmodeling, and (2) the orientations of the two sources are nearby but not exactly opposing. Two additional factors help support the interpretation that the data were not overmodeled. One, as we have mentioned, we used the reduced Chi‐square changes associated with a search across different model orders to help identify the adequate number of sources. Reduced Chi‐square values will decrease significantly with increases of model order before an adequate model order is reached. However, if an adequate model is reached, then adding one more dipole (over modeling) will not result in significant decrease of the reduced Chi‐squares [Supek and Aine, 1993]. For all 16 responses shown in this paper, two dipoles are required by this criterion. The second factor is that the multistart algorithm performs the fitting from randomly distributed starting locations. If one dipole is sufficient to account for the data then the addition of a second dipole (overmodeling) will result in the second dipole locations scattering over the volume [Huang et al., 1998] for multiple different starting locations. In all of the 16 responses, we localized two clusters of dipoles.
Using the spatio‐temporal approach we have obtained the time courses of the anterior and posterior central sulcus sources over the 15–34 ms interval after electrical median nerve stimulation, and demonstrate that these two sources are significantly overlapped in time across this early interval. This finding directly challenges the basic assumption of the single‐dipole peak‐latency fit strategy that each observed peak represents a separate source in space with no overlap in time between sources. In this paper, a peak is identified from a source's time course obtained from the spatio‐temporal modeling, which is defined in the source space. On the other hand, previous EEG and MEG studies identified a peak from the raw signal (e.g., ERP components), which is defined in the measurement space.
Physiological Significance of the Anterior Central Sulcus Source
We showed that MSST can reliably localize an anterior central sulcus source from median nerve stimulation, in addition to the expected posterior central sulcus source. Furthermore, with the index‐finger lifting motor task, we showed that the anterior central sulcus sources from median nerve MEG response were at the same or similar regions as the primary motor responses (MI). Previous studies using other neurophysiological techniques have shown that pyramidal tract neurons in MI receive strong topographically organized afferent input from sensory receptors in the periphery [Rosen and Asanuma, 1972; Lemon and Porter, 1976; Wong et al., 1978; Huang et al., 1989; Davidoff, 1990; Baldissera and Leocani, 1995]. Such input is similar to that arriving at the sensory cortex and is very effective in altering pyramidal tract activity [Asanuma and Arissian, 1984]. It is believed that the peripheral input to MI is through two paths: (1) the first is a path that involves direct input to MI from the thalamus [Asanuma et al., 1980; Jones et al., 1979; Lemon and vav der Burg, 1979; Lemon, 1981; Leichnetz, 1986; Davidoff, 1990; Padel and Relova, 1991]; (2) the second path involves corticocortical inputs from the somatosensory cortex [Brooks et al., 1961; Pandya and Kuypers, 1969; Jones et al., 1978; Darian‐Smith et al., 1993]. However, it is still debatable by which pathway the early signal arrives at primary motor cortex following the median nerve stimulation. If the anterior central sulcus source arrives via corticocortical connections, one would expect some delay in the time courses between the posterior (in area 3b) and anterior (in area 4) central sulcus sources. Although the majority of cases in this study do show that the posterior central sulcus source precedes the anterior central sulcus source by a couple of milliseconds, there are a few cases where we cannot distinguish the order of activation for these two sources, at least at the current sampling rate of 1,000 points per sec. Given the findings from Darian‐Smith and colleagues [1993] that direct connections between 3b and 4 are rare, the signals most likely relay to area 4 through other areas (e.g. areas 2 and/or 5) under the corticocortical model. This will cause a latency delay of about 10–20 ms, markedly larger than what we see in our results. Another possible explanation is that the anterior central sulcus source and posterior sources receive separate inputs from thalamo‐cortical connections. We believe this can better explain the temporal dynamics of the posterior and anterior central sulcus sources in our findings.
Human and monkey lesion studies by Allison and his colleagues [1991a, 1991b] appear to suggest that a single tangentially oriented source on the posterior bank of the central sulcus (area 3b) can explain both the 20 ms and 30 ms components. There is a discrepancy between our two tangentially oriented dipoles (in nearly opposite directions) and the single tangential dipole model used by Allison and his colleagues in interpreting their lesion data. We carefully examined the previous lesion data by Allison and colleagues and summarized what we consider to be the relevant results of their studies into three findings: (1) For cortical stimulation, lesions involving excision of the hand somatosensory area (area 3b) on the posterior bank of the central sulcus resulted in an absence of both the 20 ms and 30 ms components [Allison et al., 1991a]; (2) For median nerve stimulation, lesions of area 3b cause substantial reductions, but did not completely eliminate the early responses in some cases (e.g., Fig. 2 in Allison et al. [1991a]); (3) Excision of the anterior bank of the central sulcus (area 4) caused visible increases of the N20 and P30 components during cortical‐surface EEG recording (Fig. 7 in Allison et al., 1991a). We believe that their human lesion results are important to our current study in two ways: (1) their results support our results indicating that there are two tangentially oriented sources in area 3b (stronger source) and area 4 (weaker source) with nearly opposite orientations. In the case of a lesion in area 3b, the stronger source was damaged, substantial reduction of signal is expected. On the other hand, in the case of a lesion in area 4, the weaker source was damaged, the total electric potential measured by cortical‐surface electrodes should increase due to a lack of cancellation (i.e., the opposing current flow from area 4 was removed); (2) Their results support our finding that the two sources are both active throughout the early interval and disagrees with the assumption adopted by Kawamura et al. [1996] that the posterior central sulcus source accounts for the 20 ms component and the anterior central sulcus source accounts for the 30 ms component. Allison's results suggest that the 30 ms component should be absent after the excision of the hand motor area if it were the only source that contributed to the 30 ms component. In addition, the first finding in the lesion studies using cortical stimulation indicate that the corticocortical pathway may not be the main pathway for early signal (20–30 ms) to arrive at the primary motor region.
The monkey somatosensory lesion data in Allison et al. [1991b] showed the following: Before the abolishment of the hand somatosensory cortex, cortical electrodes on the posterior side of the central sulcus showed an N10 (analog to human N20) peak and electrodes on the anterior side showed a corresponding P10 (analog to human P20). After the abolishment, electrodes on the postcentral side showed a visible peak at about 7–8 ms with positive polarity (Fig. 10 of Allison et al., 1991b). Allison and colleagues suggested a subcortical origin for this signal. However, we believe that an alternative explanation may also be possible: After damage to the posterior central source (the stronger source), the contributions from the anterior central source became visible. Since the anterior central sulcus source pointed approximately in the opposite direction, relative to the posterior central sulcus source. One might see a polarity change in the cortical recording. The fact that the anterior central source was earlier (by a couple of milliseconds), relative to the posterior central source is not a major concern to us, if we believe that both of them result from thalamo‐cortical projections. A difference between the monkey and human data is that the monkey data showed a change in polarity and the human data showed a significant reduction (but not a change in polarity) of the early responses. This may be explained by the degree of abolishment (excision) in the two different studies, given the fact that a complete excision in human hand somatosensory cortex is a nontrivial job.
To summarize, a comparison of previous lesion findings with our results suggest that the lesion data provide evidence that are not contradictory to our 2 dipole model, with nearly opposite net directions of current flow, for modeling the early components (20 ms and 30 ms) of the electric median nerve stimulation response.
We have demonstrated that one can activate an area of cortex normally associated with motor function using electrical median nerve stimulation with MEG. We propose that the anterior central sulcus source due to median nerve stimulation may be used to monitor the integrity of tissue in motor cortex. This approach has potential clinical benefit for certain groups of patients who have difficulties performing motor tests in some stages of the disease (e.g., acute stroke). Recently we have applied this technique to monitor motor function for patients with acute sensorimotor stroke and achieved promising results (in preparation).
Finally, our data also showed that the primary motor sources localized from an index‐finger lift task were either in the same location or slightly more medial than the locations of the anterior central sulcus sources evoked from electrical median nerve stimulation. We believe this is because electrical median nerve stimulation activates the representation of the first three fingers, weighted toward the thumb. Thus, the fact that the index finger's representation on the motor strip is slightly more medial than that of the thumb [Penfield and Rasmussen, 1950] can explain the small discrepancy between the exact locations of the primary motor sources from index‐finger lift task and the anterior central sulcus sources from median nerve somatosensory stimulation, with the index finger motor source being more medial.
CONCLUSIONS
This study examined the early MEG somatosensory responses evoked by electrical median nerve stimulation using a Multi‐Start Spatio‐Temporal multiple dipole fitting technique. Two sources were identified and localized on both sides of central sulcus for 8 normal subjects (16 right and left hemispheres). The time courses of these sources overlapped significantly. When compared with traditional single‐dipole fits to peak latencies, MSST provided more reliable localizations of the anterior and posterior central sulcus sources. Furthermore, the anterior central sulcus source in somatosensory responses localizes to the same region of cortex identified from responses evoked by a finger‐lifting task, suggesting that one may assess the integrity of cortical tissue in the region of primary motor cortex by using electrical somatosensory stimulation.
Acknowledgements
We thank Elaine Best of Biophysics Group at Los Alamos National Laboratory for her help in developing computer software to analyze the MEG data. And we highly appreciated the comments and suggestions from two anonymous reviewers that strengthened this work.
REFERENCES
- Achim A, Richer F, Saint‐Hilaire JM. (1991): Methodological consideration for the evaluation of spatio‐temporal source models. Electroenceph Clin Neurophysiol 79: 227–240. [DOI] [PubMed] [Google Scholar]
- Aine C, Huang M, Stephen J, Christner R. (2000): Multi‐start algorithms for MEG empirical data analysis reliably characterize locations and time‐courses of multiple sources. NeuroImage 12: 159–172. [DOI] [PubMed] [Google Scholar]
- Allison T, Wood CC, McCarthy G, Spencer DD. (1991a): Cortical somatosensory evoked potentials. II. Effects of excision of somatosensory or motor cortex in humans and monkeys. J Neurophysiol 66: 64–82. [DOI] [PubMed] [Google Scholar]
- Allison T, McCarthy G, Wood CC, Jones SJ. (1991b): Potentials evoked in human and monkey cerebral cortex by stimulation of the median nerve. Brain 114: 2465–2503. [DOI] [PubMed] [Google Scholar]
- Ahonen AI, Hämäläinen MS, Kajola MJ, Knuutila JET, Laine. (1992): A 122‐channel magnetometer covering the whole head. In: Dittmar A, Froment JC, eds): Proceedings of the Satellite Symposium on Neuroscience and Technology, 14th annual conference of IEEE Engineering in Medicine and Biology Society: IEEE Engineering and Medicine and Biology Society, pp. 16–20.
- Asanuma H, Arissian K. (1984): Experiments on functional role of peripheral input to motor cortex during voluntary movements in the monkey. J Neurophysiol 52: 212–227. [DOI] [PubMed] [Google Scholar]
- Asanuma H, Larsen KD, Yumiya H. (1980): Peripheral input pathways to the monkey motor cortex. Exp Brain Res 38: 349–355. [DOI] [PubMed] [Google Scholar]
- Baldissera F, Leocani L. (1995): Afferent excitation of human motor cortex as revealed by enhancement of direct cortico‐spinal action on motoneurones. Electroenceph Clin Neurophysiol 97: 394–401. [DOI] [PubMed] [Google Scholar]
- Berg P, Scherg M. (1994): Handbook of BESA: Brain Electric Source Analysis, Version 2.0, MEGIS, Munich. [Google Scholar]
- Brooks VB, Rudomin P, Slayman CL. (1961): Peripheral receptive fields of neurons in the cat's cerebral cortex. J Neurophysiol 24: 302–325. [Google Scholar]
- Chen W, Wong KM, Reilly JP. (1991): Detection of the number of signals: a predicted eigen‐threshold approach. IEEE Trans Signal Process 39: 1088–1098. [Google Scholar]
- Darian‐Smith C, Darian‐Smith I, Burman K, Ratcliffe N. (1993): Ipsilateral cortical projections to areas 3a, 3b, and 4 in the macaque monkey. J Comp Neurol 335: 200–213. [DOI] [PubMed] [Google Scholar]
- Davidoff RA. (1990): The pyramidal tract. Neurology 40: 332–339. [DOI] [PubMed] [Google Scholar]
- De Munck JC. (1990): The estimation time varying on the basis of evoked potentials. Electroenceph Clin Neurophysiol 77: 156–160. [DOI] [PubMed] [Google Scholar]
- Ferguson AS, Zhang X, Stroink G. (1994): A complete linear discretization for calculating the magnetic field using the boundary element method. IEEE Trans Biomed Eng 41: 455–459. [DOI] [PubMed] [Google Scholar]
- Forss N, Hari R, Salmelin R, Ahonen A, Hamalainen M, Kajola M, Knuutila J, Simola J. (1994): Activation of the human posterior parietal cortex by median nerve stimulation. Exp Brain Res 99: 309–315. [DOI] [PubMed] [Google Scholar]
- Forss N, Jousmaki V. (1998): Sensorimotor integration in human primary and secondary somatosensory cortices. Brain Res 781: 259–267. [DOI] [PubMed] [Google Scholar]
- Golub GH, Van Loan CF. (1984): Matrix Computations, 2nd ed. Baltimore: Johns Hopkins University Press. [Google Scholar]
- Hämäläinen MS, Sarvas J. (1989): Realistic conductor geometry model of the human head for interpretation of neuromagnetic data. IEEE Trans Biomed Eng 36: 165–171. [DOI] [PubMed] [Google Scholar]
- Hari R, Karhu J, Hämäläinen M, Knuutila J, Salonen O, Sams M, Vilkman V. (1993): Functional organization of the human first and second somatosensory cortices: a neuromagnetic study. Eur J Neurosci 5: 724–734. [DOI] [PubMed] [Google Scholar]
- Hari R, Forss N. (1999): Magnetoencephalography in the study of human somatosensory cortical processing. Philos Trans R Soc Lond B Biol Sci 354: 1145–1154. [DOI] [PMC free article] [PubMed] [Google Scholar]
- Huang C‐S, Hiraba H, Sessle BJ. (1989): Input‐output relationships of the primary face motor cortex in the monkey. J Neurophysiol 61: 350–362. [DOI] [PubMed] [Google Scholar]
- Huang M, Aine CJ, Supek S, Best E, Ranken D, Flynn ER. (1998): Multi‐start downhill simplex method for spatio‐temporal source localization in Magnetoencephalography. Electroenceph Clin Neurophysiol 108: 32–44. [DOI] [PubMed] [Google Scholar]
- Ilmoniemi RJ, Hamalainen MS, Knuutila J. (1985): The forward and inverse problems in the spherical model In: Weinberg, Stroink, and Katila, (eds): Biomagnetism: applications and theory. New York: Pergamon, pp. 278–282. [Google Scholar]
- Jones EG, Coulter JD, Hendry SHC. (1978): Intracortical connectivity of architectonic field in somatic sensory, motor and parietalcortex of monkey. J Comp Neurol 181: 291–348. [DOI] [PubMed] [Google Scholar]
- Jones EG, Wise SP, Coulter JD. (1979): Differential thalamic relationships of sensory‐motor and parietal cortical fields in monkeys. J Comp Neurol 183: 833–892. [DOI] [PubMed] [Google Scholar]
- Jousmaki V, Forss N. (1998): Effect of stimulus intensity on signals from human somatosensory cortices. Neuroreport 9: 3427–3431. [DOI] [PubMed] [Google Scholar]
- Kawamura T, Nakasato N, Seki K, Kanno A, Fujita S, Fujiwara S, Yoshimoto T. (1996): Neuromagnetic evidence of pre‐ and post‐central cortical sources of somatosensory evoked responses. Electroenceph Clin Neurophysiol 100: 44–50. [DOI] [PubMed] [Google Scholar]
- Leahy RM, Mosher JC, Spencer ME, Huang MX, Lewine JD. (1998): A study of dipole localization accuracy for MEG and EEG using a human skull phantom. Electroenceph Clin Neurophysiol 107: 159–173. [DOI] [PubMed] [Google Scholar]
- Leichnetz GR. (1986): Afferent and efferent connections of the dorsolateral precentral gyrus (area 4 hand/arm region) in the macaque monkey, with comparisons to area 8. J Comp Neurol 254: 460–492. [DOI] [PubMed] [Google Scholar]
- Lemon RN, Porter R. (1976): Afferent input to movement‐related precentral neurones in conscious monkey. Proc R Soc Lond [Biol] 194: 313–339. [DOI] [PubMed] [Google Scholar]
- Lemon RN, van der Burg J. (1979): Short‐latency peripheral inputs to thalamic neurones projecting to the motor cortex in the monkey. Exp Brain Res 36: 445–462. [DOI] [PubMed] [Google Scholar]
- Lemon RN. (1981): Functional properties of monkey motor cortex neurones receiving afferent input from the hand and fingers. J Physiol (Lond) 311: 497–519. [DOI] [PMC free article] [PubMed] [Google Scholar]
- Mauguiere F, Merlet I, Forss N, Vanni S, Jousmaki V, Adeleine P, Hari R. (1997a): Activation of a distributed somatosensory cortical network in the human brain: a dipole modeling study of magnetic fields evoked by median nerve stimulation. Part I: Location and activation timing of SEF sources. Electroenceph Clin Neurophysiol 104: 281–289. [DOI] [PubMed] [Google Scholar]
- Mauguiere F, Merlet I, Forss N, Vanni S, Jousmaki V, Adeleine P, Hari R. (1997b): Activation of a distributed somatosensory cortical network in the human brain: a dipole modeling study of magnetic fields evoked by median nerve stimulation. Part II: Effect of stimulus rate, attention and stimulus detection. Electroenceph Clin Neurophysiol 104: 290–295. [DOI] [PubMed] [Google Scholar]
- Medvick PA, Lewis PS, Aine C, Flynn ER. (1989): Monte‐Carlo analysis of localization errors in magnetoencephalography In: Williamson SJ, Hoke M, Stroink G, Kotani M, (eds): Advances in biomagnetism. New York: Plenum, pp. 543–546. [Google Scholar]
- Mejis JWH, Bosch FGC, Peters MJ, Lopes da Silva FH. (1987): On the magnetic field distribution generated by a dipolar current source situated in a realistically shaped compartment model of the head. Electroenceph Clin Neurophysiol 66: 286–298. [DOI] [PubMed] [Google Scholar]
- Mosher JC, Lewis PS, Leahy RM. (1992): Multiple dipole modeling and localization from spatio‐temporal MEG data. IEEE Trans Biomed Eng 39: 541–557. [DOI] [PubMed] [Google Scholar]
- Nelder JA, Mead R. (1965): A simplex method for function minimization. Comput J 7: 308–313. [Google Scholar]
- Neuromag Ltd. (1996): Neuromag Source Modeling Users's Manual Version 4.4. Neuromag Ltd., Helsinki, Finland. [Google Scholar]
- Okada YC, Papuashvili N, Xu C. (1996): What can we learn from MEG studies of the somatosensory system of the swine? Electroenceph Clin Neurophysiol Suppl 47: 35–46. [PubMed] [Google Scholar]
- Padel Y, Relova JL. (1991): Somatosensory responses in cat motor cortex I. Identification and course of an afferent pathway. J Neurophysiol 66: 2041–2056. [DOI] [PubMed] [Google Scholar]
- Pandya DN, Kuypers H. (1969): Cortico‐cortical connections in the rhesus monkey. Brain Res 13: 13–36. [DOI] [PubMed] [Google Scholar]
- Penfield W, Rasmussen T. (1950): The cerebral cortex of man, a clinical study of localization of function. New York: Macmillan. [Google Scholar]
- Rosen I, Asanuma H. (1972): Peripheral afferent inputs to the forelimb area of the monkey motor cortex: input‐output relations. Exp Brain Res 14: 257–273. [DOI] [PubMed] [Google Scholar]
- Sarvas J. (1987): Basic mathematical and electromagnetic concepts of the bio‐magnetic inverse problems. Phys Med Biol 32: 11–22. [DOI] [PubMed] [Google Scholar]
- Scherg M, Von Cramon D. (1986): Evoked dipole source potentials of the human auditory cortex. Electroenceph Clin Neurophysiol 65: 344–360. [DOI] [PubMed] [Google Scholar]
- Schlitt H, Heller L, Aaron R, Best E, Ranken D. (1995): Evaluation of boundary element method for the EEG forward problem: effect of linear interpolation. IEEE Trans Biomed Eng 42: 52–58. [DOI] [PubMed] [Google Scholar]
- Supek S, Aine CJ. (1993): Simulation studies of multiple dipole neuromagnetic source localization: model order and limits of source resolution. IEEE Trans Biomed Eng 40: 529–540. [DOI] [PubMed] [Google Scholar]
- Sutherling WW, Crandall PH, Darcey TM, Becker DP, Levesque MF, Barth DS. (1988): The magnetic and electric fields agree with intracranial localizations of somatosensory cortex. Neurology 38: 1705–1714. [DOI] [PubMed] [Google Scholar]
- Wong YC, Kwan HC, MacKay WA, Murphy JT. (1978): Spatial organization of precentral cortex in awake primates. I. Somato‐sensory inputs. J Neurophysiol 41: 1107–1120. [DOI] [PubMed] [Google Scholar]
- Wood CC, Cohen D, Cuffin BN, Yarita M, Allison T. (1985): Electrical sources in human somatosensory cortex: identification by combined magnetic and potential recording. Science 227: 1051–1053. [DOI] [PubMed] [Google Scholar]