

Abstract
Previous positron emission tomography (PET) and functional magnetic resonance imaging (fMRI) studies show that during attentive listening, processing of phonetic information is associated with higher activity in the left auditory cortex than in the right auditory cortex while the opposite is true for musical information. The present PET study determined whether automatically activated neural mechanisms for phonetic and musical information are lateralized. To this end, subjects engaged in a visual word classification task were presented with phonetic sound sequences consisting of frequent (P = 0.8) and infrequent (P = 0.2) phonemes and with musical sound sequences consisting of frequent (P = 0.8) and infrequent (P = 0.2) chords. The phonemes and chords were matched in spectral complexity as well as in the magnitude of frequency difference between the frequent and infrequent sounds (/e/ vs. /o/; A major vs. A minor). In addition, control sequences, consisting of either frequent (/e/; A major) or infrequent sounds (/o/; A minor) were employed in separate blocks. When sound sequences consisted of intermixed frequent and infrequent sounds, automatic phonetic processing was lateralized to the left hemisphere and musical to the right hemisphere. This lateralization, however, did not occur in control blocks with one type of sound (frequent or infrequent). The data thus indicate that automatic activation of lateralized neuronal circuits requires sound comparison based on short‐term sound representations. Hum. Brain Mapping 10:74–79, 2000. © 2000 Wiley‐Liss, Inc.
Keywords: musical information, phonetic information, lateralization, complex tones, automatic processing, mismatch negativity (MMN), position emission tomography (PET)
INTRODUCTION
As early as 1874, Wernicke assigned auditory perception functions to a specific brain area by demonstrating that a patient who had suffered from a severe deficit in speech understanding, exhibited a broad lesion in the left temporal lobe on autopsy. During the following decades, several researchers confirmed the importance of the left temporal areas for speech perception. In parallel, right‐hemisphere lesions were found to interfere with music processing [for a review, see Basso, 1993]. Behavioral methods and brain‐imaging studies on healthy subjects later confirmed that during attentive tasks, phonetic information is primarily processed in the left hemisphere and nonphonetic auditory information in the right hemisphere [Auzou et al., 1995; Binder et al., 1995; Mazoyer et al., 1993; Mazziotta et al., 1982; Paquette et al., 1996; Petersen et al., 1988; Zatorre et al., 1992]. Because of the involvement of attention in these studies, however, conclusions about the automatically activated primary‐level neural networks underlying lateralization cannot be made.
By recording the mismatch negativity (MMN) electric event‐related potential (ERP) [Näätänen, 1992], automatically activated neural sound representations can be probed. The MMN is an index of change detection between a cortical memory trace representing the features of a repetitive stimulus (“standard”) and the features of the incoming (“deviant”) stimulus [for reviews, see Alho, 1995; Schröger, 1997]. The MMN can be recorded in passive listening conditions, that is, while the subject concentrates on performing a behavioral task unrelated to auditory stimulation such as reading a book or playing a computer game. In spite of its passive elicitation, the MMN predicts the subject's behavioral performance in several perceptual tasks involving different sound types, for instance, the frequency of pure tones [Lang et al., 1990; Tiitinen et al., 1994], the spectrotemporal structure of sound patterns [Näätänen et al., 1993; Tervaniemi et al., 1997], and the timbre of synthesized instrumental sounds [Toiviainen et al., 1998].
The generator locus of the the MMNm (magnetoencephalographic counterpart of the MMN) can be determined by inverse modeling techniques such as equivalent‐current dipole models [Hämäläinen et al., 1993; Näätänen et al., 1994]. Recently, it was shown that complex nonphonetic sounds are mainly represented in the right hemisphere [Alho et al., 1996; Tervaniemi et al., 1999]. In contrast, the phonemes belonging to the subjects' native language may be represented by the left hemisphere [Alho et al., 1998; Näätänen et al., 1997].
The present study was conducted to determine with hemodynamic measures whether the neural processing of phonetic and musical information is lateralized at the automatic level of auditory processing. The PET methodology was employed to enable direct determination of the locus/loci of the MMN (without the need for inverse modeling as in EEG/MEG studies). The phonetic and musical stimuli were matched in spectral complexity as well as in the magnitude of stimulus change occurring within them.
MATERIALS AND METHODS
The experiment consisted of six conditions, of two blocks each, which were presented in counterbalanced order. In the “Standard and Deviant Chords” condition, the standard A major chords (probability of occurrence P = 0.8) were randomly replaced by deviant A minor chords (P = 0.2; chord duration 200 ms; the stimulus‐onset asynchrony (SOA) 500 ms). In the “Standard Chords Alone” condition, subjects were presented with frequent A major chords only (P = 1.0; SOA 500 ms). In the “Deviant Chords Alone” condition, deviant A minor chords were presented infrequently with random SOA. Their frequency of occurrence equalled the Deviant Chord presentation rate in the Standard and Deviant Chord condition. Thus, the average presentation rate was one chord every 2.5 sec. The chords were composed of four sinusoidal tones generated by the PC‐based NeuroStim‐program (NeuroScan Inc.).
Similar three conditions were employed using phonemes of 400 ms in duration.1 “Standard /e/ and Deviant /o/,” “Standard Phonemes alone,” and “Deviant Phonemes Alone.” The semisynthetic phonemes were generated based on the vocal‐tract model [Alku, 1992] by synthesizing the natural glottal excitation. Phonemes were delivered with a stimulus‐onset asynchrony of 500 ms.
In both chord and phoneme conditions, the deviant stimuli differed from the standard stimuli in their second spectral component. So the physical change from A major to A minor approximated the change of one octave in the second formant from phoneme /e/ to /o/ (see Table I). In all conditions, the sounds were binaurally delivered via headphones with an intensity of 65 dB SPL.
Table I.
The frequencies employed in constructing the phoneme (upper panel) and chord (lower panel) stimulation
| Formant 1 | Formant 2 | Formant 3 | Formant 4 | |
|---|---|---|---|---|
| Phonemes | ||||
| Standard/e/ | 450 Hz | 1866 Hz | 2540 Hz | 3500 Hz |
| Deviant/o/ | 450 Hz | 921 Hz | 2540 Hz | 3500 Hz |
| Tone 1 | Tone 2 | Tone 3 | Tone 4 | |
|---|---|---|---|---|
| Chords | ||||
| Standard A major | 440 Hz | 1109 Hz | 1319 Hz | 1760 Hz |
| Deviant A minor | 440 Hz | 523 Hz | 1319 Hz | 1760 Hz |
Subjects were 30 healthy, right‐handed, Russian males, 15 subjects participated in the Phoneme conditions (mean age 26.2 years) and 15 in the Chord conditions (mean age 23.1 years). All subjects had at least a secondary school education and were not musically trained. Participation was voluntary and all subjects gave informed consent.
During the experiment, subjects indicated by a button press the grammatical gender of nouns presented on a visual display. This task was used to direct subjects' attention away from the sounds.
In the PET measurements, HO was used as a blood‐flow tracer. Scans were obtained with PET system PC2048‐15B. In each condition, about 15–20 sec following the start of the stimulation, HO (half‐life 123 sec, 0.86 mCi/kg in 1–1.5 ml.) was injected through a catheter to the right antecubital vein. Scanning (60 sec) started automatically when a proper quantity of the tracer had entered the brain (about 15–20 sec following the injection). In determining the rCBF changes, the tracer distribution was analyzed without arterial blood sampling [Fox et al., 1984].
The experiments were carried out in accordance with the technical and ethical regulations of the Russian Ministry of Health and the Institute of the Human Brain.
The PET system PC2048‐15B (Scanditronix, Sweden) of the Institute of the Human Brain yields up to 15 horizontal PET slices of the brain, covering 9.75 cm of the z‐axis perpendicular to the slices. The emission data were reconstructed with a 7 mm hanning filter. The axial spatial resolution of the resulting images was 6.5 mm × 6.5 mm in the center of the field of view. Further analysis was performed using Statistical Parametric Mapping (version SPM96) software [Wellcome Department of Cognitive Neurology, London, UK; Internet SPM‐guide, http://www.fil.ion.bpmf.ac.uk/spm/course/notes.html]. The images were reformatted into 43 planes of 128 × 128 voxel matrices (each voxel 2 mm × 2 mm × 2 mm) with bilinear interpolation. The planes were corrected for head movement and transformed into the standard anatomical space [Talairach and Tournoux, 1988]. The images were smoothed with a 16 mm × 16 mm × 16 mm wide Gaussian filter. The significance of the task‐specific activation was tested with appropriate contrasts using the t‐statistic [SPMt; see Cherry and Phelps, 1996]. For all contrasts, a significance level of P < 0.01 was used for the cluster size. All the reported z‐score maxima exceeded a threshold of P < 0.001 (corrected for multiple comparisons).
RESULTS
Activity evoked by deviant sounds interleaved with standard sounds was revealed by subtracting the activity evoked by standard sound condition from that evoked in standard and deviant condition. Chord stimulation activated the right superior temporal gyrus (BA 42) (Fig. 1 upper panel, Table II). In contrast, phoneme stimulation activated the left superior temporal and middle temporal gyri (BA 21/22) (Fig. 1 lower panel, Table II). No statistically significant activations were observed in any other (e.g., subcortical) brain areas.
Figure 1.
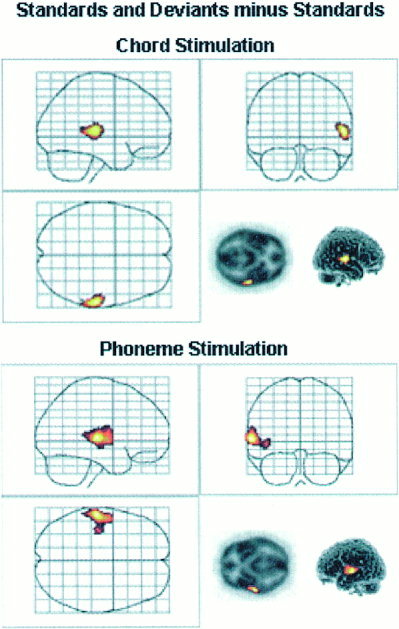
The activated areas in Deviant and Standard minus Standard comparison. Upper panel: Activated area in the right superior temporal gyrus during chord stimulation. Lower panel: Activated area in the left superior and middle temporal gyri during phoneme stimulation.
Table II.
Local maxima detected in the comparison standards and deviants minus the standards
| Z score | Talairach coordinates | Brain structure (BA = Brodmann area) | ||
|---|---|---|---|---|
| x | y | z | ||
| Phonemes | ||||
| 5.53* | −60 | −16 | 2 | Left medial temporal gyrus (BA 21/22) |
| 3.87 | −42 | −18 | −4 | Left medial temporal gyrus (BA 21) |
| 3.86 | −58 | 0 | 6 | Left superior temporal gyrus (BA 22) |
| Chords | ||||
| 3.93** | 58 | −24 | 8 | Right superior temporal gyrus (BA 42) |
*P < 0. 0008, **P < 0. 0135. (Significance of the cluster size.)
If a lower threshold for statistical significance of the cluster height was used (P < 0.01 uncorrected), both Chord and Phoneme stimulation activated left and right temporal‐lobe areas. Still, the activity extended to a larger area for phoneme stimulation in the left than in the right temporal lobe (cluster size 2491 vs. 765 in the left vs. right; P < 0. 0000 and 0. 0062, respectively). The same pattern of activity was found for chord stimulation in the right temporal lobe when compared with that in the left temporal lobe (cluster size 778 vs. 1749 in the left vs. right; P < 0. 0066 and 0. 0002, respectively). For phoneme stimulation, the activated area of the right hemisphere was located in the right superior gyrus like in the left hemisphere. For chord stimulation, the activated area within the left hemisphere was more medially located than that observed in the right hemisphere.
The activity related to the processing of the physical characteristics and infrequent presentation rate of deviant sounds when compared with frequently presented standard sounds was revealed by subtracting the activity evoked by standard sounds alone from that evoked by deviant sounds alone. With chord stimulation, this comparison revealed one activated area only in the right gyrus lingualis (BA 18) (Fig. 2, Table III). With phoneme stimulation, the corresponding comparison revealed no statistically significant loci of activation (Fig. 2, Table III).
Figure 2.
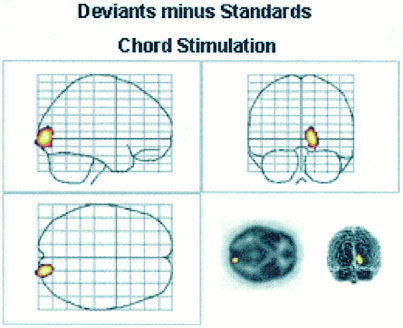
Locus of significant activation in the right gyrus lingualis during Chord stimulation in Deviant minus Standard comparison. During Phoneme stimulation, this comparison did not yield any significant activations.
Table III.
Local maxima detected in the comparison deviants alone minus standards alone
| Z score | Talairach coordinates | Brain structure (BA = Brodmann area) | ||
|---|---|---|---|---|
| x | y | z | ||
| Chords | ||||
| 4.78* | 16 | −86 | 0 | Right gyrus lingualis (BA 18) |
| Phonemes | No significant activations | |||
*P < 0. 0057. (Significance of the cluster size.)
DISCUSSION
The present PET recordings investigated the degree of hemispheric lateralization of phonetic and musical information processing. During the recording and auditory stimulation, the subjects were engaged in a visual word classification task. Automatic phoneme change processing was lateralized to the left auditory cortex whereas automatic change processing in musical sound is lateralized to the right auditory cortex (Fig. 1). This implies that the hemispheric lateralization in processing musical and phonetic stimulation shown in several attentive paradigms (see Introduction) is caused, at least partly, by automatically activated lateralized neural mechanisms. However, when deviant sounds were presented alone, that is, without being intermixed with standard sounds, they either did not significantly activate brain areas different from those activated by standard sounds alone (Phoneme stimulation) or activated the right gyrus lingualis (Chord stimulation) (Fig. 2).
The present data thus suggest that informational sound content (for instance, phonetic vs. musical) is encoded together with the physical sound features in separate neural representations. Before these functionally specialized neural circuits are activated a comparison process between two types of sounds is needed. Corroborating evidence was recently obtained by a MEG study employing analogous chord and phoneme stimulation [Tervaniemi et al., 1999]. It was found that the generator loci of an early cortical response P1m did not differ between chords and phonemes whereas the loci between chord and phoneme MMNm‐responses did differ. Together these two studies show that although the earliest stages of sound processing are not affected by sound quality, the later memory‐based stages are. However, conscious attention is not required for activating functionally specialized neural mechanisms.
The present data also confirm that automatic neural functions, well established in electric MMN and magnetic MMNm literature, can also be probed by hemodynamic measures despite their temporal resolution being remarkably lower than that of electric and magnetic event‐related responses [for related fMRI evidence, see Celsis et al., 1999; Opitz et al., 1999]. Furthermore, lateralization of these automatic functions previously suggested by MMN and MMNm findings in processing either musical [Alho et al., 1996; Tervaniemi et al., 1999] or phonetic information [Näätänen et al., 1997; Rinne et al., 1999] receives further support from the present evidence. In fact, because PET data can be interpreted without the uncertainties of inverse modeling (necessary in EEG/MEG source localization techniques), the present data, for the first time, directly demonstrate the hemispheric lateralization of the automatic memory‐based processing of phonetic and musical information. In addition, because PET recordings are performed without background noise (present in fMRI recordings) they provide a pure index of hemispheric lateralization—at least continuous white noise modulates lateralization of acoustic as well as phonetic processing [Herrmann et al., 2000; Shtyrov et al., 1998].
ACKNOWLEDGMENTS
The authors thank Dr. Daniela Perani and Dr. Trevor Penney, and Dr. Beitram Opitz for their valuable comments on the manuscript.
Footnotes
In pilot experiments, phonemes of 200 ms did not yield significant differences between the different conditions.
REFERENCES
- Alho K. 1995. Cerebral generators of mismatch negativity (MMN) and its magnetic counterpart (MMNm) elicited by sound changes. Ear Hear 16: 38–51. [DOI] [PubMed] [Google Scholar]
- Alho K, Tervaniemi M, Huotilainen M, Lavikainen J, Tiitinen H, Ilmoniemi, RJ , Knuutila J, Näätänen R. 1996. Processing of complex sounds in the human auditory cortex as revealed by magnetic brain responses. Psychophysiology 33: 369–375. [DOI] [PubMed] [Google Scholar]
- Alho K, Connolly JF, Cheour M, Lehtokoski A, Huotilainen M, Virtanen J, Aulanko R, Ilmoniemi RJ. 1998. Hemispheric lateralization in preattentive processing of speech sounds. Neurosci Lett 258: 9–12. [DOI] [PubMed] [Google Scholar]
- Alku P. 1992. Glottal wave analysis with pitch synchronous iterative adaptive inverse filtering. Speech Commun 11: 109–118. [Google Scholar]
- Auzou P, Eustache F, Etevenon P, Platel H, Rioux P, Lambert J, Lechevalier B, Zarifian E, Baron JC. 1995. Topographic EEG activations during timbre and pitch discrimination tasks using musical sounds. Neuropsychologia 33: 25–37. [DOI] [PubMed] [Google Scholar]
- Basso A. 1993. Amusia In: Boller F, Grafman J, editors. Handbook of neuropsychology (Vol. 8). Oxford: Oxford University Press; p. 373–390. [Google Scholar]
- Binder JR, Rao SM, Hammeke TA, Frost JA, Bandettini PA, Jesmanowicz A, Hyde JS. 1995. Lateralized human brain language systems demonstrated by task subtraction functional magnetic resonance imaging. Arch Neurol 52: 593–601. [DOI] [PubMed] [Google Scholar]
- Celsis P, Boulanouar K, Doyon B, Ranjeva JP, Berry I, Nespoulous JL, Chollet F. 1999. Differential fMRI responses in the left posterior superior temporal gyrus and left supramarginal gyrus to habituation and change detection in syllables and tones. NeuroImage 9: 135–144. [DOI] [PubMed] [Google Scholar]
- Cherry SR, Phelps ME. 1996. In: Toga AW, Mazziotta JC, editors. Brain mapping. The methods. San Diego: Academic Press; p. 191–221. [Google Scholar]
- Fox PT, Mintun MA, Raichle ME, Herscovitch P. 1984. A non‐invasive approach to quantitative functional brain mapping with H215O and positron emission tomography. J Cereb Blood Flow Metab 4: 329–333. [DOI] [PubMed] [Google Scholar]
- Hämäläinen M, Hari R, Ilmoniemi RJ, Knuutila J, Lounasmaa OV. 1993. Magnetoencephalography—Theory, instrumentation, and applications to noninvasive studies of the working human brain. Rev Mod Phys 65: 413–497. [Google Scholar]
- Herrmann CS, Oertel U, Wang Y, Maess B, Friederici, A . 2000. Noise affects auditory and linguistic processing differently: an MEG study. NeuroReport 11: 227–229. [DOI] [PubMed] [Google Scholar]
- Lang AH, Nyrke T, Ek M, Aaltonen O, Raimo I, Näätänen R. 1990. Pitch discrimination performance and auditive event‐related potentials In: Brunia CHM, Gaillard AWK, Kok A, editors. Psychophysiological brain research (Vol. 1). Tilburg: Tilburg University Press; p. 294–298. [Google Scholar]
- Mazoyer BM, Tzourio N, Frak V, Syrota A, Murayama N, Levrier O, Salamon G, Dehaene S, Cohen L, Mehler, J . 1993. The cortical representation of speech. J Cogn Neurosci 5: 467–479. [DOI] [PubMed] [Google Scholar]
- Mazziotta JC, Phelps ME, Carson RE, Kuhl DE. 1982. Tomographic mapping of human cerebral metabolism: auditory stimulation. Neurol 32: 921–937. [DOI] [PubMed] [Google Scholar]
- Näätänen, R . 1992. Attention and brain function. Hillsdale, NJ: Lawrence Erlbaum Associates. [Google Scholar]
- Näätänen R, Schröger E, Karakas S, Tervaniemi M, Paavilainen P. 1993. Development of a memory trace for a complex sound in the human brain. NeuroReport 4: 503–506. [DOI] [PubMed] [Google Scholar]
- Näätänen R, Ilmoniemi RJ, Alho K. 1994. Magnetoencephalography in studies of human cognitive brain function. Trends Neurosci 17: 389–395. [DOI] [PubMed] [Google Scholar]
- Näätänen R, Lehtokoski A, Lennes M, Cheour M, Huotilainen M, Iivonen A, Vainio M, Alku P, Ilmoniemi RJ, Luuk A, Allik J, Sinkkonen J, Alho K. 1997. Language‐specific phoneme representations revealed by electric and magnetic brain responses. Nature 385: 432–434. [DOI] [PubMed] [Google Scholar]
- Opitz B, Mecklinger A, van Cramon DY, Kruggel F. 1999. Combining electrophysiological and hemodynamic measures of the auditory oddball. Psychophysiology 36: 142–147. [DOI] [PubMed] [Google Scholar]
- Paquette C, Bourassa M, Peretz I. 1996. Left ear advantage in pitch perception of complex tones without energy at the fundamental frequency. Neuropsychologia 34: 153–157. [DOI] [PubMed] [Google Scholar]
- Petersen SE, Fox PT, Posner MI, Mintun M, Raichle ME. 1988. Positron emission tomographic studies of the cortical anatomy of single‐word processing. Nature 331: 585–589. [DOI] [PubMed] [Google Scholar]
- Rinne T, Alho K, Alku P, Holi M, Sinkkonen J, Virtznen J, Bertrand O, Näätänen R. 1999. Analysis of speech sounds is left–hemispheric dominant at 100–150 mg after sound onset. NeuroReport 10: 1113–1117. [DOI] [PubMed] [Google Scholar]
- Schröger E. 1997. On the detection of auditory deviations: a pre‐attentive activation model. Psychophysiology 34: 245–257. [DOI] [PubMed] [Google Scholar]
- Shtyrov Y, Kujala T, Ahveninen J, Tervaniemi M, Alku P, Ilmoniemi R, Näätänen R. 1998. Noise‐induced shift in hemispheric lateralization of speech processing. Neurosci Lett 251: 141–144. [DOI] [PubMed] [Google Scholar]
- Talairach J, Tournoux P. 1988. Co‐planar stereotaxic atlas of the human brain: 3‐dimensional proportional system: an approach to cerebral imaging. Stuttgart: Thieme. [Google Scholar]
- Tervaniemi M, Ilvonen T, Karma K, Alho K, Näätänen R. 1997. The musical brain: brain waves reveal the neurophysiological basis of musicality in human subjects. Neurosci Lett 226: 1–4. [DOI] [PubMed] [Google Scholar]
- Tervaniemi M, Kujala A, Alho K, Virtanen J, Ilmoniemi RJ, Näätänen R. 1999. Functional specialization of the human auditory cortex in processing phonetic and musical sounds: a magnetoencephalographic (MEG) study. NeuroImage 9: 330–336. [DOI] [PubMed] [Google Scholar]
- Tiitinen H, May P, Reinikainen K, Näätänen R. 1994. Attentive novelty detection in humans is governed by pre‐attentive sensory memory. Nature 372: 90–92. [DOI] [PubMed] [Google Scholar]
- Toiviainen P, Tervaniemi M, Louhivuori J, Huotilainen M, Saher M, Näätänen R. 1998. Musical timbre: convergence of neural, behavioral, and computational approaches. Music Percept 16: 223–241. [Google Scholar]
- Wernicke C. 1874. Der aphasische symptomencomplex: eine psychologische studie auf anatomischer basis (English translation in Wernicke's works on aphasia: a sourcebook and review, Eggert GH, 1977. The Hague: Mouton Publishers. [Google Scholar]
- Zatorre RJ, Evans AC, Meyer E, Gjedde A. 1992. Lateralization of phonetic and pitch discrimination in speech processing. Science 256: 846–849. [DOI] [PubMed] [Google Scholar]