

Abstract
Arithmetic processing deficits in persons with fragile X Syndrome (fraX), the most common heritable cause of mental retardation, are well known. In this study, we characterize the neural underpinnings of these performance deficits using functional MRI. Given that a single gene defect (FMR1) is known to be responsible for this disorder, we also assess whether brain activation in arithmetic processing areas is related to amount of FMR1 protein expression (FMRP). Subjects included 16 females with fraX, and 16 female age‐matched controls. Subjects viewed arithmetic equations with two (1 + 3 = 4) or three (2 + 3 − 1 = 5) operands, and were asked to judge whether the results were correct or not. Subjects with fraX showed significant impairment in behavioral performance on the 3‐operand but not the 2‐operand arithmetic equations. Significant brain activation was observed bilaterally in the prefrontal and parietal cortices for unaffected subjects, and bilateral prefrontal and left angular gyrus for subjects with fraX, for both trial types. Subjects with fraX exhibited less overall activation than did unaffected subjects in both types of trials; and, unlike the unaffected group, did not show increased extent of activation in association with greater task difficulty. During the 3‐operand trials, activation in bilateral prefrontal and motor/premotor, and left supramarginal and angular gyri were positively correlated with FMRP, suggesting that decreased FMR1 protein expression underlies deficits in math performance in persons with fraX. More broadly, this investigation demonstrates a unique bridging of cognitive and molecular neuroscience and represents a useful approach for the study of brain development and function. Hum. Brain Mapping 16:206–218, 2002. © 2002 Wiley‐Liss, Inc.
Keywords: fMRI, arithmetic processing, fragile X syndrome, FMRP, molecular neuroscience, cognitive neuroscience, angular gyrus
INTRODUCTION
Fragile X syndrome (fraX) is the most common heritable cause of neurodevelopmental disability, with an estimated prevalence of ∼1 in every 2,000–4,000 live births [Turner et al., 1996]. In 1991, a single mutated gene (FMR1) was identified as the cause of fraX. The typical mechanism by which the normal FMR1 gene becomes mutated involves an increase in trinucleotide (CGG) repeats, resulting in an abnormally long deoxyribonucleic acid (DNA) segment. When the number of repeats increases beyond ∼200, the chemical modification process called DNA methylation is more likely to occur. This, in turn, inactivates the FMR1 gene, leading to decreased FMR1 protein and deficits in cognitive processing. The cognitive profile of fraX includes deficits in visuospatial processing and working memory, visual‐motor coordination, and poor arithmetic skills [Baumgardner et al., 1994; Freund and Reiss, 1991; Grigsby et al., 1990; Kwon et al., 2001; Mazzocco et al., 1993].
Females with fraX have been identified as having a pattern of relative weakness on arithmetic reasoning and digit span [Brainard et al., 1991; Kemper et al., 1986; Miezejeski et al., 1986], and to be significantly worse on the four symptoms of Gerstmann syndrome, including acalculia, the inability to do simple arithmetic [Grigsby et al., 1990]. In this study, we characterize both the arithmetic performance of females with fraX and the neural underpinnings of their performance deficits using functional magnetic resonance imaging (fMRI). In addition, we assess whether activation in arithmetic processing areas is related to amount of FMR1 protein expression (FMRP).
Much of what is known about brain localization of arithmetic processing comes from lesion studies. Although classically the parietal cortex is thought to underlie the acalculia component of Gerstmann syndrome, acalculia has also been reported in patients with lesions to both prefrontal [Fasotti et al., 1992; Luria, 1966] and parietal cortex [Benson and Weir, 1972; Henschen, 1920; McCarthy and Warrington, 1988; Takayama et al., 1994; Warrington, 1982; Whalen et al., 1997] as well as subcortical structures including the thalamus [Ojemann, 1974]. More recently, brain imaging studies have identified a number of brain regions involved in performance of arithmetic tasks [Burbaud et al., 1995, 2000; Dehaene et al., 1999; Gruber et al., 2001; Rueckert et al., 1996]. Across these studies, activation is reported in both prefrontal and parietal areas. In particular, Menon et al. [Menon et al. 2000a,c] identified the angular gyrus as being a region specifically activated in response to increasing arithmetic complexity.
In the present study, subjects viewed arithmetic equations in the form “a + b = c” or a + c − b = d“ and were asked to judge whether the results were correct or not. We hypothesized that subjects with fraX would show significant impairment in performance on the task, particularly in the more difficult, 3‐operand equations. We also hypothesized that they would show significant deficits in activation of brain regions known to be involved in arithmetic processing—particularly, the inferior and middle frontal gyri, and the supramarginal and angular gyri of the parietal cortex, and that activation in these areas would be related to FMRP.
MATERIALS AND METHODS
Subjects, diagnosis, and molecular measures
Sixteen young female subjects with a diagnosis of fraX (range: 10.12–22.73 years; mean: 16.17 years) were recruited from throughout the US. Subjects were recruited through advertisements in national fraX newsletters, through prior clinical contacts, and through contact at national fraX conferences. The diagnosis of fraX was confirmed by DNA analysis. Standardized Southern blot and polymerase chain reaction (PCR) analyses were performed followed by FMR1‐specific probe hybridization [Oberle et al., 1991]. The CGG repeat number was calculated from the Southern blot autoradiogram images. FMRP levels were ascertained by calculating the percentage of peripheral lymphocytes containing FMRP using immunostaining techniques [Willemsen et al., 1995]. All subjects with fraX had the full mutation. Sixteen female unaffected subjects also participated (range: 10.85–22.67 years; mean: 16.97 years). The human subjects committee at the Stanford University School of Medicine approved all protocols used in this study, and all subjects (or their guardians) gave written informed consent.
Neuropsychological assessment
IQ was determined using the Wechsler Intelligence Scales. The Wechsler Intelligence Scale for Children, Third Edition (1991) was administered to those under 17 years of age, and the Wechsler Adult Intelligence Scale‐Third Edition (1997) was administered to those 17 years of age or older. The Digit Span, Arithmetic, and Coding subtests, present in both the WISC‐III and the WAIS‐III, were selected for analyses as behavioral measures of mathematical ability or working memory.
Math task experimental design
The experiment began with a 30‐sec rest epoch followed by six alternating 30‐sec epochs of “easy” (2‐operand equation) experimental trials and control trials. These six easy experimental epochs were followed by a second 30‐sec rest epoch. After the second rest there were six alternating 30‐sec epochs of “difficult” (3‐operand equation) experimental trials and control trials. After these six difficult experimental epochs was a third 30‐sec rest epoch. During the rest condition, subjects passively viewed a blank screen. Easy experimental epochs consisted of nine, 2‐operand addition or subtraction problems (randomly intermixed) with either a correct or an incorrect resultant (e.g., 1 + 2 = 3 or 5 − 2 = 4). Difficult experimental epochs consisted of nine, 3‐operand addition/subtraction problems with either a correct or an incorrect resultant (e.g., 6 − 3 + 5 = 8 or 6 + 2 − 3 = 4). All experimental and control stimuli were presented for 2,625 msec, with an ISI of 708 msec. Sixty‐six percent of the results were correct and required a button press and the other 34% were incorrect. Equal numbers of button presses were required for experimental and control trials. Of the incorrect‐resultant trials, half of the results were one more than the correct answer, and half were one less than the correct answer. During all experimental epochs the instructions “Push if Correct” were displayed for the entire length of the epoch. Subjects were instructed to respond with a key press only when the resultant of the math equation was correct. Control epochs for the blocks of easy experimental trials were comprised of nine stimuli each consisting of a string of five single digits. Control epochs for the blocks of difficult experimental trials were comprised of nine stimuli each consisting of a string of seven single digits. During the control epochs the instructions “Push for 0” was displayed the entire length of the epoch. Subjects were instructed to respond with a key press only when a zero appeared in the string of digits.
Behavioral data analysis
Percentage of correct responses, reaction time (RT) and false alarms were compared using an analysis of covariance (ANCOVA).
fMRI acquisition
Images were acquired on a 1.5 T GE Signa scanner with EchoSpeed gradients using a custom‐built whole head coil that provides a 50% advantage in signal to noise ratio over that of the standard GE coil [Hayes and Mathias, 1996]. A custom‐built head holder was used to prevent head movement. Eighteen axial slices (6 mm thick, 1 mm skip) parallel to the anterior and posterior commissure covering the whole brain were imaged with a temporal resolution of 2 sec using a T2* weighted gradient echo spiral pulse sequence (TR = 2,000 msec, TE = 40 msec, flip angle = 89° and 1 interleave) [Glover and Lai, 1998]. The field of view was 240 mm and the effective in‐plane spatial resolution was 3.75 mm. To aid in localization of functional data, high resolution T1 weighted spoiled grass gradient recalled (SPGR) 3D MRI sequence with the following parameters was used: TR = 24 msec; TE = 5 msec; flip angle = 40°; 24 cm field of view; 124 slices in sagittal plane; 256 × 192 matrix; acquired resolution = 1.5 × 0.9 × 1.2 mm. The images were reconstructed as a 124 × 256 × 256 matrix with a 1.5 × 0.9 × 0.9 mm spatial resolution. Structural and functional images were acquired in the same scan session.
The task was programmed using Psyscope [Cohen et al., 1993] on a Macintosh (Sunnyvale, CA) notebook computer. Initiation of scan and task was synchronized using a TTL pulse delivered to the scanner timing microprocessor board from a ‘CMU Button Box’ microprocessor (http://poppy.psy.cmu.edu/psyscope) connected to the Macintosh. Stimuli were presented visually at the center of a screen using a custom‐built magnet compatible projection system (Resonance Technology, CA).
Image preprocessing
Images were reconstructed, by inverse Fourier transform, for each of the 225 time points into 64 × 64 × 18 image matrices (voxel size: 3.75 × 3.75 × 7 mm). FMRI data were pre‐processed using SPM99 (http://www.fil.ion.ucl.ac.uk/spm). Images were corrected for movement using least square minimization without higher‐order corrections for spin history, and normalized to stereotaxic Talairach coordinates [Talairach and Tournoux, 1988]. Images were then resampled every 2 mm using sinc interpolation and smoothed with a 4 mm Gaussian kernel to decrease spatial noise.
Statistical analysis
Statistical analysis was performed on individual and group data using the general linear model and the theory of Gaussian random fields as implemented in SPM99 [Friston et al., 1995]. This method takes advantage of multivariate regression analysis and corrects for temporal and spatial autocorrelations in the fMRI data. Activation foci were superposed on high‐resolution T1‐weighted images and their locations interpreted using known neuroanatomical landmarks [Duvernoy and Bourgouin, 1999; Mai et al., 1997].
In the first step, a within‐subjects procedure was used to model all the effects of interest, covariates and nuisance variables for each subject. The individual subject models were identical across subjects (i.e., a balanced design was used). Confounding effects of fluctuations in global mean were removed by proportional scaling where, for each time point, each voxel was scaled by the global mean at that time point. Low frequency noise was removed with a high pass filter (0.5 cycles/min) applied to the fMRI time series at each voxel. A temporal smoothing function (Gaussian kernel corresponding to dispersion of 8 sec) was applied to the fMRI time series to enhance the temporal signal to noise ratio. We then defined the effects of interest for each subject with the relevant contrasts of the parameter estimates. For each of these contrasts, a corresponding contrast image was also generated. Voxel‐wise t‐statistics were normalized to Z‐scores to provide a statistical measure of activation that is independent of sample size. Finally, the t‐statistics were normalized to Z‐scores, and significant clusters of activation were determined using the joint expected probability distribution of height and extent of Z‐scores [Poline et al., 1997], with height (Z > 2.33; P < 0.01) and extent thresholds (P < 0.05).
Group analysis was performed using a random‐effects model that incorporated a two‐stage hierarchical procedure. This model estimates the error variance for each condition of interest across subjects, rather than across scans [Holmes and Friston, 1998] and therefore provides a stronger generalization to the population from which data are acquired. This analysis proceeded in two steps. In the first step, contrast images for each subject and each effect of interest were generated as described above. In the second step, these contrast images were analyzed using a general linear model to determine voxel‐wise t‐statistics. One contrast image was generated per subject, per effect of interest (e.g., 2‐operand condition, minus the control condition). A one‐way t‐test was then used to determine group activation for each effect. The following contrast images were calculated for each subject: 1) 2‐operand − control; 2) 3‐operand − control; and 3) 3‐operand − 2‐operand. For both within‐ and between‐group comparisons, we used a cluster‐wise (corrected) significance level of P = 0.01.
RESULTS
Wechsler IQ scales
The full‐scale IQ scores of the fraX sample ranged from 52–108 with a mean score of 83.63. The mean of this group is just over one standard deviation (SD) below the scaled mean of the Wechsler tests. Only two subjects had an IQ below 70. In comparison, the unaffected group full‐scale IQ scores ranged from 99–142 with a mean score of 122.69, which is more than one SD above the scaled mean. The difference between these group means was statistically significant (t = 8.20, P < 0.001). The group differences on Verbal and Performance IQ Scores were consistent and similar to the full‐scale IQ scores. The fraX group was roughly one SD below the scaled mean of the test on VIQ and PIQ (mean = 85.31 and 85.00, respectively) and the unaffected group was more than one standard deviation above the scaled mean on VIQ and PIQ (mean = 122.63 and 117.94, respectively). Group differences were significant for both VIQ (t = 7.90, p < 0.001) and PIQ (t = 6.74, P < 0.001).
Wechsler subtests
Three Wechsler subtests were selected as behavioral measures of mathematical ability or working memory: Arithmetic, Digit Span, and Coding. Two of these subtests (i.e., Arithmetic and Digit Span) use auditory stimuli whereas the other uses visually perceived stimuli. Independent Samples t‐tests were conducted to measure group differences. On Arithmetic, the fraX group had a mean scaled score of 5.44 (SD 2.61) and the unaffected group had a mean scaled score of 13.25 (SD 3.30), t = 7.436, P < 0.001. On Digit Span, the fraX group had a mean scaled score of 6.50 (SD 2.80) and the unaffected group had a mean scaled score of 10.75 (SD 3.21), t = 3.985, P < 0.001. On Coding, the fraX group had a mean scaled score of 8.31 (SD 3.82) and the unaffected group had a mean scaled score of 13.31 (SD 2.94), t = 4.147, P < 0.001. Thus, regardless of the type of stimuli, the group differences were significant on all three subtests.
Behavioral performance
Performance data from the tasks were not analyzed for four of the 16 subjects with fraX, and for one of the 16 unaffected subjects. For the unaffected subject and two of the subjects with fraX, performance data were not recorded due to a response box malfunction. For the other two subjects with fraX, performance data were not used because their responses on the experimental trials of the second half of the experiment (when the task difficulty increased due to the introduction of 3‐operand equations) were too few to reliably calculate performance. Because unaffected and fraX groups differed significantly in IQ, FSIQ was used as a covariate in all behavioral performance analyses described below. There was a statistically significant correlation between FSIQ and percent correct on the 3‐operand equations for combined group samples (Spearman R = 0.76, P < 0.001). When examined separately, however, a marginally significant correlation was seen between FSIQ and percent correct on 3‐operand equations in the fraX group (R = 0.57, P = 0.054) but not in the unaffected group (R = 0.32, P = 0.247). No significant correlations were observed between IQ and performance on the 2‐operand equations.
Mean accuracy, reaction times (RTs) and false alarms for the two experimental conditions were analyzed separately, using analysis of covariance (ANCOVA) with a between‐subjects factor of Group (fraX, unaffected) and a within‐subjects factor of difficulty (2‐operand, 3‐operand equations). Full scale IQ (FSIQ) was used as a covariate.
The analysis of accuracy revealed a significant main effect of Difficulty, F(1,25) = 41.15, P < 0. 0001. In addition, there emerged a significant Group × Difficulty interaction F(1,25) = 14.99, P < 0.001 (Fig. 1). When examined separately, subjects with fraX showed a significant decrease in performance from 2 to 3 operands, F(1,11) = 50.06, P < 0. 0001; whereas unaffected subjects did not, F(1,14) = 3.50, P = 0.082.
Figure 1.
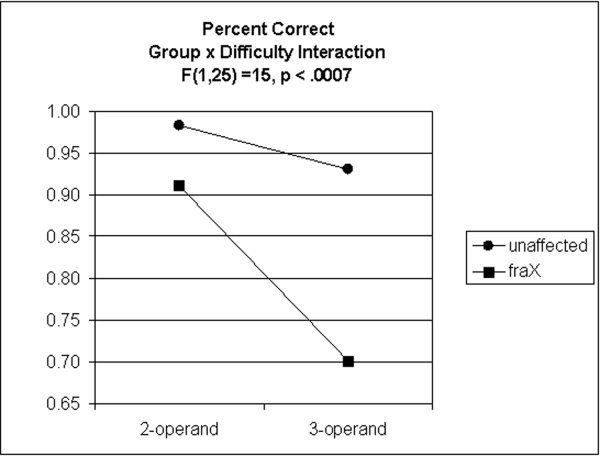
Percent correct on 2‐ and 3‐operand arithmetic equations for unaffected subjects and subjects with fraX.
The analysis of RT revealed a significant main effect of Difficulty, F(1,25) = 86.36, P < 0. 0001. This main effect was due to the fact that RT was, on average, faster for the 2‐operand (M = 1,344.16 msec) than for the 3‐operand (M = 2,091.03 msec) equations. Neither the main effect of Group nor the Group × Difficulty interaction was significant for the analysis of RT.
The analysis of false alarms revealed no significant main effects or interactions.
Brain activation, within‐group comparisons
2‐Operand activation
In the 2‐operand trials compared to the control trials, unaffected subjects showed significant activation in the right middle frontal gyrus (MFG); bilateral insular/orbitofrontal gyrus; left inferior frontal gyrus (IFG); bilateral superior frontal gyrus (SFG), bilateral angular gyrus (ANG), left superior parietal lobe (SUPAR), left temporal/parieto‐occipital junction and right middle occipital gyrus (Fig. 2a.).
Figure 2.

Brain areas that show significantly greater activation during 2‐operand arithmetic equations for (a) unaffected subjects and (b) subjects with fraX; and during 3‐operand arithmetic equations for (c) unaffected subjects and (d) subjects with fraX. All activations reported were significant after height (Z > 2.33; P < 0.01) and extent (P < 0.01) thresholding.
On this same contrast, subjects with fraX showed significant activation bilaterally in the MFG, left premotor, bilateral insular/orbitofrontal gyrus, left IFG; bilateral SFG; left inferior temporal gyrus (ITG), left fusiform gyrus, left ANG, left middle occipital gyrus, and left cerebellum (Fig. 2b).
3‐Operand activation
In the 3‐operand trials compared to the control trials, unaffected subjects showed significant activation bilaterally in MFG and SFG, right insular/orbitofrontal gyrus, bilateral ANG, left superior, middle and inferior occipital gyri, and left lingual and fusiform gyri (Fig. 2c).
On this same contrast, subjects with fraX showed significant activation in the left MFG, IFG, SFG, and ANG, as well as left intraparietal sulcus and middle cerebellum (Fig. 2d).
In both the 2‐ and 3‐operand contrasts, the voxel extent (i.e., size of the clusters of activation) was much greater for the unaffected subjects than for the subjects with fraX (Table I).
Table I.
Brain areas showing significantly greater activation during two types of experimental trials (2‐ and 3‐operand arithmetic equations), compared to control trials, in unaffected subjects and subjects with fraX*
| Comparison | Area | Corrected P‐value | Number of voxels in cluster | Z max | Peak coordinates |
|---|---|---|---|---|---|
| Unaffected: 2‐operand − control | |||||
| L ANG (BA 39) | 0.000 | 2071 | 5.70 | −44−44 44 | |
| L SUPAR | 4.40 | −24−80 42 | |||
| R ANG | 0.000 | 2054 | 5.34 | 30−74 28 | |
| Middle occipital gyrus | 4.64 | 42−56 52 | |||
| L orbitofrontal/insular gyrus | 0.000 | 2568 | 5.20 | −38 22 0 | |
| IFG | 4.85 | −46 28 26 | |||
| R SFG | 0.000 | 891 | 5.13 | 8 14 46 | |
| L SFG | 4.27 | −8 14 52 | |||
| L temp/pariet/occip junction | 0.000 | 1873 | 4.68 | −46−56−14 | |
| Fusiform gyrus | 4.30 | −4−90 −4 | |||
| R MFG | 0.001 | 603 | 4.01 | 44 44 32 | |
| R orbitofrontal gyrus | 3.77 | 44 12 4 | |||
| fraX: 2‐operand − control | |||||
| R SFG | 0.024 | 228 | 4.58 | 2 14 64 | |
| L SFG | 3.21 | 2 30 56 | |||
| R MFG | 0.000 | 686 | 4.47 | 50 36 26 | |
| L ANG | 0.000 | 874 | 4.42 | −36−56 48 | |
| Middle occipital gyrus | 3.57 | −32−74 28 | |||
| L MFG | 0.000 | 559 | 4.18 | −44 18 30 | |
| Premotor cortex | 3.52 | −52 4 52 | |||
| L orbitofrontal gyrus | 0.015 | 248 | 4.13 | −50 44 −6 | |
| L MFG | 3.43 | −54 36 16 | |||
| L IFG | 2.68 | −52 38 6 | |||
| L ITG | 0.001 | 386 | 4.10 | −50−58−16 | |
| L Fusiform gyrus | 3.79 | −34−48−22 | |||
| L cerebellum | 3.65 | −42−54−34 | |||
| R insular cortex | 0.003 | 310 | 3.32 | 30 12 −4 | |
| R orbitofrontal gyrus | 3.24 | 34 28 0 | |||
| Unaffected: 3‐operand − control | |||||
| L ANG (BA 39) | 0.000 | 7809 | 5.86 | −24−74 50 | |
| L inferior occipital | 5.58 | −42−70−18 | |||
| L lingual/fusiform | 5.40 | −44−60−14 | |||
| R ANG/SMG (BA 39/40) | 0.000 | 2808 | 5.48 | 44−46 46 | |
| L SFG | 0.000 | 11639 | 5.47 | −2 14 58 | |
| L MFG (BA 45) | 4.88 | −42 0 40 | |||
| R SFG/MFG (BA ?/45) | 4.42 | 26 −2 58 | |||
| R MFG (BA 45) | 0.000 | 2406 | 4.54 | 48 8 22 | |
| R insular/orbitofrontal | 0.004 | 435 | 4.23 | 30 24 6 | |
| fraX: 3‐operand − control | |||||
| L ANG | 0.004 | 341 | 4.09 | −38−60 42 | |
| L intraparietal sulcus | 3.73 | −32−54 46 | |||
| L SFG | 0.013 | 287 | 3.90 | −20 2 68 | |
| L MFG (BA 45) | 3.65 | −30 10 48 | |||
| R SFG | 0.000 | 828 | 3.77 | −10 26 50 | |
| L Cerebellum | 0.051 | 222 | 3.69 | −32−60−28 | |
| L MFG (BA 45) | 0.000 | 479 | 3.55 | −40 12 28 | |
| L IFG | 3.44 | −48 18 28 |
For each significant cluster, region of activation, cluster‐level significance level, number of voxels activated, maximum Z‐score and location of peak are shown.
All within‐group fMRI analyses also were conducted omitting the five subjects (one unaffected and four subjects with fraX) for whom behavioral data was not analyzable. These analyses yielded a very similar pattern of results as when the subjects were included. For the 2‐operand trials, unaffected subjects (n = 15) showed significant activation in right MFG, bilateral orbitofrontal, left IFG and precentral gyrus, bilateral SFG and ANG, and left lingual and fusiform gyrus. On this same contrast, subjects with fraX (n = 12) showed significant activation bilaterally in the MFG, right middle temporal gyrus (MTG), and left ANG and cerebellum. For the 3‐operand trials, unaffected subjects showed significant activation bilaterally in MFG, SFG and ANG, left superior, middle and inferior occipital gyri, and left lingual and fusiform gyri. On this same contrast, subjects with fraX showed significant activation bilaterally in the MFG, and left SFG, MTG and ANG, as well as left intraparietal sulcus (ata not shown).
Brain activation, between‐group comparisons
3‐Operand minus 2‐operand activation
In an effort to determine the interaction between group and task difficulty (i.e., differences in activation between the two groups as the task becomes more difficult), we compared activation on the 3‐operand trials with activation on the 2‐operand trials and subtracted fraX subjects' activation from unaffected subjects' activation (and vice‐versa). In these comparisons, FSIQ was used as a nuisance covariate in an effort to minimize any differences in activation that may be attributable to the IQ difference between the groups.
As the task difficulty increased, unaffected subjects exhibited significantly more activation than fraX in the left SFG, bilateral motor cortex, bilateral SUPAR, right intraparietal sulcus, left ANG, left fusiform gyrus and left middle occipital gyrus (height threshold, P < 0.01, extent threshold, P < 0.05) (Fig. 3). Because we had a priori hypotheses (based on previous studies) about where activation would occur during these tasks, we were also able to use a voxel‐wise (uncorrected) significance threshold to examine clusters of activation in those areas included in our directed hypotheses. Using this criteria and a significance level of P < 0.01, the right MFG and left cerebellum also emerged as regions where unaffected subjects showed greater activation than subjects with fraX as task difficulty increased. By contrast, there were no brain regions where subjects with fraX exhibited significantly more activation than unaffected subjects (Table II).
Figure 3.

Brain areas that show significantly greater activation for unaffected subjects than subjects with fraX during 3‐operand, compared to 2‐operand arithmetic equations.
Table II.
Brain areas where control subjects show significantly greater activation than subjects with fraX during 3‐operand, compared to 2‐operand trials*
| Comparison | Area | Corrected P‐value | Number of voxels in cluster | Z max | Peak coordinates |
|---|---|---|---|---|---|
| Unaffected − fraX: 3‐operand − 2‐operand | R motor cortex (BA 4) | 0.000 | 1657 | 4.09 | 18−28 72 |
| R SUPAR | 3.94 | 28−28 44 | |||
| R intraparietal sulcus | 3.86 | 28−42 36 | |||
| L middle occipital sulcus | 0.000 | 432 | 3.96 | −40−52 2 | |
| L ANG | 4.06 | −38−62 2 | |||
| L fusiform gyrus | 0.006 | 325 | 4.18 | −34−40 −6 | |
| L SFG | 0.000 | 445 | 3.82 | −20 −2 60 | |
| L precentral gyrus | 3.73 | −42−16 38 | |||
| L SUPAR | 0.001 | 296 | 3.49 | −22−54 40 | |
| L SUPAR | 0.001 | 447 | 3.35 | −10−48 60 | |
| L motor cortex | 3.34 | −36−28 42 | |||
| R MFGa | 0.013b | 101 | 3.82 | 30 16 44 | |
| L cerebelluma | 0.048b | 57 | 3.66 | −6−62−38 | |
| FraX − Unaffected: 3‐operand − 2‐operand | No suprathreshold voxels |
For each significant cluster, region of activation, cluster‐level significance level, number of voxels activated, maximum Z‐score and location of peak are shown.
At the uncorrected level.
Uncorrected P‐value.
Relationship between brain activation and protein level in subjects with fraX
One goal of the present study was to assess whether activation in areas related to arithmetic processing is related to amount of FMR1 protein expression in subjects with fraX. To investigate this proposed association, we used level of FMR1 protein expression (as estimated by measuring the proportion of blood cells containing FMRP) as a covariate of interest to identify those brain areas in which activation increased as a function of FMRP. Age was used as a nuisance covariate because of evidence of differential cell selection in the blood across the lifespan (for those cells that have active normal X chromosomes, and thus produce FMRP [Rousseau et al., 1991]).
2‐Operand activation
In the 2‐operand trials, compared to the control trials, the brain areas in which activation increased as FMRP increased were: right orbitofrontal and MFG, bilateral cingulate cortex, left pre‐supplementary motor area (pre‐SMA), and left cerebellum. Brain activation correlated with FMRP was much more diffuse in this contrast than for the 3‐operand analysis (Fig. 4a).
Figure 4.

Brain areas that show, for subjects with fraX, a significant correlation between FMRP and brain activation for (a) 2‐operand and (b) 3‐operand arithmetic equations.
3‐Operand activation
In the 3‐operand trials, compared to the control trials, the brain areas in which activation increased as FMRP increased were: bilateral MFG, left IFG, right postcentral gyrus, right SFG, left motor/premotor cortex, and left caudate (Fig. 4b). We also used a voxel‐wise (uncorrected) significance threshold to examine clusters of activation in areas included in our directed hypotheses. At this threshold, a significant cluster was also observed in the left SPMG/ANG (Table III).
Table III.
Brain areas where subjects with fraX show a positive correlation between brain activation and FMRP during 2‐operand and 3‐operand trials, compared to control trials*
| Comparison: Correlation between FMRP and activation | Area | Corrected P‐value | Number of voxels in cluster | Z max | Peak coordinates |
|---|---|---|---|---|---|
| 2‐operand − control | |||||
| L Cingulate | 0.000 | 22668 | 4.87 | −16−10 46 | |
| R cingulate gyrus | 4.78 | 22 4 40 | |||
| Pre‐SMA | 4.71 | −20 −2 56 | |||
| R orbitofrontal gyrus | 0.009 | 242 | 3.75 | 18 28−18 | |
| R MFG | 3.29 | 14 24 −8 | |||
| L cerebellum | 0.049 | 180 | 3.92 | −18−50−36 | |
| 3‐operand − control | |||||
| L motor cortex | 0.000 | 819 | 4.44 | −52−10 42 | |
| L MFG | 4.16 | −54 −2 34 | |||
| L MFG | 0.002 | 357 | 4.44 | −50 38 20 | |
| L IFG | 3.90 | −50 40 −2 | |||
| L MFG | 3.02 | −42 38 −6 | |||
| L Caudate | 0.001 | 424 | 3.68 | −20 2 26 | |
| Cingulate gyrus | 3.52 | 0 2 28 | |||
| R postcentral gyrs | 0.000 | 973 | 3.27 | 8−32 68 | |
| R SFG | 3.26 | 20 −2 50 | |||
| R MFG | 0.029 | 238 | 3.21 | 28 −6 40 | |
| L SPMG/ANGa | 0.001b | 168 | 3.26 | −48−46 42 |
For each significant cluster, region of activation, cluster‐level significance level, number of voxels activated, maximum Z‐score and location of peak are shown.
At the uncorrected level.
Uncorrected P‐value.
DISCUSSION
Subjects with fraX were found to be significantly impaired in their performance on 3‐operand arithmetic equations with respect to 2‐operand equations, and with respect to unaffected subjects. Although unaffected subjects' performance on 3‐operand equations declined slightly from that of the 2‐operand, this within‐group difference was not statistically significant. Performance differences between subjects with fraX and unaffected subjects were observed after covarying for IQ, suggesting that the poor arithmetic performance in the subjects with fraX was not due to a global IQ deficiency. This profile is in agreement with several studies reporting particular impairments in arithmetic processing in persons with fraX [Brainard et al., 1991; Grigsby et al., 1990; Kemper et al., 1986; Miezejeski et al., 1986].
We further attempted to characterize the neural substrates of this decreased arithmetic performance in the fraX group. Within‐group comparisons of brain activation on the task revealed significant activation bilaterally in the prefrontal and parietal cortices for unaffected subjects in both the 2‐operand and the 3‐operand trials. Subjects with fraX showed significant activation in bilateral prefrontal cortices and in the left angular gyrus for both the 2‐ and 3‐operand trials. The activation sites for both groups fall squarely within areas known to be classically involved in arithmetic processing in non‐impaired populations [Burbaud et al., 1995; Dehaene et al., 1999; Gruber et al., 2001; Menon et al., 2000a,c; Rickard et al., 2000]; however, activation patterns differed between the two groups in two important ways. First, the unaffected subjects exhibited more overall activation than subjects with fraX in both types of trials. Second, unlike the unaffected group, subjects with fraX did not show increased extent of activation in association with greater task difficulty. In fact, subjects with fraX showed a slightly greater left ANG activation in the 2‐operand equations than the 3‐operand equations (see Fig. 2).
To ensure that those subjects for whom behavioral data was not analyzable did not unduly influence these results (of particular concern being the two subjects with fraX whose button pressing on the experimental trials became infrequent with the introduction of the 3‐operand trials) the fMRI analyses were conducted with all of those subjects removed. The same general pattern of activation emerged for both groups and both trial types.
To determine the “Group × Difficulty” interaction, we subtracted activation associated with the 2‐operand equations from activation associated with the 3‐operand equations, and then compared this contrast across the two groups. Because there was a significant difference in IQ between the two groups, FSIQ was used as a nuisance covariate in an effort to minimize any differences in activation that may be attributable this IQ difference. In both left and right prefrontal, motor and parietal cortices, unaffected subjects increase activation in response to increased task difficulty more than do subjects with fraX. These areas have previously been found to be associated with arithmetic processing on this [Menon et al., 2000a,c] and similar tasks [Burbaud et al., 1995; Dehaene et al., 1999; Rickard et al., 2000]. By contrast, there were no areas where subjects with fraX recruited more activation that unaffected subjects in association with increased task difficulty. Thus, although subjects with fraX perform significantly worse on 3‐operand arithmetic calculations, they do not show a corresponding increase in activation in expected brain regions, as do unaffected subjects. These group differences appear to reflect a deficiency in recruitment of neural resources for arithmetic processing in subjects with fraX.
It is difficult to say, with these data alone, whether this differential pattern of brain activation between fragile X and unaffected subjects is specific to arithmetic processing, or whether it belies a more general cognitive processing deficit in subjects with fragile X. Indeed, many of the brain areas reported here are not unique to arithmetic processing, but show up across a number of functional imaging tasks [see Gruber et al., 2001]. Studies that examined differences in brain activation between subjects with fraX and unaffected controls on a visuospatial working memory task [Kwon et al., 2001; Menon et al., 2000b], however, show differential activation patterns that are unlike those reported here. This suggests that the present findings are specific to the task at hand, and not a “signature” of generalized processing deficits in these subjects.
A growing body of research now suggests that FMRP plays a critical role in both the development and functioning of the human brain [Abrams et al., 1999; Kaufmann et al., 1999; Kwon et al., 2001; Menon et al., 2000b; Tassone et al., 1999]. In persons with fraX, abnormal morphology of dendritic spines and a reduction in the length of synapses in the cortex have been found to be associated with low levels of FMRP [Hinton et al., 1991; Rudelli et al., 1985]. This synaptic malfunction may result in a functional system not being able to recruit a sufficient number of neurons, leading to weaker overall activation for a given cognitive task. Recent studies [Kwon et al., 2001; Menon et al., 2000b] report significant correlations between FMRP and activation in dorsolateral prefrontal cortex and parietal cortex regions during a visuospatial working memory (“2‐back”) task in subjects with fraX. Here, we were interested in whether FMRP would be related to brain activation, particularly in those regions associated with arithmetic processing. Although we use an indicator of FMRP based on blood samples, research shows that leukocyte‐based molecular measures of FMR1 provide a good indicator of FMR1 expression in the brain [Abrams et al., 1999; Tassone, 1999; Willemsen et al., 2000].
As hypothesized, with increasing levels of FMRP, subjects with fraX showed more activation during the 3‐operand trials in bilateral prefrontal, bilateral motor/premotor, and left SUPMG/ANG, all areas that have been reported previously as being involved in arithmetic processing in typically‐developing subjects [Burbaud et al., 1995; Dehaene et al., 1999; Menon et al., 2000a,c; Rickard et al., 2000]. Thus, these data directly suggest that decreased FMR1 protein expression underlies deficits in arithmetic performance that are reported frequently in persons with fraX.
Activation also correlated with FMRP in the 2‐operand trials, but the pattern was less focal than in the 3‐operand trials. In this contrast, activation was diffusely distributed across bilateral frontal and parietal areas as well as cingulate gyrus. This marked difference in correlated activation patterns for the 3‐ vs. the 2‐operand trials suggests that FMRP is related to efficient recruitment of neural resources to perform this arithmetic task, but only for those trials for which processing is less “automated.” As noted above, subjects with fraX only made significantly more response errors than control subjects on the 3‐operand trials, and not on the less‐difficult 2‐operand trials. It follows that more focal activation would be observed in brain regions related to arithmetic processing when subjects are forced to do actual arithmetic computations than when they are able to call upon instant solutions from memory, as is much more likely to be the case in the 2‐operand trials. The fact that this increase of focal activation for the 3‐operand over the 2‐operand trials was not present in the fraX group before using FMRP as a covariate underscores the significance of FMR1 gene expression in the cognitive functioning of this population.
It also is important to note that FMRP, in itself, was not correlated with IQ in our sample, either before (r = 0.119, P = 0.66) or after (r = 0.000, P = 1.0) the effects of age were removed. Thus, the pattern reported here, of increased brain activation with increasing FMRP, is not attributable to a simple relationship between increased activation in arithmetic‐related brain regions and an increase in general intelligence.
FMRP was not correlated with performance (i.e., percent correct, reaction time or false alarms) on the trials. This lack of correlation could be due to the fact that there were relatively few subjects with fraX for whom performance data was available (n = 12). It is possible that with a larger sample of subjects with fraX, a correlation between FMRP and behavioral performance would emerge. Furthermore, it is possible that a parallel correlation between FMRP and task performance was not observed because the relationship between brain activation and performance is not straightforward. There may be complex functional interactions between brain regions, which remain to be explored.
The present study presents the first attempt at characterizing the neural underpinnings of the well‐described arithmetic deficits associated with fraX syndrome. The behavioral findings of significantly decreased calculation performance in the subjects studied here corroborate well with previous studies, and the imaging results help formulate a brain‐based model for understanding the mechanisms behind the deficit. Furthermore, the finding of a correlation between FMRP and brain activation during arithmetic processing helps to further articulate the relationship between this single gene defect and higher cognitive functioning in persons with fraX. Future work in our laboratory will extend this research to males with fraX, and attempt to further tease apart the complex differences in network activation observed between this population and both typically and atypically developing children and young adults.
Acknowledgements
We thank A.K. Taylor and Kimball Genetics, Inc., for providing FMRP analyses.
REFERENCES
- Abrams MT, Kaufmann WE, Rousseau F, Oostra BA, Wolozin B, Taylor CV, Lishaa N, Morel ML, Hoogeveen A, Reiss AL (1999): FMR1 gene expression in olfactory neuroblasts from two males with fragile X syndrome. Am J Med Genet 82: 25–30. [DOI] [PubMed] [Google Scholar]
- Baumgardner TL, Green KE, Reiss AL (1994): A behavioral neurogenetics approach to developmental disabilities: gene–brain‐behavior associations. Curr Opin Neurol 7: 172–178. [DOI] [PubMed] [Google Scholar]
- Benson DF, Weir WF (1972): Acalculia: acquired anarithmetia. Cortex 8: 465–472. [DOI] [PubMed] [Google Scholar]
- Brainard SS, Schreiner RA, Hagerman RJ (1991): Cognitive profiles of the carrier fragile X woman. Am J Med Genet 38: 505–508. [DOI] [PubMed] [Google Scholar]
- Burbaud P, Degreze P, Lafon P, Franconi JM, Bouligand B, Bioulac B, Caille JM, Allard M (1995): Lateralization of prefrontal activation during internal mental calculation: a functional magnetic resonance imaging study. J Neurophysiol 74: 2194–2200. [DOI] [PubMed] [Google Scholar]
- Cohen JD, MacWhinney B, Flatt M, Provost J (1993): PsyScope: a new graphic interactive environment for designing psychology experiments. Behav Res Methods Instrum Comput 25: 257–271. [Google Scholar]
- Dehaene S, Spelke E, Pinel P, Stanescu R, Tsivkin S (1999): Sources of mathematical thinking: behavioral and brain‐imaging evidence. Science 284: 970–974. [DOI] [PubMed] [Google Scholar]
- Duvernoy HM, Bourgouin P (1999): The human brain: surface, three‐dimensional sectional anatomy with MRI, and blood supply. 2nd Ed. New York: Springer. [Google Scholar]
- Fasotti L, Eling PA, Bremer JJ (1992): The internal representation of arithmetical word problem sentences: frontal and posterior‐injured patients compared. Brain Cogn 20: 245–263. [DOI] [PubMed] [Google Scholar]
- Freund LS, Reiss AL (1991): Cognitive profiles associated with the fra(X) syndrome in males and females. Am J Med Genet 38: 542–547. [DOI] [PubMed] [Google Scholar]
- Friston KJ, Holmes A, Worsley J‐P, Poline CD, Frith CD, Frackowiak RSJ (1995): Statistical parametric maps in functional imaging: a general linear approach. Hum Brain Mapp 2: 189–210. [Google Scholar]
- Glover GH, Lai S (1998): Self‐navigated spiral fMRI: interleaved versus single‐shot. Magn Reson Med 39: 361–368. [DOI] [PubMed] [Google Scholar]
- Grigsby JP, Kemper MB, Hagerman RJ, Myers CS (1990): Neuropsychological dysfunction among affected heterozygous fragile X females. Am J Med Genet 35: 28–35. [DOI] [PubMed] [Google Scholar]
- Gruber O, Indefrey P, Steinmetz H, Kleinschmidt A (2001): Dissociating neural correlates of cognitive components in mental calculation. Cereb Cortex 11: 350–359. [DOI] [PubMed] [Google Scholar]
- Hayes C, Mathias C (1996): Improved brain coil for fMRI and high resolution imaging. Presented at the ISMRM 4th Annual Meeting Proceedings, New York.
- Henschen S (1920): Klinische und anatomische beitraege sur pathologie des Gehirns Vol. 5 Stockholm: Nordiska Bokhandeln. [Google Scholar]
- Hinton VJ, Brown WT, Wisniewski K, Rudelli RD (1991): Analysis of neocortex in three males with the fragile X syndrome. Am J Med Genet 41: 289–294. [DOI] [PubMed] [Google Scholar]
- Holmes AP, Friston KJ (1998): Generalisability, random effects, and population inference. Neuroimage 7: S754. [Google Scholar]
- Kaufmann WE, Abrams MT, Chen W, Reiss AL (1999): Genotype, molecular phenotype, and cognitive phenotype: correlations in fragile X syndrome. Am J Med Genet 83: 286–295. [PubMed] [Google Scholar]
- Kemper MB, Hagerman RJ, Ahmad RS, Mariner R (1986): Cognitive profiles and the spectrum of clinical manifestations in heterozygous fra (X) females. Am J Med Genet 23: 139–156. [DOI] [PubMed] [Google Scholar]
- Kwon H, Menon V, Eliez S, Warsofsky IS, White CD, Dyer‐Freedman J, Taylor AK, Glover GH, Reiss AL (2001): Functional neuroanatomy of visuospatial working memory in fragile X syndrome: relation to behavioral and molecular measures. Am J Psychiatry 158: 1040–1051. [DOI] [PubMed] [Google Scholar]
- Luria AR (1966): The higher cortical functions in man. New York: Basic Books. [Google Scholar]
- Mai JK, Assheuer J, Paxinos G (1997): Atlas of the human brain. London: Academic Press. [Google Scholar]
- Mazzocco MM, Pennington BF, Hagerman RJ (1993): The neurocognitive phenotype of female carriers of fragile X: additional evidence for specificity. J Dev Behav Pediatr 14: 328–335. [PubMed] [Google Scholar]
- McCarthy RA, Warrington EK (1988): Evidence for modality‐specific meaning systems in the brain. Nature 334: 428–430. [DOI] [PubMed] [Google Scholar]
- Menon V, Kwon H, Eliez S, Taylor AK, Reiss AL (2000a): Functional brain activation during cognition is related to FMR1 gene expression. Brain Res 877: 367–370. [DOI] [PubMed] [Google Scholar]
- Menon V, Rivera SM, White CD, Eliez S, Glover GH, Reiss AL (2000b): Functional optimization of arithmetic processing in perfect performers. Brain Res Cogn Brain Res 9: 343–345. [DOI] [PubMed] [Google Scholar]
- Menon V, Rivera SM, White CD, Glover GH, Reiss AL (2000c): Dissociating prefrontal and parietal cortex activation during arithmetic processing. Neuroimage 12: 357–365. [DOI] [PubMed] [Google Scholar]
- Miezejeski CM, Jenkins EC, Hill AL, Wisniewski K, French JH, Brown WT (1986): A profile of cognitive deficit in females from fragile X families. Neuropsychologia 24: 405–409. [DOI] [PubMed] [Google Scholar]
- Oberle I, Rousseau F, Heitz D, Kretz C, Devys D, Hanauer A, Boue J, Bertheas MF, Mandel JL (1991): Instability of a 550‐bp DNA segment and abnormal methylation in fragile X syndrome. Science 252: 1097–1102. [DOI] [PubMed] [Google Scholar]
- Ojemann GA (1974): Mental arithmetic during human thalamic stimulation. Neuropsychologia 12: 1–10. [DOI] [PubMed] [Google Scholar]
- Poline JB, Worsley KJ, Evans AC, Friston KJ (1997): Combining spatial extent and peak intensity to test for activations in functional imaging. Neuroimage 5: 83–96. [DOI] [PubMed] [Google Scholar]
- Rickard TC, Romero SG, Basso G, Wharton C, Flitman S, Grafman J (2000): The calculating brain: an fMRI study. Neuropsychologia 38: 325–335. [DOI] [PubMed] [Google Scholar]
- Rousseau F, Heitz D, Oberle I, Mandel JL (1991): Selection in blood cells from female carriers of the fragile X syndrome: inverse correlation between age and proportion of active X chromosomes carrying the full mutation. J Med Genet 28: 830–836. [DOI] [PMC free article] [PubMed] [Google Scholar]
- Rudelli RD, Brown WT, Wisniewski K, Jenkins EC, Laure‐Kamionowska M, Connell F, Wisniewski HM (1985): Adult fragile X syndrome. Clinico‐neuropathologic findings. Acta Neuropathol 67: 289–295. [DOI] [PubMed] [Google Scholar]
- Rueckert L, Lange N, Partiot A, Appollonio I, Litvan I, Le Bihan D, Grafman J (1996): Visualizing cortical activation during mental calculation with functional MRI. Neuroimage 3: 97–103. [DOI] [PubMed] [Google Scholar]
- Takayama Y, Sugishita M, Akiguchi I, Kimura J (1994): Isolated acalculia due to left parietal lesion. Arch Neurol 51: 286–291. [DOI] [PubMed] [Google Scholar]
- Talairach J, Tournoux P (1988): Co‐planar stereotaxic atlas of the human brain. Three‐dimensional proportional system: an approach to cerebral imaging (translated by M. Rayport). New York: Thieme Medical Publishers, Inc. [Google Scholar]
- Tassone F, Hagerman RJ, Ikle DN, Dyer PN, Lampe M, Willemsen R, Oostra BA, Taylor AK (1999): FMRP expression as a potential prognostic indicator in fragile X syndrome. Am J Med Genet 84: 250–261. [PubMed] [Google Scholar]
- Turner G, Webb T, Wake S, Robinson H (1996): Prevalence of fragile X syndrome. Am J Med Genet 64: 196–197. [DOI] [PubMed] [Google Scholar]
- Warrington EK (1982): The fractionation of arithmetical skills: a single case study. Q J Exp Psychol A 34: 31–51. [DOI] [PubMed] [Google Scholar]
- Whalen J, McCloskey M, Lesser RP, Gorden B (1997): Localizing arithmetic processes in the brain: Evidence from a transient deficit during cortical stimulation. J Cogn Neurosci 9: 409–417. [DOI] [PubMed] [Google Scholar]
- Willemsen R, Mohkamsing S, de Vries B, Devys D, van den Ouweland A, Mandel JL, Galjaard H, Oostra B (1995): Rapid antibody test for fragile X syndrome. Lancet 345: 1147–1148. [DOI] [PubMed] [Google Scholar]
- Willemsen R, Olmer R, De Diego Otero Y, Oostra BA (2000): Twin sisters, monozygotic with the fragile X mutation, but with a different phenotype. J Med Genet 37: 603–604. [DOI] [PMC free article] [PubMed] [Google Scholar]