Abstract
Brain activity can be monitored non‐invasively by near‐infrared spectroscopy (NIRS), which has several advantages in comparison with other imaging methods, such as flexibility, portability, low cost and biochemical specificity. Moreover, patients and children can be repetitively examined. Therefore, the objective of the study was to test the feasibility of NIRS for the event‐related approach in functional brain activation studies with cognitive paradigms. Thus, changes in the concentration of oxy‐, deoxy‐, and total hemoglobin were measured by NIRS in 14 healthy subjects while performing a color–word matching Stroop task in an event‐related design. The hemodynamic response (increase in the concentration of oxy‐/total hemoglobin and decrease in the concentration of deoxy‐hemoglobin) was stronger during incongruent compared to congruent and neutral trials of the Stroop task in the lateral prefrontal cortex bilaterally. This stronger hemodynamic response was interpreted as a stronger brain activation during incongruent trials of the Stroop task, due to interference. A new method for NIRS data evaluation that enables the analysis of the hemodynamic response to each single trial is introduced. Each hemodynamic response was characterized by the parameters gain, lag and dispersion of a Gaussian function fitted by nonlinear regression. Specific differences between the incongruent and neutral condition were found for gain and lag. Further, these parameters were correlated with the behavioral performance. In conclusion, brain activity may be studied by NIRS using cognitive stimuli in an event‐related design. Hum. Brain Mapping 17:61–71, 2002. © 2002 Wiley‐Liss, Inc.
Keywords: near‐infrared spectroscopy, event‐related, Stroop
INTRODUCTION
Near‐infrared spectroscopy (NIRS) is a method that enables functional imaging of brain activity [Villringer and Chance, 1997]. It measures changes in the concentration of oxy‐hemoglobin (oxy‐Hb) and deoxy‐hemoglobin (deoxy‐Hb), as well as the changes in the redox state of cytochrome‐c‐oxidase (Cyt‐Ox) by their different specific spectra in the near‐infrared range between 700–1,000 nm. Due to neurovascular coupling [Gratton et al., 2001; Villringer and Dirnagl, 1995], brain activation leads to an increase in cerebral blood flow without a proportionate increase in oxygen consumption, and, consequently, to an increase in the concentration of oxy‐Hb and a decrease in the concentration of deoxy‐Hb [Villringer and Chance, 1997]. NIRS has several advantages in comparison with other imaging methods, such as flexibility, portability, low cost and biochemical specificity. Moreover, patients and children can be repetitively examined. Therefore, it might be useful to further establish NIRS as a method for functional imaging.
Event‐related approaches, which allow the analysis of events of the stimulation protocol whose duration is much shorter than the latency of the vascular response, are advantageous in studies with cognitive paradigms [Leung et al., 2000]. Former cognitive NIRS studies employed blocked designs with presentation of the stimulus for 1–10 min [Obrig and Villringer, 1997]. Only one recent NIRS study [Obrig et al., 2000] examined premotor potentials in a single trial design (Go/NoGo task) and showed a difference between the Go and NoGo condition with respect to the poststimulus undershoot of oxy‐Hb. Thus, Obrig et al. [2000] demonstrated the feasibility of the single trial approach for NIRS in a motor paradigm study.
The aim of our study was to examine the feasibility of NIRS for the event‐related approach in studies with cognitive paradigms. Therefore, changes in the concentration of oxy‐, deoxy‐ and total Hb as well as changes in the redox state of Cyt‐Ox were measured by NIRS during performance of a Stroop paradigm (Stroop [1935], color–word matching Stroop task modified according to Zysset et al. [2001]) in an event‐related design.
MATERIALS AND METHODS
Subjects
Fourteen healthy subjects participated in the study (right‐handed, mean age 23.9 ± 3.1 years [range 19–29 years], 8 women, 6 men). Written informed consent was obtained from all subjects after complete description of the study to the subjects before the session. The research protocol was approved by the ethics committee at the University of Leipzig, and was in accordance with the latest version of the Declaration of Helsinki. All subjects had normal or corrected‐to‐normal vision, normal color vision and were native German speakers. No subject had a history of neurological, major medical or psychiatric disorders; none were taking medication at the time of measurement.
Psychophysical procedures
The color–word matching Stroop task [Stroop, 1935; Treisman and Fearnley, 1969; Zysset et al., 2001] was used in an event‐related version. Two rows of letters appeared on the screen and subjects were instructed to decide, whether the color of the top row letters corresponded to the color name written on the bottom row (Fig. 1). Response was given by a button press with the index (YES‐response) and middle (NO‐response) fingers of the right hand. Five subjects carried out the Stroop‐task additionally responding with the fingers of the left hand to show a specific change of the hemodynamic response in the respective contralateral primary motor cortex. During neutral trials, the letters in the top row were ‘XXXX’ printed in red, green, blue or yellow, and the bottom row consisted of the color words ‘RED’, ‘GREEN’, ‘BLUE,’ and ‘YELLOW’ printed in black. For congruent trials, the top row consisted of the color words ‘RED’, ‘GREEN’, ‘BLUE,’ and ‘YELLOW’ printed in the congruent color. For the incongruent condition, the color word was printed in a different color to produce interference between color word and color name. To shift visual attention to the top word, it was presented 100 msec before the lower word [MacLeod, 1991]. In half of the trials in all conditions the color in the top row corresponded to the color name of the bottom row. An experimental run consisted of 30 trials (10 neutral, 10 congruent, and 10 incongruent trials) in random order with an interstimulus interval of 12 sec. Words remained on the screen until the response was given with a maximum time of 2 sec. The screen was blank between the trials.
Figure 1.
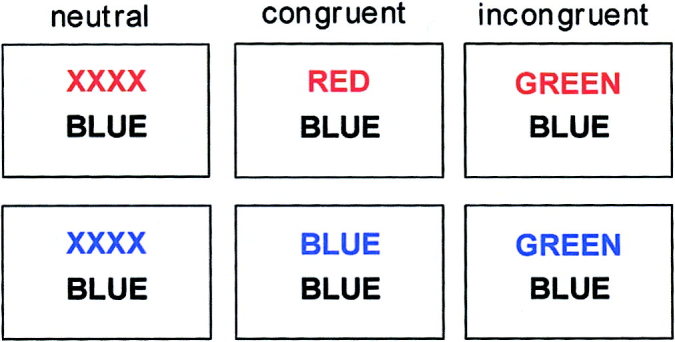
Examples of single trials for the neutral, congruent and incongruent condition of the color–word matching Stroop task. “Does the color of the upper word correspond with the meaning of the lower word?” For the upper three examples, the correct answer would be “no,” for the lower three examples, the correct answer would be “yes” [Zysset et al., 2001].
Data acquisition by NIRS
Changes in the concentration of oxy‐, deoxy‐, total Hb (sum of oxy‐ and deoxy‐Hb) as well as the redox state of the Cyt‐Ox were measured by a NIRO‐300 spectrometer (Hamamatsu Photonics K.K.) and expressed in nM. Changes in the concentration of oxy‐, deoxy‐Hb and in the redox state of the Cyt‐Ox were calculated according to Cope and Delpy [1988]. Two channels were measured at a sampling frequency of 6 Hz in reflection mode. The emitter‐detector spacing was 4 or 5 cm, depending on specific light attenuation, and a differential pathlength factor of 6.26 was assumed [Duncan et al., 1995].
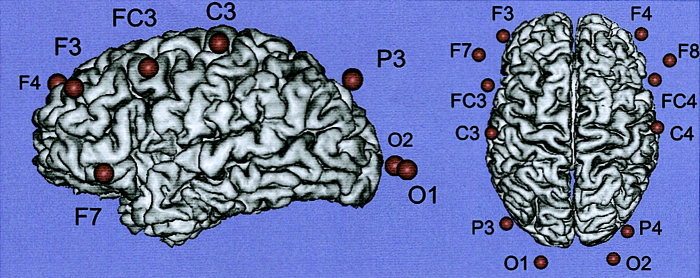
Optodes were placed symmetrically at positions F7/8, F3/4, FC3/4, C3/4, P3/4, and O1/2 of the international 10/20 system (Fig. 2 and Table I) [Homan et al., 1987; Steinmetz et al., 1989]. The emitter was localized 2 cm caudal and the detector 2 cm cranial to the corresponding position, allowing a depth penetration of approximately 2 cm [Villringer and Chance, 1997]. For better visualization of optode positions, optodes were replaced by vitamin E containing capsules in a test subject. A standard high‐resolution MRI data set for this subject was acquired (Bruker 3.0 T Medspec Scanner, MDEFT protocol [Norris and Redpath, 1997], 128 sagittal slices, 256 × 256 matrix, FOV 19.2 × 19.2 cm, 1.5 mm slice thickness). Slices were interpolated to an isotropical resolution of 1 mm using a fourth‐order b‐spline method [Thevenaz et al., 2000]. The surface of the neocortex was extracted as a triangular mesh by image processing methods described elsewhere [Kruggel and von Cramon, 2000]. Capsule positions were marked in the interpolated dataset, and visualized as spheres using the BRIAN package [Kruggel and Lohmann, 1996]. Accordingly, optode positions included the lateral prefrontal cortex (F7/8, F3/4, FC3/4), intraparietal sulcus (P3/4), primary visual (O1/2) and primary motor cortices (C3/4). In one subject, no data was obtained at P3/4 and O1/2 due to strong light attenuation. An experimental run was carried out at each position. Thus, each subject carried out six runs (total time of 36 min).
Figure 2.
Optode positions according to the international 10/20 system, in relation to the corresponding cortical areas. Magnetic resonance image of a test subject. Results by Homan et al. [1987] are summarized in Table 1.
Table I.
Summary of results of Homan et al. [1987]
| Optode position | Brodmann location | Cortical location |
|---|---|---|
| F3/4 | 46 | Middle frontal gyrus, near superior frontal sulcus; rostro‐caudal location. |
| F7/8 | 45/46 | Inferior frontal gyrus rostral portion of pars triangularis. |
| FC3/4 | 6/8/9 | Posterior part of the middle frontal gyrus. |
| C3/4 | 4 | Precentral gyrus, shoulder to wrist area, caudal to middle frontal gyrus. |
| P3/4 | 7 | Superior parietal lobule near intraparietal sulcus, superior to posterior portion of supramarginal gyrus. |
| O1/2 | 17 | Occipital lobe, lateral and superior to occipital pole, overlapping calcarine fissure. |
Analysis of NIRS data
Data was analyzed in two different ways. The mean of the signal intensity during the ‘baseline’ (2 sec before the trial) and the ‘vascular response’ (3–8 sec after the trial) was calculated for each subject and position. The interval from 3–8 sec after the stimulus was chosen, as the vascular response occurred during this interval in all conditions of the Stroop task (Fig. 5). Differences between the mean of the ‘vascular response’ and the ‘baseline’ were compared between the different conditions (incongruent vs. congruent vs. neutral) with a repeated measure ANOVA for each position. The incongruent condition was compared to the congruent and neutral one by paired Student's t‐tests, adjusted for multiple comparisons according to Bonferroni. At positions C3/4, the differences between the ‘vascular response’ and the ‘baseline’ were compared between C3 and C4 with a paired Student's t‐test.
Figure 5.
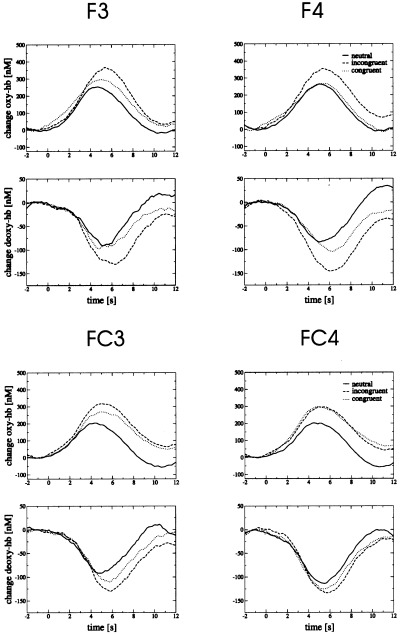
Time courses for concentrations of oxy‐ and deoxy‐hemoglobin (Hb) during a color–word matching Stroop task at the positions F3/4 and FC3/4. Average across 14 subjects. Beginning of the Stroop task at 0 sec. Changes are given in nM, assuming a differential pathlength factor of 6.26 [Duncan et al., 1995]. Running averages over 2 sec.
The hemodynamic response for each trial was modeled according to the nonlinear regression model by Kruggel and von Cramon [1999]. Raw data were filtered with a bandpass filter using a cutoff frequency of 0.05 Hz to remove baseline drifts and 0.2 Hz to filter pulsations due to heartbeat. A Gaussian function was fitted to each single hemodynamic response (Fig. 7), yielding gain (in nM, the ‘height’ of the hemodynamic response), dispersion (in seconds, the duration of the hemodynamic response), and lag (in seconds, the time delay from stimulation onset to the peak of the hemodynamic response). Trials with a goodness‐of‐fit of <0.5 [as defined by Kruggel and von Cramon, 1999] were rejected from further analysis. To compare between different conditions, results were averaged for each position, parameter and subject separately. A repeated measure ANOVA was carried out, followed by paired Student's t‐tests to compare the different conditions with each other. Significance values were again adjusted for multiple comparisons according to Bonferroni.
Figure 7.
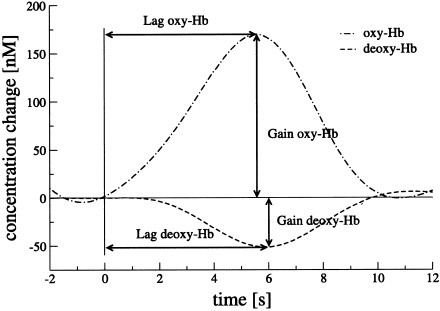
Lag and gain of the Gaussian function as fitted to the time course of oxy‐ and deoxy‐Hb after filtering at F3 during the incongruent condition. Average of 14 subjects. Beginning of the Stroop task at 0 sec.
Results are given as mean ± SD, if not stated otherwise.
RESULTS
Behavioral results
Mean reaction times were shorter in the neutral (740 ± 157 msec) than in the congruent (800 ± 176 msec) or incongruent conditions (882 ± 216 msec; Fig. 3). A repeated‐measure condition (neutral vs. congruent vs. incongruent) × run (6 runs) ANOVA demonstrated a significant main effect for condition (F = 43.99, df = 2, P < 0.001) and run (F = 8.6, df = 5, P < 0.001). There was, however, no significant condition × run interaction (F = 1.75, df = 10, P = 0.078). Reaction times differed significantly in all conditions (neutral vs. incongruent F = 55.19, df = 1, P < 0.001; neutral vs. congruent F = 76.19, df = 1, P < 0.001; congruent vs. incongruent F = 24.08, df = 1, P < 0.001). The interference effect between the neutral and the incongruent condition remained significant over the entire period of the experiment. Mean error rates (percentage of all respective trials) were smaller in the neutral (1.1 ± 3.5%) than in the congruent (1.3 ± 3.8%) or incongruent (3 ± 5.8%) conditions (Fig. 3). A repeated‐measure condition × run ANOVA showed a significant main effect for condition (F = 8.13, df = 2, P = 0.002), but no significant effect for run (F = 1.55, df = 5, P = 0.188) or condition × run interaction (F = 0.77, df = 10, P = 0.658). Concerning error rates, the incongruent condition differed significantly from the neutral (F = 10.55, df = 1, P = 0.007) and the congruent condition (F = 7.85, df = 1, P = 0.016). There was no significant difference between the neutral and congruent conditions (F = 1.32, df = 1, P = 0.273). In summary, behavioral results of the Stroop task are in accordance with the literature [MacLeod, 1991], as demonstrated by a clear interference effect (142 msec).
Figure 3.
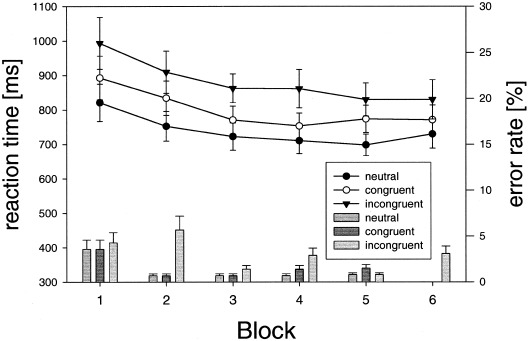
Reaction time (lines and symbols) and error rates (bars) for the color–word matching Stroop task, averaged over all subjects for each of the 6 runs. Mean ± SEM.
NIRS results: ‘vascular response’ vs. ‘baseline’
Figure 4 and Table II summarize the results of the first line of analysis, comparing differences between ‘vascular response’ and ‘baseline’ intervals. No significant differences were generally found for the redox state of the Cyt‐Ox (not shown). Mean concentration changes of oxy‐Hb were stronger at F3/4, FC3/4, C3/4, O1/2 (200–250 nM) than at F7/8, P3/4 (0–190 nM). Mean concentration changes of deoxy‐Hb were more pronounced at F3/4, FC3/4 (−80–−100 nM) than at C3/4, O1/2 (−30–−80 nM) and F7/8, P3/4 (3–−30 nM).
Figure 4.
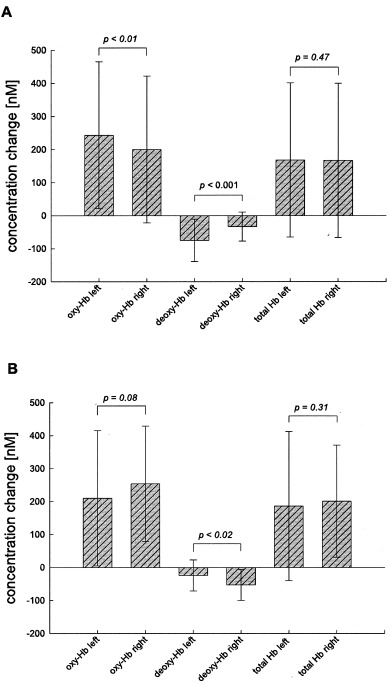
Differences between the ‘vascular response’ (3–8 sec after the trial) and the ‘baseline’ (2 sec before the trial) in comparison between the left (C3) and right (C4) primary motor cortices. Differences are represented as averages of all neutral, congruent, and incongruent trials. A: Response with the right index and middle finger (N = 14, df = 41). B: Response with the left index and middle finger (N = 5, df = 14). Hb, hemoglobin. Mean ± S.D. Paired one‐tailed Student's t‐test.
Table II.
Differences between the vascular response and the baseline compared between the three conditions of the Stroop task†
| Position | Chromophore | Average difference between response and baseline mean ± S.D. (nM) | Statistical analysis | ||||
|---|---|---|---|---|---|---|---|
| Neutral | Congruent | Incongruent | Repeated measuresa | Incongruent vs. congruentb | Incongruent vs. neutralb | ||
| F3 | Oxy‐Hb | 198.4 ± 188 | 249.6 ± 167 | 300.1 ± 236 | * | NS | ** |
| Deoxy‐Hb | −64.4 ± 72 | −77.3 ± 94 | −108.4 ± 79 | * | * | * | |
| Total Hb | 134 ± 149 | 172.3 ± 119 | 191.7 ± 186 | NS | NS | ‡ | |
| F4 | Oxy‐Hb | 209.7 ± 248 | 220.7 ± 176 | 300.6 ± 259 | ‡ | NS | * |
| Deoxy‐Hb | −64.8 ± 109 | −80.7 ± 98 | −118.9 ± 113 | ** | * | ** | |
| Total Hb | 144.9 ± 167 | 140.1 ± 96 | 181.8 ± 204 | NS | NS | NS | |
| F7 | Oxy‐Hb | −37.6 ± 125 | −22.2 ± 137 | 86.6 ± 134 | * | ‡ | * |
| Deoxy‐Hb | −11.2 ± 48 | −11.6 ± 56 | −4 ± 75 | NS | NS | NS | |
| Total Hb | −48.8 ± 138 | −33.8 ± 175 | 82.6 ± 140 | ‡ | NS | * | |
| F8 | Oxy‐Hb | −61.3 ± 173 | −27.8 ± 78 | 85.5 ± 142 | * | * | * |
| Deoxy‐Hb | −50.8 ± 110 | −8.9 ± 43 | −17.3 ± 66 | NS | NS | NS | |
| Total Hb | −112.2 ± 255 | −36.7 ± 105 | 68.2 ± 144 | * | ‡ | * | |
| FC3 | Oxy‐Hb | 151.5 ± 145 | 233.1 ± 142 | 272.3 ± 199 | ** | NS | ** |
| Deoxy‐Hb | −71.2 ± 55 | −83.6 ± 57 | −99.4 ± 85 | NS | NS | NS | |
| Total Hb | 80.3 ± 133 | 149.5 ± 128 | 172.9 ± 151 | ** | NS | ** | |
| FC4 | Oxy‐Hb | 160.5 ± 181 | 254.4 ± 94 | 255.5 ± 162 | * | NS | ‡ |
| Deoxy‐Hb | −90.1 ± 63 | −102.1 ± 44 | −108.6 ± 82 | NS | NS | NS | |
| Total Hb | 70.4 ± 164 | 152.3 ± 103 | 147 ± 132 | * | NS | * | |
Vascular response at 3–8 seconds after the trial. Baseline response 2 seconds before the trial. n = 14. NS, not significant; Hb, hemoglobin.
ANOVA, df = 2.
Paired students t‐test, one‐tailed; df = 13.
P < 0.05;
P < 0.01;
P < 0.1 (trend).
According to the response with the right index or middle finger, there was a significantly stronger increase of oxy‐Hb and decrease of deoxy‐Hb at C3 (left) in comparison with C4 (Fig. 4A). The effect was more pronounced for deoxy‐Hb than for oxy‐Hb. If the subjects responded with the left index or middle finger, the vascular response was inverted between the left and right side (Fig. 4B). Therefore, a stronger vascular response was found in the respective contralateral primary motor cortex during the response with the index or middle finger.
Time courses of the oxy‐ and deoxy‐Hb concentrations are shown in Figure 5 for positions F3/4 and FC3/4. During the Stroop task, concentrations of oxy‐ and total Hb increased, whereas deoxy‐Hb decreased. The increase of oxy‐Hb was significantly higher in the incongruent than in the neutral condition at positions F3/4, F7/8 and FC3 (Table II). The same was the case for total Hb at F7/8 and FC3/4. The decrease of deoxy‐Hb was significantly stronger in the incongruent than in the neutral condition at F3/4. Thus, incongruent trials led to a stronger vascular response than neutral trials, corresponding to a stronger brain activation due to interference reduction. Changes in the concentration of deoxy‐Hb and oxy‐Hb were significantly stronger at F3/4 and F8 during incongruent than congruent trials (Table II). Therefore, brain activation was assumed to be stronger at these positions during the incongruent condition compared to the congruent condition of the Stroop task. At P3/4 and O1/2, changes in the concentration of oxy‐, deoxy‐, and total Hb generally did not differ between the neutral, congruent and incongruent conditions (not shown).
NIRS results: vascular response according to the fitted Gaussian function
Tables III, IV, and Figure 6 summarize the results of modeling the hemodynamic response. Data obtained at F7/8 and P3/4 was excluded from the analysis, as the goodness‐of‐fit was on average less than 0.5. A Gaussian function could not be fitted to the time course of Cyt‐Ox. Table III shows the mean values for dispersion, gain and lag at the several positions. The gain of oxy‐Hb had positive values, whereas the gain of deoxy‐Hb had negative values. Statistically significant differences between different positions were found for gain concerning deoxy‐Hb, and lag concerning oxy‐Hb (ANOVA with repeated measures; P < 0.05, respectively). A lower gain (for deoxy‐Hb) and shorter lag (for oxy‐Hb) were postulated in the lateral prefrontal cortex (F3/4 and FC3/4) in comparison with C3/4 and O1/2 due to interference reduction. Paired one‐tailed Student's t‐tests corroborated this hypothesis with respect to gain of deoxy‐Hb (−57 ± 44 nM, −38 ± 34 nM; N = 54, P < 0.01) and lag of oxy‐Hb (5.73 ± 0.53 sec, 5.97 ± 0.46 sec; N = 54, P < 0.05).
Table III.
Parameter gain, lag and dispersion according to the fitted Gaussian function at the different positions†
| F3/4 | FC3/4 | C3/4 | O1/2 | P‐value | |
|---|---|---|---|---|---|
| Dispersion (sec) | |||||
| Oxy‐Hb | 2.28 ± 0.12 | 2.25 ± 0.09 | 2.24 ± 0.1 | 2.28 ± 0.1 | NS |
| Deoxy‐Hb | 2.21 ± 0.11 | 2.2 ± 0.1 | 2.24 ± 0.14 | 2.24 ± 0.13 | NS |
| Gain (nM) | |||||
| Oxy‐Hb | 143 ± 114 | 132 ± 80 | 128 ± 122 | 132 ± 136 | NS |
| Deoxy‐Hb | −54 ± 51 | −59 ± 34 | −35 ± 34 | −42 ± 34 | <0.05 |
| Lag (sec) | |||||
| Oxy‐Hb | 5.83 ± 0.48 | 5.65 ± 0.57 | 5.9 ± 0.41 | 6.05 ± 0.52 | <0.05 |
| Deoxy‐Hb | 6.0 ± 0.32 | 5.94 ± 0.44 | 5.82 ± 0.5 | 6.1 ± 0.45 | NS |
Values are mean ± S.D. n = 28, except for O1/2, n = 26. Repeated measures ANOVA, df = 3. NS, not significant; Hb, hemoglobin.
Table IV.
Parameter gain, according to the fitted Gaussian function, compared between the three conditions of the Stroop task†
| Position | Chromophore | Average gain mean ± S.D. (nM) | Statistical analysis | ||||
|---|---|---|---|---|---|---|---|
| Neutral | Congruent | Incongruent | Repeated measuresa | Incongruent vs. congruentb | Incongruent vs. neutralb | ||
| F3 | Oxy‐Hb | 128.8 ± 112 | 145.3 ± 86 | 168.6 ± 131 | ‡ | NS | * |
| Deoxy‐Hb | −48.1 ± 42 | −38.1 ± 44 | −54.1 ± 55 | NS | * | NS | |
| F4 | Oxy‐Hb | 137.2 ± 162 | 128.6 ± 97 | 149.1 ± 137 | NS | NS | NS |
| Deoxy‐Hb | −57.2 ± 61 | −51.2 ± 59 | −69.2 ± 64 | ‡ | * | ‡ | |
| FC3 | Oxy‐Hb | 104 ± 89 | 135.7 ± 98 | 148.4 ± 103 | * | NS | ** |
| Deoxy‐Hb | −48.3 ± 29 | −55.1 ± 47 | −62.7 ± 40 | NS | NS | ‡ | |
| FC4 | Oxy‐Hb | 120.4 ± 73 | 138 ± 84 | 150.4 ± 78 | NS | NS | ‡ |
| Deoxy‐Hb | −55.5 ± 29 | −58.2 ± 35 | −74.1 ± 36 | * | * | ** | |
n = 14. NS, not significant; Hb, hemoglobin.
ANOVA, df = 2.
Paired students t‐test, one‐tailed; df = 13.
P < 0.05;
P < 0.01;
P < 0.1 (trend).
Figure 6.
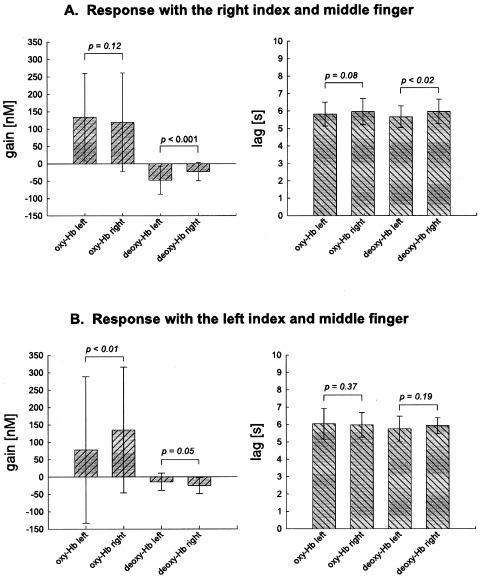
The parameters gain and lag of the respective fitted Gaussian function in comparison between the left (C3) and right (C4) primary motor cortices. Values are averages of all neutral, congruent and incongruent trials. A: Response with the right index and middle finger (N = 14, df = 41). B: Response with the left index and middle finger (N = 5, df = 14). Hb, hemoglobin. Mean ± S.D. Paired one‐tailed Student's t‐test.
The gain of deoxy‐Hb was significantly higher at C3 (left) than C4, if the subject responded with the right index or middle finger (Fig. 6A), and the lag was significantly shorter at C3 than C4. Such tendencies were also observed for the gain and lag of oxy‐Hb, although not significant. If the subjects responded with the left index or middle finger, the vascular response was inverted (Fig. 6B). The gain was higher for oxy‐Hb and smaller for deoxy‐Hb at C4 (right) than C3. Thus, the vascular response was stronger in the primary motor cortex contralateral to the motor response.
At positions F3/4 and FC3/4 (Table IV), the gain was higher in the incongruent than in the neutral and congruent conditions in the case of oxy‐Hb and lower concerning deoxy‐Hb. These differences were significant for incongruent vs. neutral for oxy‐Hb at F3 and FC3, and for deoxy‐Hb at FC4. Additionally, differences tended to be significant for oxy‐Hb at FC4 and for deoxy‐Hb at F4 and FC3. Concerning deoxy‐Hb the incongruent condition differed significantly from the congruent condition at F3/4 and FC4. No significant differences were found for lag and dispersion, if incongruent vs. congruent and neutral conditions were compared. In conclusion, the vascular response was higher at F3/4 and FC3/4 in the incongruent than in the neutral and congruent conditions, corresponding to a stronger brain activation due to interference. These results are in accordance with the first line of analysis (see above). When the incongruent vs. congruent and neutral conditions were compared at O1/2, no significant differences in gain, dispersion and lag were found between the vascular responses (not shown).
Table III demonstrates that the lag (time‐to‐peak) for deoxy‐Hb was longer than the lag for oxy‐Hb at the positions over the lateral prefrontal cortex (F3/4 and FC3/4), in comparison with C3/4 and O1/2. To further compare the hemodynamic responses between the conditions of the Stroop task, the difference between the lag of deoxy‐Hb and oxy‐Hb (lagdeoxy‐Hb − lagoxy‐Hb) at the same position was calculated for the neutral and incongruent condition and compared to each other (Fig. 7 and Table V). Interference reduction may lead to a higher neuronal activity in the lateral prefrontal cortex, and, consequently to a higher oxygen consumption in this region when incongruent trials are compared to neutral ones. Therefore, we hypothesized that deoxy‐Hb reaches its minimum (lagdeoxy‐Hb) later than oxy‐Hb reaches its maximum (lagoxy‐Hb) during incongruent compared to neutral trials. Accordingly, the time interval between the lag of deoxy‐Hb and oxy‐Hb was longer in the incongruent than the neutral condition at F3/4. No such differences were found at FC3/4, C3/4, and O1/2.
Table V.
Differences between the lag of deoxy‐ and oxy‐hemoglobin (Hb), and the changes in the gain of oxy‐ and deoxy‐Hb at the positions F3/4 and FC3/4 over the lateral prefrontal cortex
| Position | Lagdeoxy‐Hb − Lagoxy‐Hb (s) | Gainoxy‐Hb − Gaindeoxy‐Hb (nM) | ||
|---|---|---|---|---|
| Neutral | Incongruent | Neutral | Incongruent | |
| F3 | −0.17 ± 0.5 | 0.31 ± 0.9* | 182 ± 150 | 226 ± 176* |
| F4 | −0.11 ± 0.8 | 0.31 ± 0.44* | 198 ± 214 | 219 ± 187 |
| FC3 | 0.21 ± 0.75 | 0.39 ± 0.84 | 154 ± 112 | 215 ± 129** |
| FC4 | 0.02 ± 0.62 | 0.09 ± 0.68 | 178 ± 83 | 225 ± 103* |
Values are expressed as mean ± S.D. (n = 14 subjects).
P < 0.05;
P < 0.01; incongruent in comparison with neutral condition, paired one‐tailed students t‐test.
Brain activation leads to an increase in cerebral blood flow that exceeds the increase in oxygen consumption [Villringer and Dirnagl, 1995]. Consequently, the concentration of oxy‐Hb increases whereas the concentration of deoxy‐Hb decreases [Villringer and Chance, 1997]. The sum of the absolute changes in the gain of oxy‐Hb and deoxy‐Hb (equal to gainoxy‐Hb − gaindeoxy‐Hb) may characterize these changes for each position, revealing a parameter including deoxy‐ and oxy‐Hb (Fig. 7). Values were higher during incongruent than neutral trials in the lateral prefrontal cortex (F3, FC3/4), but were not different at F4, C3/4, and O1/2.
Relation between behavioral data and the hemodynamic response
We showed significant differences between neutral and incongruent trials of the Stroop task concerning either the hemodynamic response or behavioral data. If changes in oxygen consumption and cerebral blood flow in the lateral prefrontal cortex are specific for the Stroop task, one may assume that reaction time and error rate are correlated with the difference between the lag of deoxy‐Hb and oxy‐Hb (lagdeoxy‐Hb − lagoxy‐Hb), and with the sum of the absolute changes in the gain of oxy‐Hb and deoxy‐Hb (equal to gainoxy‐Hb − gaindeoxy‐Hb) in the lateral prefrontal cortex. Accordingly, reaction time was positively correlated with the gain difference at F3, FC3/4 (r = 0.16, N = 398, P < 0.01; 0.14, 385, <0.01; 0.16, 393, <0.001; correlation coefficient according to Spearman, one‐tailed). Further, the error rate was positively correlated with the lag difference at F3 (r = 0.09, N = 398, P < 0.05).
DISCUSSION
Our study demonstrates the feasibility of NIRS to monitor brain activation using a cognitive paradigm in an event‐related design. The first analysis approach used the ‘traditional’ method of calculating the differences between ‘vascular response’ and ‘baseline’, while the second approach modeled the hemodynamic response trial wise by a nonlinear regression model [Kruggel and von Cramon, 1999] taking advantage of the good temporal resolution (6 Hz) of the method. Modeling the response has advantages in comparison to the first method. It reveals three parameters (gain, lag, and dispersion) that characterize each hemodynamic response, and which may be related to behavioral results (for instance, reaction time and error rate) and compared between different conditions. Our study shows that interference during the color–word matching Stroop task leads to specific brain activation in the lateral prefrontal cortex bilaterally (F3/4, F7/8, FC3/4), in the vicinity of the inferior and middle frontal gyrus [Homan et al., 1987]. Our data is in accordance with functional magnetic resonance imaging (fMRI) [Carter et al., 2000; Leung et al., 2000; Zysset et al., 2001] and positron emission tomography studies [Carter et al., 1995; George et al., 1994; Taylor et al., 1997]. The specificity of the vascular response, as measured by NIRS in our study, was shown by inversion of the hemodynamic response at positions C3 and C4, when the subject responded with the respective other hand. The differences in activation between the motor cortices were more pronounced for deoxy‐ compared to oxy‐Hb, as revealed by both analysis methods. These results are in accordance with previous reports [Hirth et al., 1996; Kleinschmidt et al., 1996; Obrig et al., 2000].
Simultaneous measurement of several chromophores (oxy‐, deoxy‐Hb, and Cyt‐Ox) is an advantage of NIRS [Villringer and Chance, 1997]. Our study demonstrates that NIRS may contribute additional information concerning the vascular response in comparison with other functional imaging methods, such as fMRI. We found a specific delay between the lag of oxy‐ and deoxy‐Hb in the incongruent condition compared to the neutral one at positions F3/4. Such a temporal shift between the peaks of deoxy‐ and oxy‐Hb can be detected by NIRS only, in contrast to fMRI. The concentration of deoxy‐Hb decreased more whereas the concentration of oxy‐Hb increased more during incongruent compared to neutral trials, specifically at positions over the lateral prefrontal cortex (F3/4, FC3/4). These results may indicate that interference leads to a higher neuronal activity, and, thus to a higher oxygen consumption in the lateral prefrontal cortex with a subsequent increase in regional blood flow due to neurovascular coupling [Gratton et al., 2001; Villringer and Dirnagl, 1995]. At F3/4, oxygen consumption increased more than the rise of cerebral blood flow in the early phase. The decrease of deoxy‐Hb was postponed and deoxy‐Hb reached its minimum later than oxy‐Hb reached its maximum during incongruent compared to neutral trials. Thereafter, the increase in regional blood flow exceeded the oxygen consumption. Consequently, the concentration of oxy‐Hb increased whereas the concentration of deoxy‐Hb decreased, such as in the other parts of the lateral prefrontal cortex. The data suggest that brain activation due to interference was higher in the cortical areas at F3/4 than at FC3/4, because oxygen consumption increases with brain activation [Hoge et al., 1999], and the increase of oxygen consumption is more localized than the increase of blood flow [Malonek and Grinvald, 1996]. The specificity of the hemodynamic response in the lateral prefrontal cortex is supported by the correlation with behavioral data.
The lack of significant differences between the three conditions of the Stroop‐task concerning deoxy‐Hb at F7/8 in our study, may be caused by the interference with the temporal muscle, which may lead to a low signal‐to‐noise ratio, indicated by a low goodness‐of‐fit (0.44) at these positions. The analysis of the hemodynamic response at P3/4 over the superior parietal lobe revealed no significant differences between the experimental conditions. Whereas the fMRI study of Zysset et al. [2001] demonstrated a stronger brain activation along the intraparietal sulcus, depth penetration of NIRS is limited [Germon et al., 1999; Villringer et al., 1997] and may not be sensitive enough to detect differences in the hemodynamic response within the depth of the intraparietal sulcus. On the other hand, these differences may be caused by the different design (event‐related vs. block) of the two studies. Generally, no significant differences were found between the conditions of the Stroop‐task concerning Cyt‐Ox, presumably due to smaller changes in the redox state of Cyt‐Ox in comparison with changes in the concentration of oxy‐ and deoxy‐Hb, and due to a relatively short trial length in our study [Wobst et al., 2001].
In summary, it was shown that NIRS is a valuable tool for cognitive functional brain activation studies in an event‐related design, as demonstrated for the color–word matching Stroop task. A new method was introduced for NIRS data evaluation in event‐related studies that enables the analysis of the hemodynamic response for each single trial. Further event‐related NIRS studies may apply well tested fMRI designs in studies with children and patients, utilizing the advantages of the method.
REFERENCES
- Carter CS, Mintun M, Cohen JD (1995): Interference and facilitation effects during selective attention: an H2 15O PET study of Stroop task performance. Neuroimage 2: 264–272. [DOI] [PubMed] [Google Scholar]
- Carter CS, MacDonald AM, Botvinick M, Ross LL, Stenger VA, Noll D, Cohen JD (2000): Parsing executive processes: strategic vs. evaluative functions of the anterior cingulate cortex. PNAS 97: 1944–1948. [DOI] [PMC free article] [PubMed] [Google Scholar]
- Cope M, Delpy DT (1988): System for long‐term measurement of cerebral blood and tissue oxygenation on newborn infants by near infra‐red transillumination. Med Biol Eng Comput 26: 289–294. [DOI] [PubMed] [Google Scholar]
- Duncan A, Meek JH, Clemence M, Elwell CE, Tyszczuk L, Cope M, Delpy DT (1995): Optical pathlength measurements on adult head, calf and forearm and the head of the newborn infant using phase resolved optical spectroscopy. Phys Med Biol 40: 295–304. [DOI] [PubMed] [Google Scholar]
- George MS, Ketter TA, Parekh PI, Rosinsky N, Ring H, Casey BJ, Trimble MR, Horwitz B, Herscovitch P, Post RM (1994): Regional brain activity when selecting a response despite interference: an H2 15O study of the Stroop and an emotional Stroop. Hum Brain Mapp 1: 194–209. [DOI] [PubMed] [Google Scholar]
- Germon TJ, Evans PD, Barnett NJ, Wall P, Manara AR, Nelson RJ (1999): Cerebral near infrared spectroscopy: emitter‐detector separation must be increased. Br J Anaesth 82: 831–837. [DOI] [PubMed] [Google Scholar]
- Gratton G, Goodman‐Wood MR, Fabiani M (2001): Comparison of neuronal and hemodynamic measures of the brain response to visual stimulation: an optical imaging study. Hum Brain Mapp 13: 13–25. [DOI] [PMC free article] [PubMed] [Google Scholar]
- Hirth C, Obrig H, Villringer K, Thiel A, Bernarding J, Mühlnickel W, Flor H, Dirnagl U, Villringer A (1996): Non‐invasive functional mapping of the human motor cortex using near‐infrared spectroscopy. Neuroreport 7: 1977–1981. [DOI] [PubMed] [Google Scholar]
- Hoge RD, Atkinson J, Gill B, Crelier GR, Marrett S, Pike GB (1999): Investigation of BOLD signal dependence on cerebral blood flow and oxygen consumption: the deoxyhemoglobin dilution model. Magn Reson Med 42: 849–863. [DOI] [PubMed] [Google Scholar]
- Homan RW, Herman J, Purdy P (1987): Cerebral location of international 10‐20 system electrode placement. Electroenceph Clinic Neurophysiol 66: 376–381. [DOI] [PubMed] [Google Scholar]
- Kleinschmidt A, Obrig H, Requardt M, Merboldt KD, Dirnagl U, Villringer A, Frahm J (1996): Simultaneous recording of cerebral blood oxygenation changes during human brain activation by magnetic resonance imaging and near‐infrared spectroscopy. J Cereb Blood Flow Metab 16: 817–826 [DOI] [PubMed] [Google Scholar]
- Kruggel F, Lohmann G (1996): BRIAN (brain image analysis): a toolkit for the analysis of multimodal brain data sets In: Computer‐aided radiology. Amsterdam: Elsevier; p 323–328. [Google Scholar]
- Kruggel F, von Cramon DY (1999): Modeling the hemodynamic response in single‐trial functional MRI experiments. Magn Reson Med 42: 787–797. [DOI] [PubMed] [Google Scholar]
- Kruggel F, von Cramon DY(2000): Measuring the neocortical thickness In: Workshop on mathematical methods in biomedical image analysis (Hilton Head). Los Alamitos: IEEE Press; p 154–161. [Google Scholar]
- Leung HC, Skudlarski P, Gatenby JC, Peterson BS, Gore JC (2000): An event‐related functional MRI study of the Stroop color word interference task. Cereb Cortex 10: 552–560. [DOI] [PubMed] [Google Scholar]
- MacLeod CM (1991): Half a century of research on the Stroop effect: an integrative review. Psychol Bull 109: 163–203. [DOI] [PubMed] [Google Scholar]
- Malonek D, Grinvald A (1996): Interactions between electrical activity and cortical microcirculation revealed by imaging spectroscopy: implications for functional brain mapping. Science 272: 551–554. [DOI] [PubMed] [Google Scholar]
- Norris DG, Redpath TW (1997): The MDEFT sequence is applicable for clinical systems operating at 1T. In: Proceedings of the International Society of Magnetic Resonance in Medicine, 5th Annual Meeting, Vancouver, British Columbia. p 686.
- Obrig H, Villringer A (1997): Near‐infrared spectroscopy in functional activation studies. Can NIRS demonstrate cortical activation? In: Villringer A, Dirnagl U, editors. Optical imaging of brain function and metabolism II. New York: Plenum Press; p 113–127. [DOI] [PubMed] [Google Scholar]
- Obrig H, Wenzel R, Kohl M, Horst S, Wobst P, Steinbrink J, Thomas F, Villringer A (2000): Near‐infrared spectroscopy: does it function in functional activation studies of the adult brain? Int J Psychophysiol 35: 125–142. [DOI] [PubMed] [Google Scholar]
- Steinmetz H, Fürst G, Meyer BU (1989): Craniocerebral topography within the international 10‐20 system. Electroencephalogr Clin Neurophysiol 72: 499–506. [DOI] [PubMed] [Google Scholar]
- Stroop J (1935): Studies of interference in serial verbal reactions. J Exp Psychol 18: 643–662. [Google Scholar]
- Taylor SF, Kornblum S, Lauber EJ, Minoshima S, Koeppe RA (1997): Isolation of specific interference processing in the Stroop task: PET activation studies. Neuroimage 6: 81–92. [DOI] [PubMed] [Google Scholar]
- Thevenaz P, Blu T, Unser M (2000): Image Interpolation and resampling In: Bankman IN, editor. Handbook of medical image processing and analysis. San Diego: Academic Press; p. 393–420. [Google Scholar]
- Treisman A, Fearnley S (1969): The Stroop test: selective attention to colors and words. Nature 222: 437–439. [DOI] [PubMed] [Google Scholar]
- Villringer A, Dirnagl U(1995): Coupling of brain activity and cerebral blood flow: basis of functional neuroimaging. Cerebrovasc Brain Metab Rev 7: 240–276. [PubMed] [Google Scholar]
- Villringer A, Chance B (1997): Non‐invasive optical spectroscopy and imaging of human brain function. TINS 20: 435–442. [DOI] [PubMed] [Google Scholar]
- Villringer K, Minoshima S, Hock C, Obrig H, Ziegler S, Dirnagl U, Schwaiger M, Villringer A (1997): Assessment of local brain activation. A simultaneous PET and near‐infrared spectroscopy study. Adv Exp Med Biol 413: 149–153. [PubMed] [Google Scholar]
- Wobst P, Wenzel R, Kohl M, Obrig H, Villringer A (2001): Linear aspects of changes in deoxygenated hemoglobin concentration and cytochrome oxidase oxidation during brain activation. Neuroimage 13: 520–‐530. [DOI] [PubMed] [Google Scholar]
- Zysset S, Müller K, Lohmann G, von Cramon DY (2001): Color–word matching Stroop task: separating interference and response conflict. Neuroimage 13: 29–36. [DOI] [PubMed] [Google Scholar]


