

Abstract
The role of motor activity ipsilateral to movement remains a matter of debate, due in part to discrepancies among studies in the localization of this activity, when observed, and uncertainty about its time course. The present study used magnetoencephalography (MEG) to investigate the spatial localization and temporal dynamics of contralateral and ipsilateral motor activity during the preparation of unilateral finger movements. Eight right‐handed normal subjects carried out self‐paced finger‐lifting movements with either their dominant or nondominant hand during MEG recordings. The Multi‐Start Spatial Temporal multi‐dipole method was used to analyze MEG responses recorded during the movement preparation and early execution stage (−800 msec to +30 msec) of movement. Three sources were localized consistently, including a source in the contralateral primary motor area (M1) and in the supplementary motor area (SMA). A third source ipsilateral to movement was located significantly anterior, inferior, and lateral to M1, in the premotor area (PMA) (Brodmann area [BA] 6). Peak latency of the SMA and the ipsilateral PMA sources significantly preceded the peak latency of the contralateral M1 source by 60 msec and 52 msec, respectively. Peak dipole strengths of both the SMA and ipsilateral PMA sources were significantly weaker than was the contralateral M1 source, but did not differ from each other. Altogether, the results indicated that the ipsilateral motor activity was associated with premotor function, rather than activity in M1. The time courses of activation in SMA and ipsilateral PMA were consistent with their purported roles in planning movements. Hum. Brain Mapp. 23:26–39, 2004. © 2004 Wiley‐Liss, Inc.
Keywords: MEG, primary motor area, premotor area, supplementary motor area, hemispheric asymmetry
INTRODUCTION
Ipsilateral activation of motor areas during unilateral voluntary finger movement has been reported widely using functional magnetic resonance imaging (fMRI) [Baraldi et al., 1999; Cramer et al., 1999; Dassonville et al., 1997; Kim et al., 1993; Rao et al., 1993; Solodkin et al., 2001; Wexler et al., 1997], positron emission tomography (PET) [Catalan et al., 1998; Kawashima et al., 1998; Sadato et al., 1996], and transcranial magnetic stimulation (TMS) [Caramia et al., 2000; Palmer et al., 1992; Wassermann et al., 1991]. One view contends that ipsilateral activity is due to inhibition of homologous primary motor areas that control the unmoving limb [Cheyne et al., 1995; Cheyne and Weinberg, 1989]. For example, transcallosal inhibition by ipsilateral motor areas has been suggested in a fMRI study reporting deactivation of ipsilateral primary motor area (M1) relative to a resting baseline condition [Allison et al., 2000]. Activation of the ipsilateral M1 during unilateral movements in humans, however, has not been found consistently [Dassonville et al., 1998; Harrington et al., 2000; Schluter et al., 2001]. Other fMRI research suggests that the region of ipsilateral activation is spatially distinct from that identified in contralateral M1 [Baraldi et al., 1999; Cramer et al., 1999]. Cramer et al. [1999] reported that unilateral finger tapping produced ipsilateral activation in the premotor area (PMA) rather than M1, consistent with another study [Dassonville et al., 1998]. These findings suggest transcallosal inhibition by homologous motor areas may not be a fundamental mechanism underlying the control of unilateral movements. Rather, other mechanisms may mediate ipsilateral activity during unilateral movement.
The PMA seems to regulate the preparation and selection of movement [Rizzolatti et al., 1996; Wise et al., 1997], which is consistent with its abundant pathways to M1 and the parietal cortex [Boussaoud et al., 1996; Dum and Strick, 1991; Petrides and Pandya, 1984], the latter of which seems crucial for representing abstract action plans [Shadmehr and Holcomb, 1997]. Although possible functional differences between ipsilateral and contralateral PMA have not been studied, activation in both regions during fMRI correlates positively with the time it takes to prepare unilateral finger movements [Dassonville et al., 1998], suggesting both play a role in response preparation. Similarly, fMRI studies have reported that contralateral and ipsilateral PMA activation is greater for sequential than for single movements [Dassonville et al., 1997; Baraldi et al., 1999], which is also consistent with a preparatory function for this region. Nevertheless, these studies cannot directly test this hypothesis, because it is not possible to distinguish planning and response execution processes in the blocked designs commonly used in fMRI studies. Fundamental insights into this issue can be gained, however, by studying the relative time course of activation before movement onset in motor areas contralateral and ipsilateral to movement. If the PMA is the focus of ipsilateral motor activity and if it is involved in response preparation, the peak latency of its time course should precede that of contralateral M1.
Traditionally, electroencephalography (EEG) has been used to study contralateral and ipsilateral motor activity [Kristeva et al., 1990; Lang et al., 1990; Tarkka and Hallet, 1990; Urbano et al., 1998]. It is more difficult to obtain highly accurate source locations in EEG, however, due to the difficulty of estimating and modeling the conductivity profile of the head, especially the substructure of the skull [Leahy et al., 1998]. The present study used magnetoencephalography (MEG) to investigate temporal dynamics and spatial localization of contralateral and ipsilateral motor activity during the preparation of self‐paced unilateral finger movement of the dominant and non‐dominant hands. MEG is a good technique to study the functional role of ipsilateral cortical activity due to its excellent temporal resolution and superior spatial localization accuracy in comparison to event‐related potentials (ERPs) and EEG. Previous MEG studies of unilateral hand movement [Cheyne et al., 1995; Hoshiyama et al., 1997; Kristeva et al., 1991; Nagamine et al., 1996; Taniguchi et al., 1998] have not used MRI co‐registration, so the precise anatomic sites underlying the MEG sources could not be delineated. One MEG study, in which MRI co‐registration was used, failed to find a reliable ipsilateral motor source [Volkmann et al., 1998]. Most studies have not compared directly the temporal dynamics of ipsilateral and contralateral sources. The findings from previous MEG studies are also equivocal due to the use of a two‐dipole model, one in each hemisphere, to fit the entire premovement interval, despite fMRI and PET reports of more than two sources of activation (e.g., primary motor, bilateral premotor, supplementary motor area [SMA], parietal region) in paced tapping tasks [Larsson et al., 1996; Kawashima et al., 1999; Rao et al., 1993, 1997]. If the data are under‐modeled, as in the previous MEG studies, both the source locations and their temporal dynamics are likely to be contaminated by the other unaccounted sources. The problem of contamination becomes even more serious when an interval longer than 50‐msec after movement onset is analyzed, due to the intrusion of strong signal from primary somatosensory cortex in the contralateral [Salmelin et al., 1995] and ipsilateral hemispheres [Babiloni et al., 1999; Hari and Imada, 1999], or from bilateral secondary somatosensory areas [Salmelin et al., 1995].
In the present study, these problems were avoided by modeling the locations and temporal dynamics of multiple (6 to 8) neuronal sources that were generated by unilateral finger‐lifting movements as healthy adults underwent MEG. The Multi‐Start Spatio‐Temporal (MSST) localization technique [Huang et al., 1998] was used to identify and characterize the time course of sources during the epoch encompassing the motor preparation and early execution stage of finger lifting (−800 msec to +30 msec). Relative to traditional MEG analysis techniques [Berg and Scherg, 1994; Neuromag, 1996], the MSST approach is more objective and can improve source localization accuracy because the user does not have to provide initial guesses for the dipole locations [Aine et al., 2000; Huang et al., 1998, 2000]. Because localization accuracy depends on the validity of inversion algorithms used to reconstruct spatial information from magnetic signals recorded outside the scalp, 300 Monte‐Carlo analyses were carried out on the source locations obtained from MSST to evaluate the likelihood that the obtained solutions were reliable [Medvick et al., 1989]. Source locations were then superimposed on the MRI of each subject to establish their anatomic foci, and the temporal dynamics (i.e., peak latency, source strength) of each modeled source was analyzed. Peak latency is the main measure of interest in the present study for two reasons. First, it is the standard measurement of brain activity used in EEG and MEG research (e.g., N20/M20 components in EEG/MEG for the 20‐msec median nerve response; P50/M50 components in EEG/MEG for the 50‐msec auditory response). Second, peak latency provides information about when neuronal activity begins to decline. For example, the time at which PMA and M1 activity begins to decline provides a good measurement of when motor preparation and execution process start to terminate, respectively. We predicted that if ipsilateral motor activity is functionally distinct from contralateral sensorimotor activity, its source location should be shifted anterior to M1, in the PMA, and peak latency should occur earlier than in contralateral M1, reflecting its role in preparatory processes. Alternatively, if the neuronal activity of ipsilateral finger movement is due to inhibition of homologous primary motor areas, its location should be the same as the location of the primary motor activity, namely in M1.
We also investigated whether ipsilateral motor activity was related to possible hemispheric asymmetries for controlling movement. Although movement is influenced strongly by contralateral M1 organization, deficits in carrying out movements with the limb ipsilateral to a damaged hemisphere is found more commonly in patients with left than right hemisphere damage [Haaland and Harrington, 1994; Harrington and Haaland, 1991; Kimura, 1977; Kimura and Archibald, 1974]. These findings suggest that the left hemisphere is biased for controlling movement [Haaland and Harrington, 1996]. PET and fMRI studies of hemispheric asymmetry in motor areas remain controversial, with some showing that left but not right M1 is activated by movement ipsilateral to the hemisphere [Kim et al., 1993; Mattay et al., 1996;], and others reporting no hemispheric asymmetry [Kawashima et al., 1998; Sabatini et al., 1993]. PET and fMRI studies have not addressed the issue of whether potential hemispheric asymmetries are associated with preparing movements or activities evoked by the movements. Although MEG studies have not shown a significant hemispheric asymmetry in motor areas [Kristeva et al., 1991; Taniguchi et al., 1998], this needs to be evaluated closely by examining the precise location and time course of activation between the hemispheres. In the present study, the strength of sources in motor areas generated by movements ipsilateral to a hemisphere was compared directly between the two hemispheres. We predicted that the peak strength of ipsilateral sources before movement should be greater in the left than in the right hemisphere if the left hemisphere is biased for controlling movements before their onset.
SUBJECTS AND METHODS
Task and Procedures
Eight right‐handed normal subjects (four men, four women; mean age, 33.5 years, age range, 21–46 years) participated in the study. All subjects signed consent forms approved by the Human Research Review Committee at the University of New Mexico. During the experimental task, the subject was seated comfortably in a chair under the MEG system and rested his/her hands and forearms on a table in a pronated position. Each forearm was placed about 45° inward with respect to the anterior direction, and the angle between the forearm and shoulder was about 90°. The following instruction was given verbatim to each subject when carrying out the finger‐lifting MEG task: “lift your right (left) index finger as quick and as high as you can, then allow the gravity to pull your index finger back to the table without any effort. You need to self‐pace your finger movement and lift the index finger approximately once in every 2 sec. During the index finger‐lifting, make sure your palm and other fingers are always on the table. Do not move your index finger if you blink your eyes.” The entire task lasted about 15 min. A 5‐min break was then given before testing the opposite hand. The order of testing the dominant and non‐dominant hands was counterbalanced across subjects.
MEG Measurements
Magnetic responses were measured by the Neuromag whole‐head MEG system (Helsinki, Finland), with 122 planar gradiometers in a magnetically shielded room (IMEDCO‐AG, Switzerland). Electrooculogram (EOG) electrodes were used to monitor eye blinks. A video camera inside the shielded room and an intercom enabled the experimenter to monitor the subject and provide feedback to insure that the task was carried out accurately. In the resting state, the subject placed the index finger on a piece of wood (attached to the table) with a shallow hole drilled through it. The hole had a fiber optic cable on either side of it. One fiber connected to a light‐emitting laser diode and the other to a light‐sensing diode in an optical sensor unit. The subject's finger blocked the light in the resting state and unblocked it when the finger was lifted. The electrical output of the optical sensor unit was fed into a debouncer, which in turn sent a trigger to the MEG system for signal averaging. Three hundred trials free of eye blinks and other artifacts were averaged with respect to the onset of the finger movement. The prestimulus and poststimulus intervals of the recording were 1,000 msec and 500 msec, respectively. The sampling frequency used in the MEG data acquisition was 300 Hz, and the data were run through a band‐pass filter (0.1–100 Hz) and a notch filter to remove 60‐Hz power‐line noise. The interval beginning 800 msec before movement onset and ending 30 msec after movement onset was analyzed to study the sources involved in planning the movement, uncontaminated by potentially strong ipsilateral primary somatosensory (S1) signals that have been reported about 60 msec after movement onset [Hari and Imada, 1999]. A strong somatosensory contamination in the ipsilateral hemisphere would have substantially reduced our ability to localize and depict accurately the time course of the ipsilateral motor source preceding movement, which was the focus of our study. No S1 activation has been found in contralateral or ipsilateral S1 during the motor preparation and early execution stages [Inase et al., 1989], which we demonstrated also in the present study (see results).
MEG Analyses
To localize neuronal sources using MEG, assumptions are made about the conductivity distribution for the head (head model) and the sources (source model). Typical head models assume that the head contains several homogeneous layers (e.g., scalp, skull, and brain). The geometry of different layers can be described by best‐fitting spheres, a spherical head model [Ilmoniemi et al., 1985; Sarvas, 1987], or many small triangular boundary elements, the Boundary Element Method (BEM) [Ferguson et al., 1994; Hämäläinen and Sarvas, 1989; Mejis et al., 1987; Schlitt et al., 1995]. In a human skull phantom study that we contributed to, it was shown that for sensorimotor areas the spherical head model and BEM yielded very similar results [Leahy et al., 1998], due to the high spherical symmetry of the skull in this region. We also reported that the main source of error for MEG source localization was the MEG‐computed tomography (CT) co‐registration error (2.26 mm), which was small. In this study, therefore, the spherical head model was adopted. In this approach, a sphere is fitted to the inner surface of the skull (based on each subject's MRI) overlying an area surrounding the bilateral central sulci including the posterior frontal lobe, the entire parietal lobe, and the superior temporal lobe. Based on our previous results, the MEG‐MRI co‐registration error in the present study was expected to be <3 mm.
A widely adopted source model for MEG is a set of equivalent current dipoles (ECDs), which assumes that there are multiple focal neuronal current sources that can be modeled by multiple dipoles. This model was applied in the present study because the physiologic validity of the dipole model for sensorimotor responses has been well documented in animal studies [Okada et al., 1996]. The MSST modeling technique [Huang et al., 1998] was used to obtain the locations of neuronal sources and their temporal dynamics (i.e., time course, source strength, area under the curve of source‐strength vs. time). This method has been tested in computer simulations, phantom studies, and human studies [Aine et al., 2000; Huang et al., 1998, 2000], and has been shown to be a significant improvement over traditional inverse techniques in terms of source localization accuracy and ability to model weak sources. Unlike the traditional multi‐dipole fitting approaches, MSST does not require users to provide initial guesses for dipole locations; hence, the fitting procedure is more objective.
Cartesian coordinates were used to describe the dipole locations. The y‐axis was defined as the direction from right preauricula (PA) to left PA, with positive y to the left direction. The x‐axis was defined as a line through the nasion (NA) intersecting and perpendicular to the left–right PA line, with positive x in the anterior direction. The z‐axis was perpendicular to the x–y plane, with positive z in the superior direction. The locations of the sources provided by MEG were then superimposed on 3‐D‐volumetric gradient refocused echo T1‐weighted anatomic MR images of the patients collected on a 1.5 T MR scanner. To co‐register the MEG with MRI, the three anatomic landmarks (i.e., NA, left and right PA) were measured for each subject using the Head Position Identification system included with the Neuromag whole‐head MEG system. By identifying the same three points on the subject's MR images using Neuromag software, a transformation matrix involving both rotation and translation between the MEG and MRI coordinate systems was generated to provide proper co‐registration of the functional localizations to the anatomic structure. Because it is now common to remove the skull from MRIs to protect the identity of subjects, after the MEG‐MRI transformation matrix was obtained for each subject, the skull was removed from the subject's MR images and MEG sources were superimposed on the brain‐only surface.
Determining the adequate number of dipoles in the data (model order) is an important procedure in any multiple‐dipole fitting method. Great cares had been taken in MSST to ensure the data were not either under‐modeled (the number of dipole is less than adequate) or over‐modeled (more than adequate number of dipoles used). Singular value decomposition (SVD) [Golub and Van Loan, 1984] was used to obtain the number of asynchronous sources (the number of signal‐related singular values, also the “minimum model order”) for a given interval of data. If the noise in the data is white (uncorrelated), the SVD plot is L‐shaped, with the signal‐related singular values in the part with the bigger slope and the noise‐related singular values in the part with the smaller slope. In this case, picking up the signal‐related singular values from SVD is straightforward. If there is some correlated noise in the data, however, the transition between noise‐related singular values and the signal‐related singular values is gradual. In this case, the data were pre‐whitened [Hansen, 1997; Knösche et al., 1998; Sekihara et al., 1997, 1999] before the number of asynchronous sources was determined from the SVD. Next, to derive the adequate model order, a search beyond the minimum model order was carried out to account for synchronous or near‐synchronous sources that may exist in the data [Aine et al., 2000; Huang et al., 1998, 2000]. For a given model order, the reduced‐χ2 (χ2 normalized by the number of degrees of freedom) is used as the goodness‐of‐fit measurement. An adequate model order is found when all the following criteria are satisfied: (1) an increase in the model order will not significantly lower the reduced‐χ2 values, but a decrease in the model order will significantly increase the reduced‐χ2 values; (2) the best‐fitting MSST solutions with similar reduced‐χ2 values (within 5% of each other) form clusters in a dipole location plot; and (3) no signal remains in the fitted residual (i.e., the difference between the empirical data and the modeled data). Under‐modeling the data can be detected by violations of criteria 1 and 3. Namely, an increase of the model order will lower significantly the reduced‐χ2 values and un‐modeled signals will remain in the fitted residual. On the other hand, over‐modeling will result in violations of criterion 1 and 2. Here, a decrease in the model order will not significantly increase the reduced‐χ2 values and random scattering will be seen in the location plot for best‐fitting solutions (i.e., unneeded extra dipoles are fitting the noise). Additionally, over‐modeling may cause the real sources to be localized less accurately in which the clusters associated with the real sources show larger extent than in the adequate modeling.
RESULTS
The behavioral data showed that the mean inter‐movement interval for self‐paced finger lifting of the dominant and non‐dominant hands was 2.46 sec (standard deviation [SD] = 3.02 sec; range = 1.85–3.48 sec). MEG sources and their temporal dynamics were derived separately for the left and right hemispheres of each subject, resulting in 16 MEG data sets. In each of the 16 data sets, the number of adequate dipoles used by MSST was six to eight for the MEG signal in the −800 to +30 msec interval. The exact number of adequately modeled dipoles varied among subjects (7 dipoles in 12 data sets, 7 dipoles in 3 data sets, and 8 dipoles in 1 data set).
Figure 1 demonstrates the general procedures for analyzing MEG data using MSST. We first carried out a downhill simplex search [Nelder and Mead, 1965] many times for a given model order (i.e., the number of dipoles to fit). Each time, the program selected a set of starting dipole locations (i.e., starting points) by randomly sampling a user‐selected search volume [Huang et al., 1998]. Figure 1A shows that to fit the MEG responses with six dipoles, 3,000 sets of starting locations were selected by randomly sampling a searching volume specified by a spherical shell: the ranges for ρ (radius), θ (elevation angle), and ϕ (azimuth angle) were 2–9 cm, 0–140 degrees, and 0–360 degrees, respectively. Each set contained 6 dipole locations indicated by 6 different colors in the plot. Figure 1C shows the measured magnetic fields from Subject 1's right index finger‐lifting response, in which the MEG waveforms from 122 channels are superimposed. After multiple searches were carried out, the sets of best‐fitting solutions with similar reduced‐χ2 values (i.e., in this case the 15 best‐fitting sets) formed six clusters for a six‐dipole fit, as shown in Figure 1B (asterisks). The centroids of these clusters are shown in Figure 1B as vertical lines. These solutions were averaged to obtain the six‐dipole locations, which are indicated by the x, y, and z coordinates of the vertical lines in Figure 1B. The predicted magnetic fields based on the six dipole locations from Figure 1B are plotted in Figure 1D and the residual (the difference between measured and predicted magnetic fields) is shown in Figure 1E. Finally, a Monte‐Carlo analysis [Medvick et al., 1989] was used to provide the statistical uncertainty of the dipole solutions from MSST. In this procedure, 300 sets of simulated gaussian random noise were added to the modeled MEG fields created by best‐fitting MSST solution. The level of each set of the random noise was set to be the same as for the −1,000‐msec to −800‐msec prestimulus noise interval. The noisy data were fitted back with the same model order as the fit of the original data using downhill simplex direct search algorithm and the perturbations to the MSST solution due to noise in terms of dipole locations were obtained.
Figure 1.
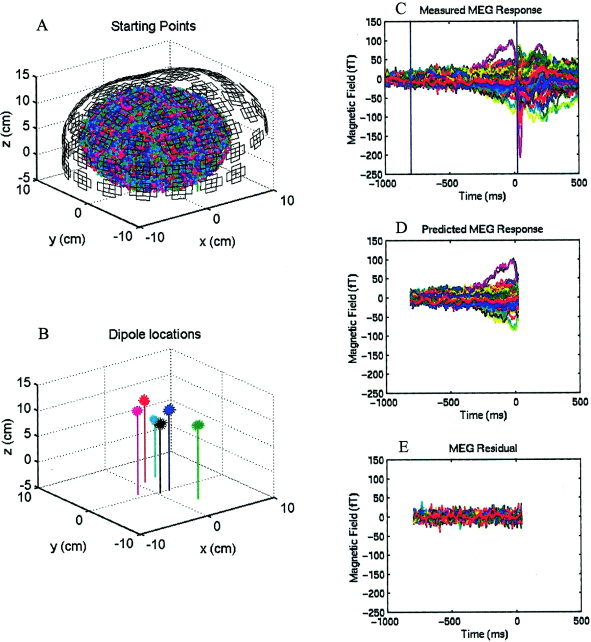
MSST analysis of the MEG recording during a right finger‐lifting response from Subject 1. A: In a six‐dipole fit, 3,000 sets of starting locations were selected randomly within a search volume. The MEG pick‐up coils are also shown. Each set contains six starting dipole locations indicated by six different colors. B: The 15 best‐fitting six‐dipole MSST solutions (indicated by asterisks) with similar reduced‐χ2 values form six clusters in space (x, anterior [+] posterior [−] coordinate; y, left [+] right (−) coordinate; z, superior [+] inferior [−] coordinate). Each vertical line represents the centroid of averaged dipole location for the cluster. C: Measured magnetic field waveforms from 122 MEG channels are superimposed. D: Predicted magnetic fields based on the dipole locations modeled in B. E: Residual magnetic fields, namely the difference between C and D.
Figure 2 shows six clustered dipoles (yellow clusters) localized from Subject 1's right finger‐lifting MEG response (shown in Fig. 1) and superimposed onto this subject's MRI. The six clusters fell within two standard deviations of the mean source locations derived from 300 Monte Carlo analyses. The clusters were localized in the contralateral and ipsilateral motor areas, supplementary motor area (SMA proper), contralateral lateral prefrontal region, posterior cingulate region, and contralateral superior parietal region.
Figure 2.
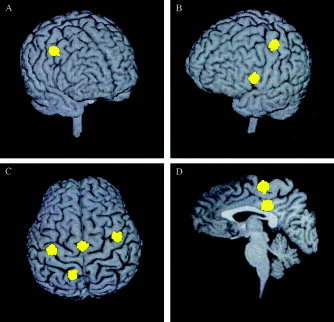
Six dipolar sources (yellow clusters) from Subject 1's right index finger‐lifting MEG response, localized using MSST, and superimposed on the subject's MRI. Three hundred Monte‐Carlo analyses were carried out to obtain the uncertainty of the dipole locations, defined as two standard deviations from the mean of the clustered locations. A: View from front‐right, the right (ipsilateral) hemisphere premotor area (PMA) source. B: View from front‐left, the left (contralateral) hemispheric primary motor area (M1) source and the left prefrontal source. C: View from top, the left M1 and right PMA sources, supplementary motor area (SMA), and left superior parietal source. D: Sagittal view through the interhemispheric fissure, SMA, and posterior cingulate sources.
The most consistent sources across all eight subjects were the contralateral motor source (in all 16 hemispheres), the ipsilateral motor source (in 15 of 16 cases), and the SMA (in 13 of 16 hemispheres), as shown in Figure 3. Blue clusters in Figure 3 represent activations due to left index finger‐lifting, whereas yellow clusters are activations due to right index finger‐lifting. The results from 300 Monte‐Carlo analyses are plotted, all of which fell within two standard deviations of the mean source location. The SMA was defined as the medial portion of BA 6 in the medial surface of the superior frontal gyrus, anterior to primary motor area of the lower extremity and above the cingulate sulcus [Penfield and Rasmussen, 1950; Penfield and Welch, 1951]. All 16 contralateral hemispheric motor sources were localized to the posterior aspect of precentral gyrus (anterior bank of the central sulcus) in M1 (BA 4). Among the 15 cases that showed ipsilateral hemispheric motor activations, and 12 were localized to the anterior aspect of precentral gyrus (posterior bank of the precentral sulcus) with localization uncertainty extending anterior to the precentral sulcus. The remaining three cases localized to the anterior bank of the precentral sulcus with uncertainty extending posterior to the precentral sulcus. All these ipsilateral hemispheric source locations were in the PMA, which was defined as the lateral aspect of BA 6 lying immediately in front of M1 [Carpenter, 1978]. At the hand level, PMA contains the anterior aspect of the precentral gyrus and extends to the gyrus anterior to the precentral sulcus. Relative to the M1 source generated by the movement of the contralateral hand, the location of the PMA source from ipsilateral finger movements was shifted anteriorly in all 15 hemispheres (mean ± SD, 9.2 ± 3.0 mm; P < 0.005), ventrally in 13 hemispheres (mean ± SD, 7.8 ± 3.1 mm; P < 0.01), and laterally in 11 hemispheres (mean ± SD, 4.5 ± 3.3 mm; P < 0.05). In the five subjects who showed SMA sources from both the left and right unilateral index finger‐lifting tasks, sources due to right index finger‐lifting were shifted to the left of the SMA due to left index finger‐lifting (mean ± SD, 3.6 ± 1.5 mm; P < 0.01).
Figure 3.
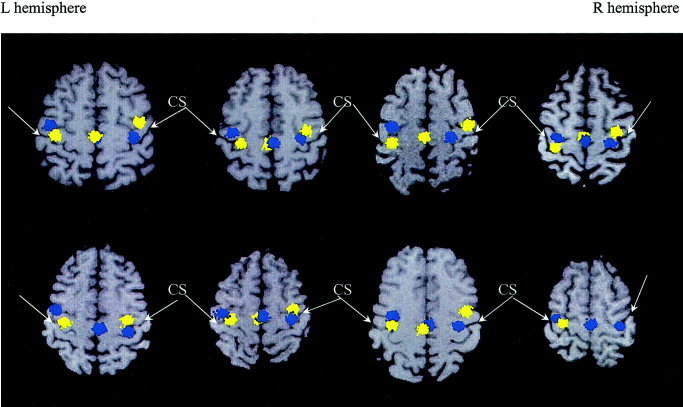
Contralateral primary motor (M1), ipsilateral premotor area (PMA), and supplementary motor area (SMA) sources across all eight subjects evoked by unilateral MEG index finger‐lifting were superimposed on individual subjects' MRI. Neurologic convention was adopted in the MR images. Blue clusters represent activations due to left index finger‐lifting, whereas the yellow clusters are activations due to right index finger‐lifting. The results from 300 Monte‐Carlo analyses are plotted.
To compare our source locations with those reported in related studies that used fMRI and PET, we obtained the Talairach coordinates [Talairach and Tournoux, 1988] of the MEG sources using the brain normalization software in SPM2, which uses a 12‐parameter affine transformation and a nonlinear deformation [Ashburner et al., 1997; Ashburner and Friston, 1999; Friston et al., 1995]. In this approach, the three fiducials (left PA, right PA, NA) of each individual subject's MRI were first identified using the MRI display function in SPM2 to create a transformation matrix between the MEG source coordinate system and the MRI coordinate system. This step was the same as the co‐registration procedure mentioned previously with Neuromag software. SPM2 was then used to normalize the subject's MRI into Talairach space and obtain a second transformation matrix. By combining these two transformation matrices, Talairach coordinates of the MEG sources for each individual subject were obtained. Table I lists the mean and SD of the Talairach coordinates for the MEG sources across the group.
Table I.
Talairach coordinates of the MEG sources in the finger‐lifting task
| MEG sources | Talairach coordinates, mm (mean ± SD) | ||
|---|---|---|---|
| x | y | z | |
| L finger‐lifting, L PMA (n = 8) | −38.0 ± 4.5 | −8.8 ± 6.8 | 51.7 ± 6.7 |
| L finger‐lifting, R M1 (n = 8) | 33.5 ± 4.3 | −20.1 ± 6.8 | 55.7 ± 5.2 |
| L finger‐lifting, SMA (n = 7) | 1.9 ± 2.0 | −19.3 ± 6.1 | 62.3 ± 6.9 |
| R finger‐lifting, R PMA (n = 7) | 39.5 ± 5.0 | −6.2 ± 8.0 | 49.8 ± 7.9 |
| R finger‐lifting, L M1 (n = 8) | −34.3 ± 3.6 | −20.3 ± 6.2 | 58.5 ± 6.7 |
| R finger‐lifting, SMA (n = 6) | −0.8 ± 3.1 | −20.3 ± 5.4 | 60.8 ± 6.4 |
Number of responses (n) in which a specific source was localizable is given for each MEG source.
MEG, magnetoencephalogram; SD, standard deviation; L, left; R, right; PMA, premotor area; M1, primary motor area; SMA, supplementary motor area.
Figure 4 shows the dipole time‐courses for the eight subjects. Figures 4A and 4B are the time‐courses for the left and right hemispheric motor sources due to finger lifting using the non‐dominant left hand. This figure compares the time courses of two motor sources in different hemispheres for the finger movement of the same hand. The peak latencies of the ipsilateral premotor area sources (indicated by vertical lines in Fig. 4) in the left hemisphere were markedly earlier than those of the contralateral M1 sources in the right hemisphere. The peak dipole strengths of the ipsilateral PMA sources were also markedly weaker than were those of the contralateral M1 sources. The time‐courses of the SMA sources are shown in Figure 4C. Their peak latencies are considerably earlier than were those of the contralateral M1 sources. The peak amplitudes of the SMA sources are similar to that of the ipsilateral PMC sources, but weaker than were those of the contralateral M1 sources.
Figure 4.

The time courses and dipole strengths of the ipsilateral premotor area (PMA), contralateral primary motor area (M1), and SMA due to finger lifting using the non‐dominant left hand (A–C) and the dominant right hand (D–F) for eight subjects. Time courses are color‐coded for each subject. Peak latencies of the sources for each subject are indicated by the vertical lines. Time courses of the contralateral M1 source (B and E) showed another visible weak peak (arrow), which was earlier than were the strongest peaks.
Similar results are shown in Figure 4D–F for finger lifting using the dominant right hand for the eight subjects. Furthermore, a weak peak was visible in 7 of 16 time courses of the contralateral M1 sources (two of them were indicated by arrows in Fig. 4B,E).
Figure 5A displays the peak latencies of the ipsilateral PMA and contralateral M1 sources in all the 15 finger‐lifting responses (8 left and 7 right finger‐lifting MEG responses) in which unilateral finger lifting generated both contralateral and ipsilateral motor sources among the 8 subjects. A paired t‐test showed that the peak latencies of the ipsilateral PMA source significantly preceded the peak latencies of the contralateral M1 ones by a mean value of 52.5 msec (t = 9.01, P < 0. 0001). The mean peak latency was −86.7 (SD = 29.0 msec) for the ipsilateral PMA activity and −34.2 (SD = 28.7 msec) for the contralateral M1 activity. The mean peak latency of the 13 SMA sources was −94.4 (SD = 20.2 msec), which was significantly earlier than was the peak latency of the contralateral hemispheric primary motor area sources (t = 8.47, P < 0. 0001). There was only a nonsignificant trend for SMA sources to appear earlier than did ipsilateral premotor area sources (t = 1.91, P = 0.08).
Figure 5.
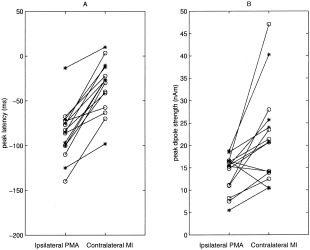
Peak latency (A) and peak dipole strength (B) of the ipsilateral PMA and contralateral MI sources in eight left finger‐lifting (circles) and seven right finger‐lifting (asterisks) studies for all eight subjects.
Figure 5B displays the peak dipole strengths of the ipsilateral PMA and contralateral M1 sources for each subject. The ipsilateral PMA sources were significantly weaker than were that of the contralateral M1 sources in 12 of 15 cases (t = 3.28, P < 0.01). The mean peak dipole amplitudes of the ipsilateral PMA and contralateral M1 sources were 13.8 (SD = 4.2 nAm) and 21.8 (SD = 10.6 nAm), respectively. The mean peak amplitude of the SMA dipole (12.4 ± 5.0) was also significantly less than that of the contralateral M1 source (t = 4.07, P < 0.01), but no significant difference was found between the peak amplitude of the SMA source and the ipsilateral PMA source (t = 1.37, P = 0.20).
To evaluate whether motor activity was related to possible hemispheric asymmetries for controlling movement, we compared the strength and time course of contralateral and ipsilateral motor sources generated by the non‐dominant and the dominant finger movements. Peak latency and peak dipole amplitude were not significantly different between the dominant and the non‐dominant hands for the ipsilateral hemispheric PMA source or for the contralateral hemispheric M1 source. We also analyzed the area under the dipole strength versus time curve for each motor source, which reflects the strength of contralateral and ipsilateral motor activity across the entire epoch (i.e., −800 to 30 msec interval). The mean area under the curve did not differ significantly between the non‐dominant (5.8 ± 1.1 nAm‐sec) and the dominant (5.9 ± 1.0 nAm‐sec) hand for the contralateral M1 sources. There was, however, a nonsignificant trend for the mean area under the curve to be greater for the left (4.8 ± 1.0 nAm‐sec) than the right (4.4 ± 0.8 nAm‐sec) hemisphere for the ipsilateral PMA sources (t = 2.0, P = 0.09).
DISCUSSION
Our results showed that before the onset of unilateral finger movements, both the contralateral and ipsilateral hemispheric motor areas were activated, consistent with previous MEG results [Cheyne et al., 1995; Volkmann et al., 1998]. We also demonstrated that within each hemisphere, the source location of ipsilateral motor activity was significantly anterior, inferior, and lateral to the source location of M1 associated with contralateral finger movement. Ipsilateral hemispheric motor activity was found in the PMA in BA 6 rather than M1 of BA 4. Such a difference in location agrees with some previous fMRI findings [Baraldi et al., 1999; Cramer et al., 1999], but not all [Dassonville et al., 1997; Kim et al., 1993; Rao et al., 1993; Solodkin et al., 2001; Wexler et al., 1997]. The discrepant results from fMRI may be due partly to the use of different conditions across studies to control for baseline activation, or a loss in spatial resolution due to warping subjects' brains to a standard atlas. It is noteworthy that ipsilateral M1 activation seems substantially weaker in subjects who show a strong hand preference [Dassonville et al., 1997]. Although we did not measure the degree of right‐hand preference in our study, this could explain the absence of ipsilateral M1 activity if most subjects had a strong hand preference. Other MEG studies have not observed different source locations for contralateral and ipsilateral motor areas [Cheyne et al., 1995; Hoshiyama et al., 1997; Kristeva et al., 1991; Nagamine et al., 1996; Taniguchi et al., 1998; Volkmann et al., 1998]. Our source localization results are in agreement with a study showing that ipsilateral muscle activity was generated by TMS stimulation 3 cm anterior and 3 cm lateral to Cz [Caramia et al., 2000], a scalp site remote from the ipsilateral M1, but quite close to the PMA. In addition, our results show that the peak latency of the ipsilateral PMA source is significantly earlier than was the peak latency of the contralateral M1 source. Collectively, the findings from the present study indicate that ipsilateral hemispheric activation generated from simple finger movements is associated with premotor function.
In our study, we noticed that the difference in the spatial location (in anterior, inferior, and lateral directions) of the motor sources during ipsilateral and contralateral finger movements was smaller than that reported by Cramer et al. [1999] using fMRI. Additionally, fMRI studies often report PMA activation in the hemisphere contralateral to movement [Catalan et al., 1998; Dassonville et al., 1998; Harrington et al., 2000; Rao et al., 1993; Wexler et al., 1997], whereas we observed only one contralateral source in M1. These discrepancies could result from modeling contralateral hemispheric M1 and PMA activities with one source. Specifically, due to the close proximity of source locations and overlap in time courses, our signal‐to‐noise ratio and MEG sensor density may not be able to resolve contralateral M1 and PMA sources. The spatial resolution for our MEG system is about 5 mm under favorable conditions (e.g., the time courses of the two sources are highly asynchronous; the primary neuronal currents are flowing in near‐orthogonal directions; and low noise level). The contralateral M1 and PMA sources do not satisfy all of these conditions because: (1) they are close in space and their temporal dynamics overlap; (2) their current flow is in a similar direction (anterior‐posterior direction); and (3) their separation in location (largely in the anterior‐posterior direction) happens to be similar to their common current‐flow orientation. It therefore may not be possible for us to distinguish contralateral M1 and PMA sources in the present study. The location of our contralateral M1 source may represent an average of the contralateral M1 and PMA sources, weighted toward the former due to its greater strength. This perhaps caused an underestimation of actual location differences in each hemisphere between the activation generated by contralateral hand movement and activation by ipsilateral hand movement, as mentioned above.
Interestingly, in 7 of 16 cases there was a visible weak peak with an earlier latency than the main peak in the time‐course of the contralateral motor source (see arrows in Fig. 4B and 4D). This finding can also be explained by the co‐existence of contralateral PMA and MI sources. The earlier peak may represent the contralateral PMA, which is weaker than the main contralateral M1 activation, and the time‐course of the modeled contralateral source may contain the temporal information from both sources. If the contralateral PMA source is too weak, it may not be visible in the time‐courses of the modeled contralateral M1 source. This may explain the absence of an earlier peak in the other 9 cases. In addition, as pointed out by one reviewer, some of the readiness activity shown in the time courses of contralateral MI (Fig. 4) may be from contralateral PMA, which we were unable to separate. In contrast, the ipsilateral PMA source in our study was robustly localized, because there was no confounding strong ipsilateral M1 source.
To our knowledge, this is the first study to report a significant difference between both the location and the peak latency of motor sources in the hemispheres ipsilateral and contralateral to unilateral finger movement. Our finding that the peak latency of the ipsilateral PMA source was significantly earlier than was the peak latency of contralateral M1 is consistent with the role of the PMA in the motor preparation process. Others have speculated that ipsilateral motor activation is due to inhibition of movements in homologous M1 that controls the unmoving limb [Allison et al., 2000; Cheyne et al., 1995; Cheyne and Weinberg, 1989; Kristeva et al., 1991]. Single‐cell recordings in monkeys, however, have shown that only a small number of neurons in M1 ipsilateral to hand movement were active [Aizawa et al., 1990; Matsunami and Hamada, 1981; Tanji et al., 1988; Wannier et al., 1986]. These findings cast doubt on the inhibition hypothesis of ipsilateral M1 activation. In addition, this hypothesis did not provide a compelling explanation of our results because ipsilateral and contralateral motor activation were spatially distinct, located in motor areas that regulate different functions. The PMA exhibits a far more complex relationship with movement characteristics than does M1. Unlike M1, activation in PMA is more sensitive to movement‐related conditional cues [Kurata and Hoffman, 1994] and sequence‐specific properties of movement [Kettner et al., 1996; Kurata, 1991; Mushiake et al., 1991]. PMA activation also is associated with the complexity of planning movements [Catalan et al., 1998; Dassonville et al., 1998; Harrington et al., 2000; Sadato et al., 1996; Solodkin et al., 2001], whereas a similar relationship with M1 activation can usually be attributed to an increase in the number of active muscle groups [Gordon et al., 1998; Rao et al., 1993; Shibasaki et al., 1993; Solodkin et al., 2001; Wexler et al., 1997]. Although M1 showed preparatory activity in our study, others have demonstrated that activation in PMA, but not M1, increases with the difficulty of preparing movement sequences [Dassonville et al., 1998; Schluter et al., 2001].
We also consistently modeled neuronal activation in the SMA proper, which has dense corticocortical input into both the PMA [Kurata, 1991] and M1 [Picard and Strick, 1996]. The peak latency of SMA activation preceded the peak latency in M1, and there was a trend for it to occur slightly earlier than in ipsilateral PMA. These results are consistent with fMRI studies showing an earlier time‐course in the hemodynamic response for SMA than for M1 [Lee et al., 1999; Richter et al., 1997; Weilke et al., 2001]; however, the present study further demonstrates that the difference in the time course is on the order of 60 msec for self‐paced finger movements. Although its specific role remains elusive, SMA activation has been associated broadly with planning movements [Tanji, 1996]. Separating the functional roles of SMA and PMA has been challenging, because activation in both regions typically correlates with many of the same behavioral functions, including the difficulty of preparing a response [Deiber et al., 1996]. Taken together, the localization and time course of SMA and ipsilateral PMA activation in our study is consistent with the roles of these regions in planning or preparation functions during voluntary movement, and further supports the validity of the source locations modeled in this study for self‐paced finger movements.
In the present study, we were unable to find significant asymmetry in peak source strength between the left and right hemispheres, similar to other MEG studies [Kristeva et al., 1991; Taniguchi et al., 1998]. These results contrast with fMRI reports of a left hemisphere bias in M1 and PMA for controlling movement [Kim et al., 1993; Mattay et al., 1998; Schluter et al., 2001; Solodkin et al., 2001; Ziemann and Hallett, 2001] and focal lesion data showing a left hemisphere bias in representing movement [Haaland and Harrington, 1996]. We believe that the discrepancy between our results and others may be explained by differences between MEG and fMRI or PET in the physiologic measures of brain activity. First, hemispheric asymmetry in fMRI and PET is exhibited typically by volume of activated tissue. In contrast, in MEG certain assumptions about the sources are made. Our source model assumed that activation was focal and could be modeled by point sources; therefore, the source volume is not available directly from model parameters. When we analyzed the strength of activation across the entire interval of −800 to 0 msec (i.e., area under the curve), there was a trend for stronger left hemisphere activation in ipsilateral PMA. This suggests that with a larger sample size than that in the present study, a left hemispheric asymmetry might emerge more clearly when activation strength is assessed throughout the epoch rather than during a single point in time (i.e., only peak dipole strength) as in previous MEG studies [Kristeva et al., 1991; Taniguchi et al., 1998]. Second, most fMRI and PET studies use blocked designs, so that it is not possible to distinguish hemispheric asymmetries due to preparation for movement from those associated with executing movements. This contrasts with our study in which we specifically analyzed neural activity during the motor preparation and early execution phase of movement. Accurately modeling the M1 and PMA activity after the movement onset is difficult in MEG due to the strong somatosensory contamination after the movement onset [Inase et al., 1989]. If the activation after movement onset contributes significantly to the hemispheric asymmetry, however, this would not be detected in the present study. Studies distinguishing the contribution of planning and motor execution processes to hemispheric biases are needed to directly address this issue.
In conclusion, this is the first MEG study to demonstrate the precise temporal dynamics of neural activation in SMA, ipsilateral PMA, and contralateral M1 during self‐paced finger movements. Although the role of ipsilateral PMA and SMA activation remains a matter of debate, both seem to play an important role in recovery from stroke. In stroke patients carrying out movement using the affected hand, enhanced activation has been observed in the SMA and ipsilateral M1 and PMA [Cramer et al., 1997; Marshall et al., 2000; Weiller, 1998]. During TMS, motor evoked potentials (MEP) from PMA in the hemisphere ipsilateral to the stroke‐affected hand correlated with the recovery of the sensorimotor function in stroke patients [Caramia et al., 2000]. These findings suggest an increased role of ipsilateral PMA and the SMA in controlling movement of the stroke‐affected hand, perhaps because formerly simple, highly skilled movements become more dependent upon explicit planning processes. Future studies examining the source location and temporal dynamics of neuronal activity in these regions may provide additional insight into the role of ipsilateral motor areas in both normal movement and recovery of function after brain damage.
Acknowledgements
We thank the reviewers for thoughtful and conscientious critiques, which significantly strengthened the article.
REFERENCES
- Aine C, Huang M, Stephen J, Christner R (2000): Multi‐start algorithms for MEG empirical data analysis reliably characterize locations and time‐courses of multiple sources. Neuroimage 12: 159–172. [DOI] [PubMed] [Google Scholar]
- Aizawa H, Mushiake H, Inase M, Tanji J (1990): An output zone of the monkey primary motor cortex specialized for bilateral hand movement. Exp Brain Res 82: 219–221. [DOI] [PubMed] [Google Scholar]
- Allison JD, Meador KJ, Loring DW, Figueroa RE, Wright JC (2000): Functional MRI cerebral activation and deactivation during finger movement. Neurology 54: 135–142. [DOI] [PubMed] [Google Scholar]
- Ashburner J, Friston KJ (1999): Nonlinear spatial normalization using basis functions. Hum Brain Mapp 7: 254–266. [DOI] [PMC free article] [PubMed] [Google Scholar]
- Ashburner J, Neelin P, Collins DL, Evans AC, Friston KJ (1997): Incorporating prior knowledge into image registration. Neuroimage 6: 344–352. [DOI] [PubMed] [Google Scholar]
- Babiloni C, Carducci F, Pizzella V, Indovina I, Romani GL, Rossini PM, Babiloni F (1999): Bilateral neuromagnetic activation of human primary sensorimotor cortex in preparation and execution of unilateral voluntary finger movements. Brain Res 827: 234–236. [DOI] [PubMed] [Google Scholar]
- Baraldi P, Porro CA, Serafini M, Pagnoni G, Murari C, Corazza R, Nichelli P (1999): Bilateral representation of sequential finger movements in human cortical area. Neurosci Lett 269: 95–98. [DOI] [PubMed] [Google Scholar]
- Berg P, Scherg M (1994): Handbook of BESA: brain electric source analysis, v 2.0. Munich: MEGIS. [Google Scholar]
- Boussaoud D, Pellegrino G, Wise SP (1996): Frontal lobe mechanisms subserving vision‐for‐action vs. vision‐for‐perception. Behav Brain Res 72: 1–15. [DOI] [PubMed] [Google Scholar]
- Caramia MD, Palmieri MG, Giacomini P, Iani C, Dally L, Silvestrini M (2000): Ipsilateral activation of the unaffected motor cortex in patients with hemiparetic stroke. Clin Neurophysiol 111: 1990–1996. [DOI] [PubMed] [Google Scholar]
- Carpenter MB (1978): Core text of neuroanatomy. Baltimore: Williams and Wilkins; p 286–306. [Google Scholar]
- Catalan MJ, Honda M., Weeks RA, Cohen LG, Hallett M (1998): The functional neuroanatomy of simple and complex sequential finger movements: a PET study. Brain 121: 253–264. [DOI] [PubMed] [Google Scholar]
- Cheyne D, Weinberg H (1989): Neuromagnetic fields accompanying unilateral finger movements: pre‐movement and movement‐evoked fields. Exp Brain Res 78: 604–612. [DOI] [PubMed] [Google Scholar]
- Cheyne D, Weinberg H, Gaetz W, Jantzen KJ (1995): Motor cortex activity and predicting side of movement: neural network and dipole analysis of pre‐movement magnetic fields. Neurosci Lett 188: 81–84. [DOI] [PubMed] [Google Scholar]
- Cramer SC, Finklestein SP, Schaechter JD, Bush G, Rosen BR (1999): Activation of distinct motor cortex regions during ipsilateral and contralateral finger movements. J Neurophysiol 81: 383–387. [DOI] [PubMed] [Google Scholar]
- Cramer SC, Nelles G, Benson RR, Kaplan JD, Parker RA, Kwong KK, Kennedy DN, Finklestein SP, Rosen BR (1997): A functional MRI study of subjects recovered from hemiparetic stroke. Stroke 28: 2518–2527. [DOI] [PubMed] [Google Scholar]
- Dassonville P, Lewis SM, Zhu XH, Ugurbil K, Kim SG, Ashe J (1998): Effects of movement predictability on cortical motor activation. Neurosci Res 32: 65–74. [DOI] [PubMed] [Google Scholar]
- Dassonville P, Zhu XH, Uurbil K, Kim SG, Ashe J (1997): Functional activation in motor cortex reflects the direction and the degree of handedness. Proc Natl Acad Sci USA 94: 14015–14018. [DOI] [PMC free article] [PubMed] [Google Scholar]
- Deiber MP, Ibanez V, Sadato N, Hallett M (1996): Cerebral structures participating in motor preparation in humans: a positron emission tomography study. J Neurophysiol 75: 233–247. [DOI] [PubMed] [Google Scholar]
- Dum RP, Strick PL (1991): The origin of corticospinal projections from the premotor areas in the frontal lobe. J Neurosci 11: 667–689. [DOI] [PMC free article] [PubMed] [Google Scholar]
- Ferguson AS, Zhang X, Stroink G (1994): A complete linear discretization for calculating the magnetic field using the boundary element method. IEEE Trans Biomed Eng 41: 455–459. [DOI] [PubMed] [Google Scholar]
- Friston KJ, Ashburner J, Frith CD, Poline JB, Heather JD, Frackowiak RS (1995): Spatial registration and normalization of images. Hum Brain Mapp 2: 165–189. [Google Scholar]
- Golub GH, Van Loan CF (1984): Matrix computations, second edition. Baltimore: Johns Hopkins University Press. [Google Scholar]
- Gordon AM, Lee JH, Flament D, Ugurbil K (1998): Functional magnetic resonance imaging of motor, sensory, and posterior parietal cortical areas during performance of sequential typing movements. Exp Brain Res 121: 153–166. [DOI] [PubMed] [Google Scholar]
- Haaland KY, Harrington DL (1994): Limb‐sequencing deficits after left but not right hemisphere damage. Brain Cogn 24: 104–122. [DOI] [PubMed] [Google Scholar]
- Haaland KY, Harrington DL (1996): Hemispheric asymmetry of movement. Curr Opin Neurobiol 6: 796–800. [DOI] [PubMed] [Google Scholar]
- Hämäläinen MS, Sarvas J (1989): Realistic conductor geometry model of the human head for interpretation of neuromagnetic data. IEEE Trans Biomed Eng 36: 165–171. [DOI] [PubMed] [Google Scholar]
- Hansen PC (1997): Rank‐deficit and discrete ill‐posed problems: numerical aspects of linear inversion. Philadelphia, PA: SIAM. [Google Scholar]
- Hari R, Imada T (1999): Ipsilateral movement‐evoked fields reconsidered. Neuroimage 10: 582–588. [DOI] [PubMed] [Google Scholar]
- Harrington DL, Haaland KY (1991): Sequencing in Parkinson's disease. Abnormalities in programming and controlling movement. Brain 114: 99–115. [PubMed] [Google Scholar]
- Harrington DL, Rao SM, Haaland KY, Bobholz JA, Mayer AR, Binderx JR, Cox RW (2000): Specialized neural systems underlying representations of sequential movements. J Cogn Neurosci 12: 56–77. [DOI] [PubMed] [Google Scholar]
- Hoshiyama M, Kakigi R, Berg P, Koyama S, Kitamura Y, Shimojo M, Watanabe S, Nakamura A (1997): Identification of motor and sensory brain activities during unilateral finger movement: spatiotemporal source analysis of movement‐associated magnetic fields. Exp Brain Res 115: 6–14. [DOI] [PubMed] [Google Scholar]
- Huang M, Aine CJ, Supek S, Best E, Ranken D, Flynn ER (1998): Multi‐start downhill simplex method for spatio‐temporal source localization in magnetoencephalography. Electroencephalogr Clin Neurophysiol 108: 32–44. [DOI] [PubMed] [Google Scholar]
- Huang M, Aine C, Davis L, Butman J, Christner R, Weisend W, Stephen J, Meyer J, Silveri J, Herman M, Lee RR (2000): Sources on the anterior and posterior banks of the central sulcus identified from magnetic somatosensory evoked responses using multi‐start spatio‐temporal localization. Hum Brain Mapp 11: 59–76. [DOI] [PMC free article] [PubMed] [Google Scholar]
- Ilmoniemi RJ, Hämäläinen MS, Knuutila J (1985): The forward and inverse problems in the spherical model In: Weinberg H, Stroink G, Katila T, editors. Biomagnetism: applications and theory. New York: Pergamon; p 278–282. [Google Scholar]
- Inase M, Mushiake H, Shima K, Aya K, Tanji J (1989): Activity of digital area neurons of the primary somatosensory cortex in relation to sensorially triggered and self‐initiated digital movements of monkeys. Neurosci Res 7: 219–234. [DOI] [PubMed] [Google Scholar]
- Kawashima R, Inoue K, Sugiura M, Okada K, Ogawa A, Fukuda H (1999): A positron emission tomography study of self‐paced finger movements at different frequencies. Neurosci 92: 107–112. [DOI] [PubMed] [Google Scholar]
- Kawashima R, Matsumura M, Sadato N, Naito E, Waki A, Nakamura S, Matsumari K, Hiroshi Fukuda H, Yonekrura Y (1998): Regional cerebral blood flow changes in human brain related to ipsilateral and contralateral complex hand movements—a PET study. Eur J Neurosci 10: 2254–2260. [DOI] [PubMed] [Google Scholar]
- Kettner RE, Marcario JK, Clark‐Phelps MC (1996): Control of remembered‐reaching sequences in monkeys: I. Activity during movement in motor and premotor cortex. Exp Brain Res 112: 335–346. [DOI] [PubMed] [Google Scholar]
- Kim SG, Ashe J, Hendrich K, Ellermann JM, Merkle H, Ugurbil K, Georgopoulos AP (1993): Functional magnetic resonance imaging of motor cortex: hemispheric asymmetry and handedness. Science 261: 615–617. [DOI] [PubMed] [Google Scholar]
- Kimura D (1977): Acquisition of a motor skill after left‐hemisphere damage. Brain 100: 527–542. [DOI] [PubMed] [Google Scholar]
- Kimura D, Archibald Y (1974): Motor functions of the left hemisphere. Brain 97: 337–350. [DOI] [PubMed] [Google Scholar]
- Knösche TR, Berends EM, Jagers HRA, Peters MJ (1998): Determining the number of independent sources of the EEG: a simulation study on information criteria. Brain Topogr 11: 111–124. [DOI] [PubMed] [Google Scholar]
- Kristeva R, Cheyne D, Lang W, Lindinger G, Deecke L (1990): Movement‐related potentials accompanying unilateral and bilateral finger movements with different inertial loads. Electroencephalogr Clin Neurophysiol 75: 410–418. [DOI] [PubMed] [Google Scholar]
- Kristeva R, Cheyne D, Deecke L (1991): Neuromagnetic fields accompanying unilateral and bilateral voluntary movements: topography and analysis of cortical sources. Electroencephalogr Clin Neurophysiol 81: 284–298. [DOI] [PubMed] [Google Scholar]
- Kurata K (1991): Corticocortical inputs to the dorsal and ventral aspects of the premotor cortex of macaque monkeys. Neurosci Res 12: 263–280. [DOI] [PubMed] [Google Scholar]
- Kurata K, Hoffman DS (1994): Differential effects of muscimol microinjection into dorsal and ventral aspects of the premotor cortex of monkeys. J Neurophysiol 71: 1151–1164. [DOI] [PubMed] [Google Scholar]
- Lang W, Obrig H, Lindinger G, Cheyne D, Deecke L (1990): Supplementary motor area activation while tapping bimanually different rhythms in musicians. Exp Brain Res 79: 504–514. [DOI] [PubMed] [Google Scholar]
- Larsson J, Gulyas B, Roland PE (1996): Cortical representation of self‐paced finger movement. Neuroreport 7: 463–468. [DOI] [PubMed] [Google Scholar]
- Leahy RM, Mosher JC, Spencer ME, Huang MX, Lewine JD (1998): A study of dipole localization accuracy for MEG and EEG using a human skull phantom. Electroencephalogr Clin Neurophysiol 107: 159–173. [DOI] [PubMed] [Google Scholar]
- Lee KM, Chang KH, Roh KJ (1999): Subregions within the supplementary motor area activated at different stages of movement preparation and execution. Neuroimage 9: 117–123. [DOI] [PubMed] [Google Scholar]
- Marshall RS, Perera GM, Lazar RM, Krakauer JW, Constantine RC, DeLaPaz RL (2000): Evolution of cortical activation during recovery from corticospinal tract infarction. Stroke 31: 656–661. [DOI] [PubMed] [Google Scholar]
- Matsunami K, Hamada I (1981): Characteristics of the ipsilateral movement‐related neuron in the motor cortex of the monkey. Brain Res 204: 29–42. [DOI] [PubMed] [Google Scholar]
- Mattay VS, Callicott JH, Bertolino A, Santha AK, Van Horn JD, Tallent KA, Frank JA, Weinberger DR (1998): Hemispheric control of motor function: a whole brain echo planar fMRI study. Psychiatry Res 83: 7–22. [DOI] [PubMed] [Google Scholar]
- Mattay VS, Frank JA, Santha AK, Pekar JJ, Duyn JH, McLaughlin AC, Weinberger DR (1996): Whole‐brain functional mapping with isotropic MR imaging. Radiology 201: 399–404. [DOI] [PubMed] [Google Scholar]
- Medvick PA, Lewis PS, Aine C, Flynn ER (1989): Monte‐Carlo analysis of localization errors in magnetoencephalography In: Williamson SJ, Hoke M, Stroink G, Kotani M, editors. Advances in biomagnetism. New York: Plenum Press; p 543–546. [Google Scholar]
- Mejis JWH, Bosch FGC, Peters MJ, Lopes da Silva FH (1987): On the magnetic field distribution generated by a dipolar current source situated in a realistically shaped compartment model of the head. Electroencephalogr Clin Neurophysiol 66: 286–298. [DOI] [PubMed] [Google Scholar]
- Mushiake H, Inase M, Tanji J (1991): Neuronal activity in the primate premotor, supplementary, and precentral motor cortex during visually‐guided and internally‐determined sequential movements. J Neurophysiol 66: 705–718. [DOI] [PubMed] [Google Scholar]
- Nagamine T, Kajola M, Salmelin R, Shibasaki H, Hari R (1996): Movement‐related slow cortical magnetic fields and changes of spontaneous MEG‐ and EEG‐brain rhythms. Electroencephalogr Clin Neurophysiol 99: 274–286. [DOI] [PubMed] [Google Scholar]
- Nelder JA, Meed R (1965): A simplex method for function minimization. Comput J 7: 308–313. [Google Scholar]
- Neuromag Ltd. (1996): Neuromag source modeling user's manual, v 4.4. Helsinki, Finland: Neuromag Ltd. [Google Scholar]
- Okada YC, Papuashvili N, Xu C (1996): What can we learn from MEG studies of the somatosensory system of the swine? Electroencephalogr Clin Neurophysiol Suppl 47: 35–46. [PubMed] [Google Scholar]
- Palmer E, Ashby P, Hajek VE (1992): Ipsilateral fast corticospinal pathways do not account for recovery in stroke. Ann Neurol 32: 519–525. [DOI] [PubMed] [Google Scholar]
- Penfield W, Rasmussen T (1950): The cerebral cortex of man, a clinical study of localization of function. New York: Macmillan. [Google Scholar]
- Penfield W, Welch K (1951): The supplementary motor area of the cerebral cortex; a clinical and experimental study. AMA Arch Neurol Psychiatry 66: 289–317. [DOI] [PubMed] [Google Scholar]
- Petrides M, Pandya DN (1984): Projections to the frontal cortex from the posterior parietal region in the rhesus monkey. J Comp Neurol 228: 105–116. [DOI] [PubMed] [Google Scholar]
- Picard N, Strick PL (1996): Motor areas of the medial wall: a review of their location and functional activation. Cereb Cortex 6: 342–353. [DOI] [PubMed] [Google Scholar]
- Rao SM, Binder JR, Bandettini PA, Hammeke TA, Yetkin FZ, Jesmanowicz A, Lisk LM, Morris GL, Mueller WM, Estkowski LD, Wong EC, Haughton VM, Hyde JS (1993): Functional magnetic resonance imaging of complex human movement. Neurology 43: 2311–2318. [DOI] [PubMed] [Google Scholar]
- Rao SM, Harrington DL, Haaland KY, Bobholz JA, Cox RW, Binder JR (1997): Distributed neural systems underlying the timing of movements. J Neurosci 17: 5528–5535. [DOI] [PMC free article] [PubMed] [Google Scholar]
- Richter W, Andersen PM, Georgopoulos AP, Kim SG (1997): Sequential activity in human motor areas during a delayed cued finger movement task studied by time‐resolved fMRI. Neuroreport 8: 1257–1261. [DOI] [PubMed] [Google Scholar]
- Rizzolatti G, Fadiga L, Gallese V, Fogassi L (1996): Premotor cortex and the recognition of motor actions. Brain Res Cogn Brain Res 3: 131–141. [DOI] [PubMed] [Google Scholar]
- Sabatini U, Chollet F, Rascol O, Celsis P, Rascol A, Lenzi GL, Marc‐Vergnes JP (1993): Effect of side and rate of stimulation on cerebral blood flow changes in motor areas during finger movements in humans. J Cereb Blood Flow Metab 13: 639–645. [DOI] [PubMed] [Google Scholar]
- Sadato N, Campbell G, Ibanez V, Deiber M, Hallett M (1996): Complexity affects regional cerebral blood flow change during sequential finger movements. J Neurosci 16: 2691–2700. [DOI] [PMC free article] [PubMed] [Google Scholar]
- Salmelin R, Forss N, Knuutila J, Hari R (1995): Bilateral activation of the human somatomotor cortex by distal hand movements. Electroencephalogr Clin Neurophysiol 95: 444–452. [DOI] [PubMed] [Google Scholar]
- Sarvas J (1987): Basic mathematical and electromagnetic concepts of the biomagnetic inverse problems. Phys Med Biol 32: 11–22. [DOI] [PubMed] [Google Scholar]
- Schlitt H, Heller L, Aaron R, Best E, Ranken D (1995): Evaluation of boundary element method for the EEG forward problem: effect of linear interpolation. IEEE Trans Biomed Eng 42: 52–58. [DOI] [PubMed] [Google Scholar]
- Schluter ND, Krams M, Rushworth MFS, Passingham RE (2001): Cerebral dominance for action in the human brain: the selection of actions. Neuropsychologia 39: 105–113. [DOI] [PubMed] [Google Scholar]
- Sekihara K, Poeppel D, Marantz A, Koizumi H, Miyashita Y (1997): Noise covariance incorporated MEG‐MUSIC algorithm: a method for multiple‐dipole estimation tolerant of the influence of background brain activity. IEEE Trans Biomed Eng 44: 839–847. [DOI] [PubMed] [Google Scholar]
- Sekihara K, Poeppel D, Marantz A, Koizumi H, Miyashita Y (1999): MEG spatio‐temporal analysis using a covariance matrix calculated from nonaveraged multiple‐epoch data. IEEE Trans Biomed Eng 46: 515–521. [DOI] [PubMed] [Google Scholar]
- Shadmehr R, Holcomb HH (1997): Neural correlates of motor memory consolidation. Science 277: 821–825. [DOI] [PubMed] [Google Scholar]
- Shibasaki H, Sadato N, Lyshkow H, Yonekura Y, Honda M, Nagamine T, Suwazono S, Mageta Y, Ikeda A, Miyazaki M, Fukuyama H, Asato R, Konishi J (1993): Both primary motor cortex and supplementary motor area play an important role in complex finger movement. Brain 116: 1387–1398. [DOI] [PubMed] [Google Scholar]
- Solodkin A, Hlustik P, Noll DC, Small SL (2001): Lateralization of motor circuits and handedness during finger movements. Eur J Neurol 8: 425–434. [DOI] [PubMed] [Google Scholar]
- Talairach J, Tournoux P (1988): Co‐planar stereotactic atlas of the human brain. Stuttgart: Thieme. [Google Scholar]
- Taniguchi M, Yoshimine T, Cheyne D, Kato A, Kihara T, Ninomiya H, Hirata M, Hirabuki N, Nakamura H, Hayakawa T (1998): Neuromagnetic fields preceding unilateral movements in dextrals and sinistrals. Neuroreport 9: 1497–1502. [DOI] [PubMed] [Google Scholar]
- Tanji J (1996): New concepts of the supplementary motor area. Curr Opin Neurobiol 6: 782–787. [DOI] [PubMed] [Google Scholar]
- Tanji J, Okano K, Sato KC (1988): Neuronal activity in cortical motor areas related to ipsilateral, contralateral, and bilateral digit movements of the monkey. J Neurophysiol 60: 325–343. [DOI] [PubMed] [Google Scholar]
- Tarkka IM, Hallett M (1990): Cortical topography of premotor and motor potentials preceding self‐paced, voluntary movement of dominant and non‐dominant hands. Electroencephalogr Clin Neurophysiol 75: 36–43. [DOI] [PubMed] [Google Scholar]
- Urbano A, Babiloni C, Onorati P, Carducci F, Ambrosini A, Fattorini L, Babiloni F (1998): Responses of human primary sensorimotor and supplementary motor areas to internally triggered unilateral and simultaneous bilateral one‐digit movements. A high‐resolution EEG study. Eur J Neurosci 10: 765–770. [DOI] [PubMed] [Google Scholar]
- Volkmann J, Schnitzler A, Witte OW, Freund H (1998): Handedness and asymmetry of hand representation in human motor cortex. J Neurophysiol 79: 2149–2154. [DOI] [PubMed] [Google Scholar]
- Wannier TMJ, Toeltle M, Hepp‐Reymond MC (1986): On the problem of multiple hand representation in area 4 of the alert Macaca fascicularis . Experientia 42: 711. [Google Scholar]
- Wassermann EM, Fuhr P, Cohen LG, Hallett M (1991): Effects of transcranial magnetic stimulation on ipsilateral muscles. Neurology 41: 1795–1799. [DOI] [PubMed] [Google Scholar]
- Weilke F, Spiegel S, Boecker H, Von Einsiedel HG, Conrad B, Schwaiger M, Erhard P (2001): Time‐resolved fMRI of activation patterns in M1 and SMA during complex voluntary movement. J Neurophysiol 85: 1858–1863. [DOI] [PubMed] [Google Scholar]
- Weiller C (1998): Imaging recovery from stroke. Exp Brain Res 123: 13–17. [DOI] [PubMed] [Google Scholar]
- Wexler BE, Fulbright RK, Lacadie CM, Skudlarski P, Kelz MB, Constable RT, Gore JC (1997): An fMRI study of the human cortical motor system response to increasing functional demands. Magn Reson Imaging 15: 385–396. [DOI] [PubMed] [Google Scholar]
- Wise SP, Boussaoud D, Johnson PB, Caminiti R (1997): Premotor and parietal cortex: corticocortical connectivity and combinatorial computations. Annu Rev Neurosci 20: 25–42. [DOI] [PubMed] [Google Scholar]
- Ziemann U, Hallett M (2001): Hemispheric asymmetry of ipsilateral motor cortex activation during unimanual motor tasks: further evidence for motor dominance. Clin Neurophysiol 112: 107–113. [DOI] [PubMed] [Google Scholar]