

Abstract
Magnetic resonance (MR) acoustic scanner noise may negatively affect the performance of functional magnetic resonance imaging (fMRI), a problem that worsens at the higher field strengths proposed to enhance fMRI. We present an overview of the current knowledge on the effects of confounding acoustic MR noise in fMRI experiments. The principles and effectiveness of various methods to reduce acoustic noise in fMRI are discussed, practical considerations are addressed and recommendations are made. Hum. Brain Mapping 20:123–141, 2003. © 2003 Wiley‐Liss, Inc.
Keywords: MRI, fMRI, EPI, acoustic noise, SPL, acoustic noise reduction
INTRODUCTION
Within the last decade, functional magnetic resonance imaging (fMRI) has evolved into a widely used technique for functional brain imaging [Belliveau et al., 1991] that provides valuable insights into sensory, motor, and cognitive brain processing [Cacace et al., 2000]. Briefly, fMRI is based on quantifying the increase in regional cerebral blood flow as a response to activation of brain regions [Ogawa et al., 1993], which can be made visible by proportionate changes in the blood oxygen level dependent (BOLD) MR contrast [Ogawa et al., 1990]. The MR signal changes are generally small, in the range of 5–7% at 1.5 T [Bernal and Altman, 2001], and careful composition of stimuli and tasks for evoking brain activation and their presentation in complex paradigms is essential for inducing distinct BOLD responses. The statistical inferences to be drawn (relating stimulus presentation to BOLD response) are, therefore, vulnerable to various sources of errors [Josephs et al., 1999].
An important confounding factor caused by the MR imager itself is acoustic noise [Cacace et al., 2000; Cho et al., 1997]. Intense sound levels are generated during imaging that may interfere with the mapping of brain functions [Cho et al., 1997]. A particular problem in the auditory system is that the MR‐generated acoustic noise evokes undesirable BOLD signals [Shah et al., 1999]. In other brain regions, acoustic noise may spoil fMRI experiments, primarily by way of other mechanisms such as distraction [Cho et al., 1998].
The acoustic issue in fMRI is likely to expand with increasing use of high performance MR systems, most of them at 1.5 T, that are suitable for demanding echo planar imaging (EPI) with high spatial resolution [de Zwart et al., 2002]. Moreover, the current trend to higher field strength systems of >7 T for human fMRI [Yacoub et al., 2001a], illustrated by the recent FDA approval for clinical fMRI at 4.0 T [Campeau et al., 2001], makes the acoustic problem even more important, as acoustic noise levels increase with the magnetic field strength [Moelker et al., 2003a].
This study presents a systematic overview of the various aspects of MR‐related acoustic noise with regard to fMRI experiments: (1) a description of the multiple sources of acoustic noise in the MR environment, (2) the mechanisms and (3) extent of the interference with regard to both the stimulus and cortical activation, (4) methods for sound reduction that are currently used or are under investigation, and (5) practical considerations and recommendations to minimize the effects of MR‐generated acoustic noise on functional brain mapping.
SOUND GENERATION IN THE MR ENVIRONMENT
There are multiple different sources of acoustic noise in the MR imager. In descending order of relative contribution to the overall sound pressure level (SPL), these are: (1) the gradient currents, (2) eddy currents, (3) radio frequency (RF) and slice‐selection pulses and, as a non‐imaging related entity, (4) ambient or background noise.
Gradient Currents
The interactions between the fluctuating readout and phase encoding currents in the gradient coils and the main static magnetic field of the MR scanner evoke Lorentz forces that act on the gradient coils and their connecting wires [Edelstein et al., 2002; Mansfield et al., 1994, 1995, 1998; Mansfield and Haywood, 2000]. As a result, the coils and wires buckle and bend inducing compressional waves in the surrounding gradient supports. Subsequently, these compressional waves are conducted toward the peripheral structures of the MR system, such as the main magnet, and launched into air as acoustic sound. The Lorentz forces increase logarithmically with the magnetic field strength and the applied gradient current [Mansfield et al., 1998]. Noise levels, therefore, also increase with both stronger magnetic field strengths and gradient currents [Moelker et al., 2003a; Price et al., 2001]. During EPI, the most extensively employed pulse sequence in fMRI [Parrish, 1999], equivalent‐continuous SPLs range from 90–117 dB at 1.5 T and from 105–133 dB at 3.0 T. Peak levels are even higher: up to 130 and 140 dB at 1.5 T and 3 T, respectively [Cho et al., 1997; Foster et al., 2000; Miyati et al., 1999, 2001; Moelker et al., 2003a; Price et al., 2000; Prieto et al., 1998, 1999; Shellock et al., 1998].
The frequency distribution of the gradient sounds is relevant to the confounding effects of acoustic noise on fMRI and the efficacy of noise reduction techniques (see below). The range of frequencies that are present in the imager noise is dictated by both the spectral shape of the gradient current (or pulse sequence) and the mechanical construction of the MR imager [Hedeen and Edelstein, 1997]. Pulse sequences are periodic with a fundamental frequency (reciprocal of the period) and harmonics, the latter being multiples of the fundamental frequency. The fundamental frequency can be extracted from the gradient current by means of a Fourier transform [Hedeen and Edelstein, 1997; Hennel et al., 1999; Ravicz et al., 2000]. In EPI the fast succession of alternating readout and phase encoding gradient currents results in the appearance of a relatively high, audible, fundamental frequency of (in one reported instance) 1.9 kHz with softer but still audible harmonics at 3.8, 5.8, 7.7, and 9.6 kHz [Foster et al., 2000]. Most MR imagers do not generate these pure tones in isolation, rather a complex, broadband acoustic noise spectrum [Ravicz et al., 2000]. This is because of a modulation of the acoustic noise by MR system‐specific structural resonances in the gradient coils and supportive materials, and by additional volume resonances in the system and MR room [Bowtell and Peters, 1999; Cho et al., 1997; Mansfield et al., 1998; Miyati et al., 1999, 2001; Moelker et al., 2003b; Ravicz and Melcher, 2001]. The entire transition from gradient current to acoustic noise, including these resonances, is referred to as the ″frequency response function″ [Hedeen and Edelstein, 1997].
Eddy Currents
The large fluctuating electromagnetic gradient fields in the MR system induce eddy currents in the electrically conducting parts of the imager [Hedeen et al., 2001]. The eddy currents themselves give rise to additional mechanical movements, in particular in the warm (inner) magnet bore, the RF coil and the RF shield [Edelstein et al., 2002; Katsunuma et al., 2002]. In single‐shot EPI, eddy current leakage seems to cause an acoustic noise that is soft (<3 dB less) compared to that produced by the gradient coils [Edelstein et al., 2002]. This is in contrast with gradient echo based pulse sequences in which avoiding eddy current induced noise might reduce the sound intensity by as much as 10 dB [Edelstein et al., 2002].
RF and Slice Selection Pulses
RF and slice selection pulses represent a third, small source of noise in fMRI. Slice selection currents are in fact similar to the readout and phase encoding currents, but as slice selection is generally done simultaneously with RF excitation, both are discussed here. In single‐shot EPI acquisitions the incidence of these pulses is low when playing out the imaging sequence. As a result, the time‐averaged acoustic noise level of RF and slice‐selective pulses is small compared to gradient noise (for RF alone at least 5 dB less) [Edelstein et al., 2002]. This may be different in spin echo and purely RF‐based pulse sequences that encompass multiple RF excitations per image acquisition [Counter et al., 1997]. However, these pulse sequences are less frequently used in fMRI studies. In a fast spin echo sequence, for example, RF produced only slightly less sound compared to the gradient currents (2 dB) [Edelstein et al., 2002].
Ambient Noise
The in‐room air‐conditioning, the MR ventilation system, and the cryogen pumping in (most) MR systems are perceptible sources of acoustic noise in the MR environment not related to the imaging procedure. These background noises are of low magnitude with intensities ranging from 45–71 dB on an A‐weighted scale. The frequencies are <100 Hz (environmental equipment) and range from 100 to 500 Hz (cryogen cooling installation) [Cho et al., 1997; Counter et al., 1997; Foster et al., 2000; Hurwitz et al., 1989; Loenneker et al., 2001; McJury et al., 1994; McJury, 1995; Miyati et al., 1999, 2001; Moelker et al., 2003b; Oesterle et al., 2001; Ravicz et al., 2000; Shellock et al., 1994]. During conventional MR imaging, ambient noises are usually negligible because their sound intensity is much lower than those generated by the gradient coils [American National Standard S1.13‐ 1995; Miyati et al., 2001]. One can assume, however, that ambient noise may have a (small) negative effect on fMRI experiments (to our knowledge, there are no publications on this subject). First, ambient noise levels are relatively low, but still clearly audible in the absence of gradient noise. Therefore, general assumption that the absence of image acquisition sounds equals a period of silence in which stimuli can be presented uninterrupted and uncontaminated [Belin et al., 1999] is not valid. Second, low frequencies in the range of ambient noise are likely to induce activation in a larger area of the auditory cortex compared to higher frequencies (with otherwise identical sound intensity) [Bilecen et al., 1998a]. This has been tentatively explained by the increased sensitivity of the auditory system to higher frequencies.
It should be mentioned that, although the equivalent‐continuous SPL has been predominantly used as a measure for assessing the effects of acoustic scanner noise in fMRI [Cho et al., 1998; Elliott et al., 1999; Shah et al., 1999, 2000; Talavage et al., 1999; Ulmer et al., 1998a], it is probably the peak sound pressure level that is the more appropriate measure. Peak levels do not take into account the silent periods that occur during the functional experiment. Consequently, peak levels better represent the sound intensity when the acoustic noise generation is primarily condensed in the image acquisition window (between concurrent fMRI acquisitions) [Brechmann et al., 2002; Jakob et al., 1998].
PATHWAYS OF ACOUSTIC NOISE INTERFERENCE WITH fMRI EXPERIMENTS
MR‐related acoustic noise may interfere with functional MR acquisitions both through direct and indirect pathways. Direct interference occurs because the acoustic noise in itself induces an increase in regional cerebral blood flow, interacting with the BOLD response of the brain activation of interest. Indirect interference implies that acoustic noise may affect the perception and processing of the stimulus of interest by a distracting effect. This section discusses these mechanisms of interference (summarized in Table I), followed by mechanisms that are specific for fMRI experiments of the auditory, motor, and visual senses.
Table I.
Mechanisms of acoustic noise interference
| Mechanism | Characteristics |
|---|---|
| Direct confounding | |
| Intra‐acquisition response | Activation by scanner noise within same volume acquisition; primarily interfering with auditory fMRI |
| Inter‐acquisition response | Activation by scanner noise of preceding volume acquisition; primarily interfering with auditory fMRI |
| Indirect confounding | |
| Attention | Increased activation in attention‐related cortical areas |
| Distraction | Decreased activation in cortical areas by (inter‐modal) distraction |
| Habituation | Slowly developing adaptational loss of attention; might be advantageous in noisy environments |
| Motion artifacts | Not substantially related to scanner noise |
| Masking | Overlap of spectral components of scanner noise and auditory stimuli; confined to auditory fMRI |
| Stapedial muscle reflex | Changes in cochlear perception of auditory stimuli (intensity and frequency); confined to auditory fMRI |
| Temporary hearing loss | Changes in cochlear perception auditory stimuli (intensity and frequency); confined to auditory fMRI |
Direct Confounding
General Mechanisms
MR‐related acoustic noise induces a BOLD response in the auditory cortex. It has been shown that, similar to other auditory stimuli [Di Salle et al., 2001; Hall et al., 1999], acoustic noise induces a hemodynamic response within 2 to 3 seconds after the onset of acoustic noise [Talavage et al., 1998a, 1999] that peaks after 3 to 8 seconds (hemodynamic delay) [Bandettini et al., 1998; Belin et al., 1999; Edmister et al., 1999; Hall et al., 1999, 2000a; Le et al., 2001] and returns to baseline in >8 sec [Hall et al., 1999, 2000a; Le et al., 2001; Robson et al., 1998]. The variation in the hemodynamic response is due to the fMRI methodology used to identify these response times [Bandettini and Cox, 2000; Hall et al., 1999] and also due to intersubject variability. A BOLD response induced by the scanner sounds in areas other than the auditory cortex is, to our knowledge, unknown. Acoustic confounding in these cortices is primarily thought to occur through indirect effects.
The adverse hemodynamic response to acoustic scanner noise results in an elevation of the BOLD response to be measured, in particular the baseline level (OFF condition) [Hall et al., 1999]. Thus, the dynamic range (ON vs. OFF condition) of the BOLD response decreases (also called clipping; Bandettini and Cox, 2000], making the stimulus‐induced cortical activation more difficult to detect statistically [Edmister et al., 1999; Hall et al., 1999, 2000a; Robson et al., 1998; Talavage et al., 1999; Yang et al., 2000]. The hemodynamic responses to MR‐related acoustic noise and stimulus‐induced brain activation do not add up linearly [Talavage et al., 1998b]; this implies that a simple subtraction is not possible [Bandettini et al., 1998; Edmister et al., 1999; Hall et al., 1999; Mazard et al., 2002; Robson et al., 1998]. It is assumed that BOLD responses do not add up linearly because of saturation, illustrated by a reduced BOLD response to acoustic scanner noise when preceded by another acoustic stimulation (Fig. 1) [Di Salle et al., 2001]. Furthermore, it has been suggested that imager noise influences the spatial distribution of the stimulus‐induced fMRI responses in auditory cortex [Edmister et al., 1999]. Through what mechanism and to what extent has not yet been investigated.
Figure 1.
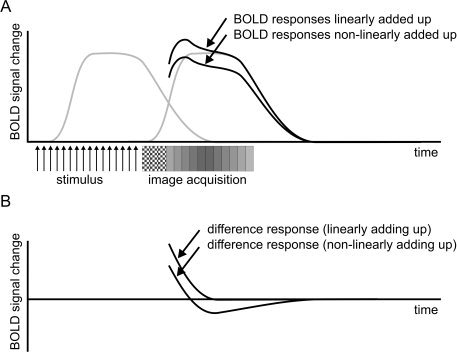
BOLD‐to‐stimulus response (left grey curve) and BOLD‐to‐scanner‐noise response (right grey curve) do not linearly add up because of saturation of the BOLD‐response (A). Therefore, simple subtraction of baseline (BOLD response without preceding stimulation) results in a net negative response (B). The checked boxes are dummy image acquisitions to allow longitudinal magnetization to reach steady state.
Based on the BOLD response time course of the scanner noise in the fMRI experiment, two mechanisms of acoustic confounding in fMRI can be distinguished, i.e., intra‐acquisition and inter‐acquisition responses (black areas in Fig. 2A and 2B, respectively). The intra‐acquisition response refers to an imager noise‐induced BOLD response that interferes with the functional data to be acquired later on within the same multislice (or volume) acquisition [Talavage et al., 1998]. As the BOLD response starts 2 sec after onset of noise, the intra‐acquisition response occurs when the image acquisition window is >2 sec. The inter‐acquisition response, on the other hand, is generated when the acoustic noise BOLD response persists during the next volume acquisition [Talavage et al., 1998a]. The parameter determining whether the inter‐acquisition response applies is the time between two successive slices or volume acquisitions, i.e., the sequence repetition time (TR) minus the acquisition window [Shah et al., 2000]. For short acquisition times, therefore, the inter‐acquisition response occurs when the TR is shorter than the time required for the BOLD response to noise to return to baseline level (Fig. 2B).
Figure 2.
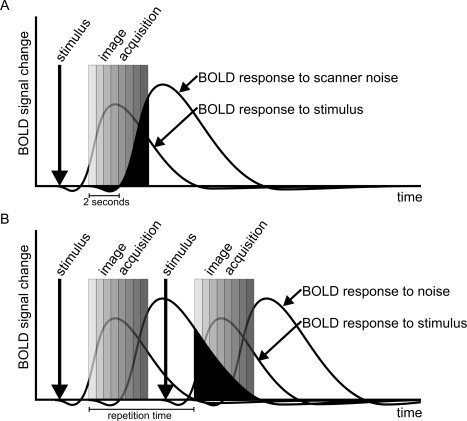
BOLD‐to‐stimulus responses confounded by intra‐acquisition response (A) and inter‐acquisition response (B) to acoustic scanner noise (black areas). The intra‐acquisition occurs when the volume acquisition takes >2 sec; the inter‐acquisition response occurs when the time between the volume acquisitions is shorter than the time the BOLD response (to scanner noise) takes to return to baseline.
Direct confounding in auditory cortex
The auditory cortex encompasses primary, secondary and adjacent regions. The primary auditory cortex is a relatively small (1–4 cm3) region bilaterally located on the superior temporal gyrus (Heschl's gyrus), including Brodmann's area BA41 (Fig. 3). This auditory field is characterized by a strong connection with the peripheral auditory system. Sounds elicit robust responses in the primary auditory cortex reflecting both the intensity and tonotopy of the sound as perceived by the cochlea [Ehret, 1997]. The adverse effects of imager noise are most apparent in the primary auditory cortex and have been described in detail elsewhere [Bandettini et al., 1998; Bilecen et al., 1998a; Cho et al., 1998; Elliott et al., 1999; Hall et al., 1999, 2000a; Jakob et al., 1998; Loenneker et al., 2001; Shah et al., 1999; Talavage et al., 1999; Ulmer et al., 1998b]. The secondary auditory cortex is the surrounding area and includes among others BA22 (includes Wernicke's area) and BA42. This region is relevant in early auditory processing intimately involved in phonological and nonword auditory decoding and attention‐related enhancement of responses [Shapleske et al., 1999]. Cortical activation of the secondary auditory cortex by imager noise is less conclusive than for the primary region. This is due to both ambiguous activation below significant threshold levels [Talavage et al., 1999] and omitted classification of the auditory cortex into primary and secondary cortex in some studies [Bilecen et al., 1998a; Cho et al., 1998; Elliott et al., 1999]. Only one investigation failed in the attempt to identify activation in the secondary auditory cortex using MR‐noise [Bandettini et al., 1998]. Recent investigations have demonstrated activation (changes) in the middle temporal gyrus and superior temporal sulcus, pertaining to the secondary auditory cortex [Jakob et al., 1998; Loenneker et al., 2001; Ulmer et al., 1998b], and the associated auditory cortices [Hall et al., 1999, 2000a; Mazard et al., 2002; Shah et al., 1999]. The BOLD signal changes in both primary and secondary auditory cortex vary considerably ranging from 0.32–9%. This large variability probably reflects differences in the MR noise duration (prolonged stimulation causes stronger activation) [Robson et al., 1998] and intensity (the more intense the MR noise, the greater the signal changes) [Brechmann et al., 2002; Hall et al., 2001; Jancke et al., 1998].
Figure 3.

Human cortex (lateral view) according to Brodmann's cytoarchitectural map.
It has been hypothesized that the dissemination of the acoustic noise‐induced activation into the secondary regions is a response to the complex periodic properties of scanner noise, similar to those present in conversational speech [Belin et al., 1999; Mazard et al., 2002; Ulmer et al., 1998a]. As human speech is predominantly processed in the left hemisphere [Binder et al., 1997], it is not surprising that imager noise activation favors the left over the right secondary auditory cortex [Bilecen et al., 1998b; Ulmer et al., 1998b].
Recent studies found small negative BOLD responses in visual and motor cortices [Hu et al., 1997], i.e., within the initial 2–3 sec after stimulus presentation [Yacoub et al., 1999]. This initial dip, caused by an oxygen depletion at microvascular level [Yacoub and Hu, 2001b], allows for imaging with higher spatial specificity suitable for cortical columnar functional imaging [Duong et al., 2000]. Unfortunately, in auditory cortex the ensuing intra‐acquisition response is likely to impede the exploration of this initial dip. Although an initial dip has been described recently by Bandettini and Cox [ 2000], this was explained by the negative overshoot of a previous time series.
Indirect Confounding
General Mechanisms
Imager noise can also confound functional experiments through indirect pathways that are predominantly attention‐related. Basically, attention is a mechanism enabling the processing of a stimulus or task of a specific sense (modality) [Woldorff et al., 1993]. Neuroregulative dysfunctions, such as schizophrenia, are known to exhibit disruptions in attention. Therefore, it has been hypothesized that psychiatric disorders are more vulnerable to indirect confounding by MR‐generated noise [Mathiak et al., 2002]. Focusing attention on a specific modality implies that the perception and cortical response related to that modality are positively influenced and modulated [Berman and Colby, 2002]. On the other hand, involuntary loss of focus (distraction) and neglect may reduce the cortical response to the stimulus [Escera et al., 1998; Jancke et al., 1999]. Distracting stimuli might be perceived from either the same modality (intra‐modal interaction), e.g., acoustic scanner noise in auditory fMRI or from other modalities (inter‐modal interaction), e.g., scanner noise in visual fMRI [Mazard et al., 2002]. Accordingly, the changes in attention as a result of MR‐related acoustic noise may lead to both an increase in activity in attention‐related brain areas and to a drop in cortical activity in the brain areas of interest (distraction). The location of these effects can be appreciated at both cortical and subcortical levels [Maeder et al., 2001; Opitz et al., 2002].
It has been shown that the left auditory cortex (T1a, anterior part of Heschl's gyrus) is involved in foreground–background decomposition, i.e., the capability of the auditory system to monitor targets in a background [Scheich et al., 1998]. This cortical area shows more activation in response to low intensity tones (36 dB) in a background of MR‐related acoustic noise (40 dB) compared to louder tones (>48 dB) [Brechmann et al., 2002]. This increased activation in T1a was assigned to the required attentional effort for detecting the softer sounds [Brechmann et al., 2002]. In an analogous experiment, increased activation has been demonstrated in the posterior part of the calcarine cortex during visual imagery tasks in noisy MR conditions (compared to less noisy conditions) [Mazard et al., 2002]. The activation in the calcarine cortex reflected the greater visual attentional load required for maintaining vivid images [Mazard et al., 2002]. In a similar manner, secondary motor areas, involved in motor activity planning, showed inconsistent activation among subjects that were exposed to loud MR imager noise. Again, activation has been attributed to attention responses in this area [Elliott et al., 1999].
Distraction by scanner noise may potentially modulate BOLD responses both intra‐ and inter‐modally [Mazard et al., 2002]. Its modulations are in the same order of magnitude as the BOLD response of interest [Vouloumanos et al., 2001] but not in the time course of the BOLD response [Hall et al., 2000]. In a recent fMRI study, fMRI signal changes by visual stimulation decreased by approximately 50% in the presence of acoustic MR noise, attributed to exhaustion and a loss of attention [Cho et al., 1998; Loenneker et al., 2001]. By contrast, congruent, simultaneous stimulation in different modalities might enhance their cortical response [Calvert et al., 1999]. As an example, the presentation of speech employing both auditory and visual stimuli can amplify the cortical responses of both these senses [Calvert et al., 1999]. Difficult tasks require increased attentional efforts and may, therefore, be more affected by distracting scanner noise [Elliott et al., 1999]. Parallel to this, a close relationship has been demonstrated between the intensity of scanner noise and performance, reaction time and BOLD signal changes (experiments carried out for auditory cortex) [Edmister et al., 1999; Shah et al., 1999, 2000; Ulmer et al., 1998b].
Functional MRI studies are vulnerable to motion artifacts, because of the (generally) long experiment times and the small BOLD signal changes [Seto et al., 2001]. It has been hypothesized that motion artifacts are related to anxiety, and anxiety itself to acoustic scanner noise [Quirk et al., 1989]. Artifactual brain activations might, therefore, be temporally correlated with the stimulus but are in fact correlated with the imager noise [Sunaert and Yousry, 2001]. One study reported that anxiety was not significantly associated with motion artifacts, making the above hypothesis less likely [Dantendorfer et al., 1997]. This outcome has been supported by an fMRI experiment that found a similar incidence of motion artifacts in silent and loud acoustic scanner noise conditions [Elliott et al., 1999].
Indirect confounding in auditory cortex
Auditory fMRI may be further impaired by the (louder) imager noise due to its screening effects on stimuli [Scheich et al., 1998; Shah et al., 2000]. Extracting the stimuli in an obscuring acoustic background encompasses the interplay of the auditory system at both the cochlear (masking) and at the cortical levels (foreground–background decomposition), discussed earlier. Cochlear masking, at the inner ear, is frequency selective whereby hearing thresholds peak around the masker frequency (Fig. 4) [Oxenham and Plack, 1998]. In auditory fMRI the competitive effect between stimulus and scanner noise depends on the overlap of the spectral components [Belin et al., 1999; Di Salle et al., 2001]. Recent experiments have suffered from acoustic scanner noise with frequencies from 800 to 1,200 Hz that largely hindered the perception of a 1,000 Hz pure tone stimulus [Le et al., 2001]. In contrast, stimulation with pure sinusoidal tones at 200 and 3,000 Hz were clearly perceived, as evidenced by large BOLD signal changes [Le et al., 2001].
Figure 4.
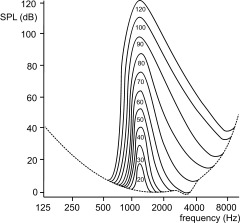
Principle of cochlear masking by a pure sinusoidal tone at 1.2 kHz at various SPLs (shown within curves) demonstrating broad‐band increments in minimum hearing thresholds with increasing pure tone intensities. Hearing thresholds are on a linear scale (vertical axis). The dotted line represents the sensitivity of human hearing over frequency (horizontal axis), being significantly reduced at lower and higher frequencies. Note the asymmetry (upward spread) of masking, i.e., higher frequencies are masked to a greater extent than lower frequencies.
Masking continues even after the MR scanner noise has stopped (forward masking) [Backes and van Dijk, 2002]. The reason for this is that the cochlear nerve fibers have a recuperation phase of up to 400 msec during which they show a reduced response to novel stimulation [Frisina, 2001]. The louder the background noise the longer this effect will last, and this phenomenon has been implied as the cause of highly variable BOLD responses (by a factor of 2) between different fMRI studies of otherwise similar set‐up [Backes and van Dijk, 2002; Belin et al., 1999]. In cases where the hemodynamic response to scanner noise takes longer to subside than forward masking, however, forward masking is expected to be a trivial confounding factor.
Both cochlear and cortical processing are required for stimulus extraction in noisy environments. Their relative contributions depend on among others the physical properties of the presented auditory stimulus. There is an empirically found difference between pure tones and complex sounds in that the obscuring effects of pure tones occur at a cochlear level, whereas complex amplitude and frequency modulated stimuli have an effect at primarily a cortical level [Hari and Makela, 1988]. As a consequence, MR‐related acoustic noise may have a different effect on fMRI processing of simple versus complex acoustic stimulation. To minimize concurrent processing at cortical and cochlear levels, pure tones can be used, e.g., as standard stimuli within the broad‐band (complex) imager noise.
Acoustic scanner noise might further interfere with auditory fMRI by means of habituation. Habituation is an adaptational phenomenon of the auditory cortex, characterized by a reduced BOLD response after prolonged exposure of several minutes [Bandettini et al., 1998; Bernal and Altman, 2001; Pfleiderer et al., 2002]. The fMRI mapping of the tonotopic organization by Bilecen et al. [ 1998b] suffered from habituation effects in several of their subjects. During continuous scanner background noise, this effect might in fact be advantageous; the confounding effect of imager noise vanishes during the functional experiment. For noncontinuous acoustic noise, as in sparse temporal sampling, this phenomenon is obviously less likely to occur.
Intense scanner noise may also potentially alter the sound levels and spectral characteristics of the presented auditory stimulus by inducing a stapedial muscle reflex [Hall et al., 2001]. This reflex, occurring when the sound intensity is >80 dB, lowers the perceived loudness for frequencies <1 kHz (−10 to −20 dB) and amplifies frequencies between 1–3 kHz [Counter and Borg, 1993; Pascal et al., 1998]. Whether the stapedial muscle reflex modulates stimuli in auditory fMRI, and to what extent this alters brain activation, has not yet been investigated.
A final confounding factor relevant to specifically auditory fMRI is in the temporary loss of hearing that ensues in the presence of intense MR noise [Brummett et al., 1988]. The extent of hearing loss is correlated with the scanner noise intensity with dominant effects in the frequency range of the acoustic noise [Ulmer et al., 1998a]. For example, an EPI pulse sequence with a TR of 1 second has been reported to induce a convex‐shaped reduction of minimum hearing thresholds over the audible frequency range [Ulmer et al., 1998a]. This caused auditory stimuli, such as speech and syllables, to be perceived as relatively flat sounds.
Indirect confounding in visual and motor cortices
MR scanner noise may also cause measurable artifacts in fMRI of non‐auditory cortices, although the effects are less pronounced than in the auditory cortex. In this respect, few investigators have evaluated visual and motor cortices [Cho et al., 1998; Elliott et al., 1999; Loenneker et al., 2001; Ludwig et al., 1999; Mazard et al., 2002].
The visual cortex is located in the occipital lobe of the cerebrum (Fig. 3), encompassing the primary visual cortex (V1, BA17) receiving afferent bundles from the thalamus and projecting to the associated visual cortices (anterior temporal and the parietal lobes). Investigators mentioned decreases of up to 50% less significantly activated pixels in primary [Cho et al., 1998; Loenneker et al., 2001; Ludwig et al., 1999] and associated [Loenneker et al., 2001] visual cortex in imager noise backgrounds. Only one investigator did not observe signal changes in noisy compared to silent experiment conditions, which might have been caused by the relatively small sample size used [Elliott et al., 1999].
To our knowledge, only two investigators tested for imager noise interference with functional experiments of the human motor cortex [Cho et al., 1998; Elliott et al., 1999], which comprises primary motor cortex (BA4), premotor (BA6) and supplementary motor areas (Fig. 3) [Mattay and Weienberger, 1999]. In an experiment that made use of additional scanner noise, Cho et al. reported a 30% increase in the extent (number of activated pixels) of motor cortex activation [Cho et al., 1998]. The larger cortical activation was attributed to a facilitated processing of the motor stimulus by simultaneous acoustic stimulation [Burke et al., 2000; Cho et al., 1998]. In the experiments of Elliot et al. [ 1999], a higher variability among subjects in the supplementary motor areas was detected; an area that is involved in the planning of motor activities. Their findings indicated that MR‐related acoustic noise predominantly effects through an indirect mechanism.
METHODS TO REDUCE ACOUSTIC IMAGER NOISE
Various methods exist to lower the adverse effects of acoustic noise. First, the functional experiment paradigm can be optimized by taking into account the temporal characteristics of the cortical responses to both the MR noise and the stimulus. Such an acoustic artifact‐free experiment is also referred to as a silent paradigm design. A second, more fundamental approach is the elimination of the actual sources of acoustic noise. This can be achieved by differently exciting the gradient system (silent pulse sequence design) and by engineering improvements in MR hardware. Finally, pragmatic methods of passive and active noise canceling can be used. Table II lists the various noise reduction techniques and their current status of application in fMRI.
Table II.
Noise reduction techniques in functional MRI
| Technique | Characteristics |
|---|---|
| Functional paradigm design | |
| Sparse temporal sampling | Avoiding inter‐acquisition BOLD response to MR noise by increasing TR to >7 sec |
| Clustered volume acquisition | Avoiding intra‐acquisition BOLD response by clustering image acquisitions |
| Magnetization subtraction method | Subtraction of intra‐acquisition response |
| Silent pulse sequence design | |
| Burst imaging | Train of RF pulses under constant phase and readout gradients; SPL reduction >15 dB; scarce resolution and SNRs |
| Low‐pass filtering gradient pulses | Avoiding higher harmonics in the acoustic noise spectrum; attenuation up to 40 dB; limited to slow sequences |
| Low‐pass filtering with SIMEX pulses | Addition of SIMEX pulses for better volume coverage within same acquisition window; FLASH imaging at 43 dB |
| Low‐pass filtering with SENSE | Addition of multiple array detectors for compensating smaller gradient current amplitudes and undersampling; reduction 14 dB(A) |
| Interleaved spiral‐k imaging | Intrinsically low‐pass filtered due to sinusoidal gradient currents; further reduction of acoustic noise at the expense of imaging time; BOLD contrast images acquired at 67 dB with good coverage |
| MR‐imager configuration changes | |
| Increasing mass gradient system | Increases inertia to mechanical vibrations |
| Mounting gradient system to floor | Absorption of acoustic vibrations; reduction ∼10 dB during EPI |
| Vacuum enclosing gradient coils | Reduction of up to 10 dB during EPI at 1.5 Tesla; currently applied in Toshiba's Excelart and General Electric's Twinspeed systems |
| Insulation | Acoustic noise reduction up to 20 dB, particularly at higher frequencies |
| Lorentz force balancing | Canceling of opposite forces in coil assemblies; not implemented in commercial MR imagers; reductions of up to 35 dB |
| Eddy current reduction | Reduction of eddy currents in RF‐coil and main magnet |
| Passive noise reduction | Passive absorption of acoustic noise by earplug, earmuff, helmet, vacuum cushions or total body encapsulation; subjective reductions up to 60 dB when combining earplug, earmuff and helmet |
| Active noise reduction | Destructive interposition of anti‐noise; objective reductions up to 40 dB; subjective reduction 5 dB at 2 kHz; not commonly used in fMRI |
Silent Functional Paradigm Designs
MR‐related acoustic noise precludes a completely controlled functional environment and poses restrictions on the usable functional paradigm designs. The most widely used paradigm in fMRI is the conventional block design (Fig. 5A), composed of alternating ON and OFF conditions of each several tens of seconds [Parrish, 1999]. This simple design is sensitive to MR noise because of interference along the inter‐ and intra‐acquisition time scales and the simultaneous presentation of stimulus and scanner noise [Le et al., 2001]. A more careful construction of the functional paradigm can minimize the effects of scanner noise, as discussed below in more detail.
Figure 5.
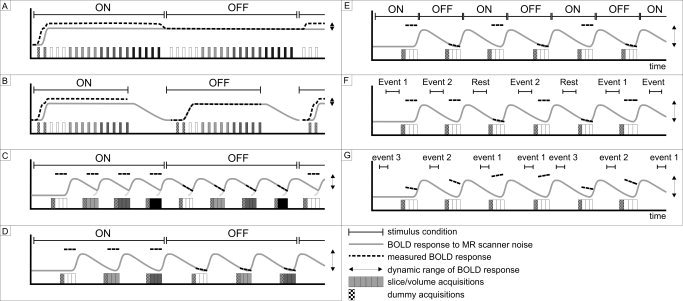
Silent functional paradigms (B–G) vs. conventional block design (A), including event‐related paradigms (E–G). Grey lines represent BOLD responses to scanner noise during imaging (white and grey scaled bars), and the dotted lines the measured BOLD response. B: The intra‐acquisition response. C: BOLD responses are spoiled by MR scanner noise of preceding acquisitions (inter‐acquisition response). Note that the acquisition time prolongs when avoiding the inter‐acquisition response (not scaled). The size of the arrows indicates the dynamic range of that particular imaging paradigm (ON vs. OFF conditions) and is smallest in the conventional imaging paradigm. G: Stroboscopic event‐related imaging paradigm illustrated by the random time shifts of the various events. Dummy acquisitions are taken and discarded to allow time for the longitudinal magnetization to reach steady state.
Avoiding inter‐acquisition interference
Edmister et al. [ 1999] and Shah et al. [ 2000] have experimented with silent paradigms that eliminated the inter‐acquisition interference making use of continuous music and speech‐related sounds, respectively. By using long TRs, such that the next volume acquisition occurs only after the acoustic noise BOLD response has subsided, these investigators could completely avoid the inter‐acquisition response (Fig. 5B). They independently found an optimal TR (which included an acquisition window of ∼2 sec), in terms of magnitude and extent of activation, of at least 7 sec [Edmister et al., 1999; Shah et al., 2000]. The use of such long TRs is referred to as sparse temporal sampling [Hall et al., 1999].
From the imaging perspective, an advantage of sparse temporal sampling is in the complete recovery of the MR magnetization during the lengthy imaging intervals, resulting in better signal‐to‐noise ratios (SNR) in the next volume acquisition (increased T2*‐weighting) [Elliott et al., 1999; Hall et al., 1999]. This largely compensates for the data reduction per unit time of the sparse temporal sampling technique [Hall et al., 2001]. Also, stimuli are presented and subject responses evaluated in virtual silence (except from ambient noise). This is particularly suitable in psycho‐acoustic experiments, in which the relation between human perception of sound and its characteristics is under investigation [Belin et al., 1999]. An additional gain in the dynamic range of the BOLD response can be attained by taking advantage of the BOLD overshoot phase in the OFF condition [Bandettini et al., 2000; Hall et al., 1999]. This overshoot is a temporary negative level of the BOLD response before it returns to the baseline level. By acquiring the OFF condition during the overshoot phase, the signal difference between stimulus and non‐stimulus conditions is optimally enhanced [Hall et al., 1999].
Avoiding intra‐acquisition interference
As fMRI is moving toward whole brain imaging with larger brain coverage, thinner slices and better in‐plane resolution, the intra‐acquisition response becomes more relevant [Shah et al., 2000]. Intra‐acquisition interference has been found to decrease when using very rapid volume acquisitions, such as clustered volume acquisitions (CVA) [Talavage et al., 1998a]. In CVA, a series of volumes is rapidly imaged making use of tailored RF pulses and rescaled gradient amplitudes for reducing cross‐talk between adjacent slices [Edmister et al., 1999]. Its temporal location within the functional paradigm ideally coincides with the peak of the BOLD response to the stimulus of interest (Fig. 5C) [Eden et al., 1999; Hall et al., 1999]. Because of intersubject variability of the BOLD response [Amaro et al., 2002], prolonged stimulation may be preferred to reach the plateau in most subjects. An optimal time span of a CVA acquisition of <3 sec has been empirically found making use of short CVA image acquisitions preceded with additional MR noise (readout pulses) [Talavage et al., 1999]. By contrast, a distributed volume acquisition (Fig. 5B), in which imaging was done equally throughout the TR period, resulted in remarkably lower, insignificant signal changes [Talavage et al., 1999]. Hence, a scanning time of a volume of <2 sec will completely avoid the intra‐acquisition effects of the scanner noise within that volume (Fig. 5C) [Shah et al., 2000; Talavage et al., 1998a, 1999].
An advantage of the CVA method over the distributed volume acquisition method is the improvement of motion registration methods, because motion is relatively more likely to occur between rather than within CVA acquisitions [Edmister et al., 1999]. As a relative drawback, compressing the image acquisition to within 2 sec evidently restricts slice coverage. Also, the burst of imaging noise produces louder imager sounds (peak sound level) than when the imaging noise is distributed equally over the TR period.
Ideally, both the intra‐and inter‐acquisition responses to MR scanner noise are to be avoided. To this end, it is advised that the functional paradigm should comprise a combination of short CVA‐like data acquisitions and sparse temporal sampling with long TR. This provides a virtually silent functional experiment (Fig. 5D,E), with the quiet periods shifted to one end of TR and the whole imaging procedure to the other end. Currently, this combined functional paradigm design is most widely employed for silent auditory fMRI studies [e.g., Scheffler et al., 1998; Tanaka et al., 2000].
Another approach to quiet functional paradigm design that makes use of compensation for the intra‐acquisition response rather than avoiding it is the magnetization subtraction method [Bandettini et al., 1998; Di Salle et al., 2001]. As depicted in Figure 6, the decay of the (plateau‐ed) BOLD response to the stimulus can be corrected for the imager noise‐induced BOLD response by a voxel wise subtraction. Magnetization subtraction proved successful in several experiments showing relatively large signal changes of up to 9% in the auditory cortex [Bandettini et al., 1998; Di Salle et al., 2001]. In contrast to sparse temporal sampling, this decay sampling procedure has a high temporal resolution suitable for detailed sampling of the decaying BOLD course [Di Salle et al., 2001]. This method assumes that the BOLD responses to both the stimulus of interest and the MR scanner noise add up in a linear manner [Di Salle et al., 2001]. Subsequently, subtraction might be justifiable when the longitudinal magnetization changes during initial imaging are equal in both ON and OFF conditions [Bandettini et al., 1998]. In one magnetization subtraction experiment, negative signal changes were measured that might have been caused by such nonlinearities [Di Salle et al., 2001]. With this and the above‐mentioned studies in mind, the validity of the procedure is in our opinion debatable.
Figure 6.

Principle of the magnetization subtraction technique. The three main components that contribute to the functional acquisition, i.e., measured BOLD curve, the response to MR scanner noise (upper panels) and the longitudinal magnetization (lower panels) are depicted. The similar magnetization decay curves in both ON and OFF conditions are assumed to be similar allowing (voxel‐wise) subtraction. Note that the scale of the BOLD‐signals is small compared to the scale of the longitudinal magnetization.
Event‐related sparse temporal sampling
A relative drawback of the above‐described silent functional paradigm designs is in their long duration (proportionate with the increase in TR). More rapid event‐related based designs have therefore been proposed for silent paradigms [Belin et al., 1999; Yang et al., 2000]. Event‐related functional experiment set‐ups are characterized by short, discrete stimulation (Fig. 5E) of <2 sec, rather than prolonged stimulation (Fig. 5A–D). Such short stimuli have been found to be enough to induce significant brain activation [Rosen et al., 1998]. General advantages of event‐related paradigms are among others the randomization of stimulus presentations (trials), the application of different stimuli (Fig. 5F) and the post hoc sorting of data based on arbitrary parameters or stimuli [Cacace et al., 2000]. Analogous to this, event‐related designs are less susceptible to image motion artifacts because the actual behavioral responses can be temporally resolved from the undisturbed important functional images [Birn et al., 1999].
In silent event‐related fMRI, stimuli are basically presented in the scanner noise‐free intervals (between volume acquisitions) and attempts are made to measure the BOLD response at its peak hemodynamic response [Le et al., 2001]. Despite the high inter‐subject variability of the BOLD response in auditory cortex [Josephs et al., 1999], consistent results with silent event‐related paradigms have been found. Using pure tone bursts of 900 msec, Yang et al. [ 2000] found a 54% increase (to 2.17%) in BOLD signal changes when comparing a silent event‐related acquisition with a conventional event‐related acquisition [Yang et al., 2000]. As another example, this method has been successfully employed in tonotopic mapping experiments of the auditory cortex [Engelien et al., 2002; Le et al., 2001]. Functional acquisitions with stimulus durations as short as 50 msec were only minimally hampered by the MR imager noise [Engelien et al., 2002].
The silent event‐related technique may be further enhanced by randomly shifting the temporal location of stimuli within the scanner noise‐free period (Fig. 5G) [Backes et al., 2002; Belin et al., 1999; Amaro et al., 2001]. With this so‐called stroboscopic BOLD imaging, the temporal shifts of stimuli within the functional paradigm represent different trials that provide sampling of the complete BOLD response. Stroboscopic BOLD imaging is beneficial in terms of its temporal resolution (resolution equal to minimum time shift between trials) and reduced habituation effects [Belin et al., 1999]. As a potential drawback, BOLD responses from stimuli that were shifted to the end of TR might interfere with BOLD response of preceding (early) stimuli. This might be avoided by adapting TR congruent with the stimulus time shift that in addition benefits from shorter experiment durations. Subsequent differences in longitudinal magnetization should, however, be dealt with during image post‐processing [Talavage et al., 1999].
Several fMRI paradigm designs have been discussed with the aim to provide an acoustically controlled fMRI experiment with increases in signal amplitude and extent. It is obvious that the sparse temporal sampling technique increases the total imaging time compared to conventional block designs [Bilecen et al., 1998a, b; Hall et al., 1999, 2000a; Robson et al., 1998]. Parallel to this, longer TRs (>9 sec) may result in attention loss and subsequently lower BOLD responses [Shah et al., 2000] and are, therefore, better avoided. TRs of several seconds allow more time for the longitudinal magnetization to recover, which intrinsically results in larger relative signal changes [Amaro et al., 2002]. Several studies have reported recently the successful use of TRs of >9 sec [Formisano et al., 2002; Liebenthal et al., 2003]. Besides its extended experiment time, the sparse temporal sampling technique is also unsuitable to acquire a fine temporal resolution of the BOLD response [Belin et al., 1999; Hall et al., 1999]. Both the magnetization subtraction method and the stroboscopic event‐related paradigms provide better temporal sampling of the BOLD response. The magnetization subtraction technique demonstrated large signal changes compared to the sparse temporal sampling techniques (up to 9% using magnetization subtraction [Di Salle et al., 2001] vs. up to 2.2% using sparse temporal sampling [Hall et al., 1999]). Its validity is, however, in debate because of expected non‐linearities when adding up BOLD responses to the stimulus of interest and the imager noise. Also, the sampling of the BOLD response is partial, i.e., restricted to its plateau phase and return to baseline level. The stroboscopic event‐related method is a promising technique in terms of its good temporal sampling of the BOLD response (signal changes reported up to 1.5%) [Backes et al., 2002]. Although the image acquisition time tends to increase as compared to sparse temporal sampling (because of the larger number of different trials with otherwise identical TR) adequate results with experiment times of only 10 min have been reported (temporal resolution of 2 sec) [Backes et al., 2002].
Silent Pulse Sequence Design
As mentioned previously, the most dominant noise source in the MR environment originates from the gradient system. Modulating the motion behavior of the gradient system, i.e., by redesigning the pulse sequence, may therefore decrease scanner noise. Such silent pulse sequences can broadly be differentiated into (1) the sequences based on RF Burst imaging, and (2) those based on re‐shaping the readout and phase encoding gradient currents.
Burst imaging pulse sequences
In the area of silent Burst imaging relatively little work has been done. Burst is the generic name given to a class of pulse sequences that employ multiple low flip‐angle pulses under a constant readout and phase encoding gradient (and the subsequent refocusing of a set of echoes equal to the number of RF bursts) [Hennig and Hodapp, 1993]. This results in barely audible acoustic clicks due to the low number of gradient switching steps [Jakob et al., 1998]. Jakob et al. [ 1998] assessed a single‐shot technique that showed well localized activity in visual and auditory cortex within only 12 gradient ramps in 105 msec. Peak sound levels at 2 meter distance from the MR system ranged from 52–55 dB(A) [Jakob et al., 1998]. From the imaging perspective, functional Burst imaging proved successful in sleep staging and in visual and auditory experiments with signal changes of up to 6% and 3%, respectively [Jakob et al., 1998; Lovblad et al., 1999]. Additional attractive properties besides its quietness include the geometric fidelity, small power deposition, low demands on gradient strength (high amplitudes but low switching rates) and, therefore, suitability for systems without EPI hardware [Cremillieux et al., 1997; Jakob et al., 1998]. Nevertheless, in our opinion, the major drawbacks limit further development of the Burst sequences in fMRI, which are: poor SNRs trading off with resolution, limited multi‐slice capabilities (due to rapid T2* signal loss) and considerable motion sensitivity [Cremillieux et al., 1997; Jakob et al., 1998]. The application of Burst imaging is, therefore, primarily restricted to functional experiments in which absence of scanner noise throughout the entire examination is a prerequisite (as in sleep staging, although many successful studies have also been carried out with EPI).
Silent pulse sequences based on redesigning gradient pulses
The acoustic scanner noise spectrum primarily comprises a fundamental frequency and harmonics, both deducible from the gradient current spectrum by means of Fourier transform (Fig. 7) [Hedeen and Edelstein, 1997]. For relatively slow pulse sequences (fundamental frequency below ∼100 Hz), the higher order harmonics are predominantly audible. Avoidance of these by band‐pass filtering the gradient current (pulse sequence design) would, therefore, result in a significant reduction of the loudness [Hennel et al., 1999]. Based on this, Hennel et al. [ 1999] formulated three principles for silent modeling of gradient pulses: (1) use sinusoidal gradient slopes, (2) maximize slope durations (that lowers the fundamental frequency), and (3) minimize the number of slopes by merging gradient pulses [Ludwig et al., 1999]. Applying these behavioral restrictions to both spin‐echo and gradient‐echo based pulse sequences has reduced noise production by up to 40 dB(A) with acceptable image quality [Girard et al., 2000; Hennel et al., 1999]. For faster pulse sequences such as FLASH (fast low angle shot gradient echo) and EPI, considerably less reduction could be obtained [Girard et al., 2000; Hennel et al., 1999]. The reason is that the fundamental frequency of these rapid imaging protocols shifts toward the audible range of human hearing, thereby making the harmonics relatively less influential in the acoustic domain [Hennel et al., 1999].
Figure 7.
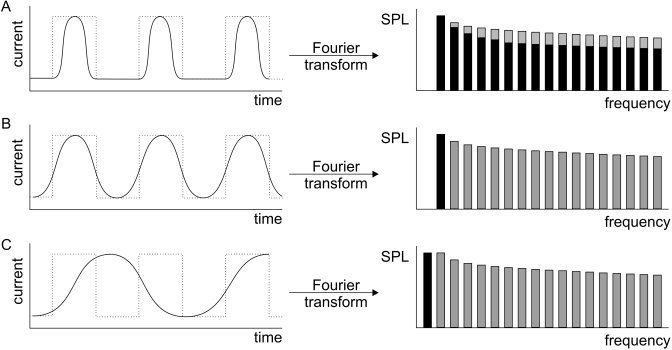
Relationship between gradient current and acoustic noise frequency distribution (in octave bands) obtained for several sinusoidal pulses by means of Fourier transform (A, black bars). With flattening of the slew rate, higher order harmonics disappear from the acoustic spectrum. For a pure sinusoidal gradient current, the acoustic noise comprises one pure tone (B). Extending the gradient current over time causes the fundamental frequency to lower (C). Grey bars represent the frequency distribution of a rectangular gradient pulse.
Recently, modifications of silent gradient pulse modeling have been proposed to allow for faster imaging while still preserving significant noise reduction [Hennel, 2000; 2001; Loenneker et al., 2001; Ludwig et al., 1999; Oesterle et al., 2001].
First, simultaneous multislice excitation (SIMEX) pulses have been implemented into a silent FLASH sequence providing larger volume coverage within the same image acquisition window [Loenneker et al., 2001; Ludwig et al., 1999]. SIMEX pulses are single multifrequency RF pulses composed of linearly combined carrier frequencies that selectively excite parallel slices [Loenneker et al., 2001]. While maintaining high SNR and spatial resolution, it was possible to measure up to eight slices simultaneously making use of one SIMEX pulse [Loenneker et al., 2001]. Successful stimulation of four parallel slices was appreciated in auditory and visual cortices with increased extent of cerebral activation in the silent pulse sequence condition (43.1 dB(A)) [Loenneker et al., 2001].
Another silent pulse sequence design has been proposed by de Zwart et al. [ 2002]. Sensitivity encoding (SENSE) with multi‐element detector arrays was incorporated into a silent BOLD‐contrast EPI pulse sequence, which performed excellently from the acoustic perspective. With a two‐fold undersampling and halving the gradient amplitude, the acoustic load subsided about 14 dB(A) on a 1.5 T imager. From the imaging perspective, image acquisition time, resolution and the quality of the functional maps were similar in both conventional and SENSE‐prepared EPI sequences [de Zwart et al., 2002]. However, these findings might be task‐dependent and not applicable to other imaging paradigms and pulse sequences [de Zwart et al., 2002].
A final way of improving the temporal resolution is by making use of interleaved spiral trajectory k‐space imaging. Spiraled filling of k‐space is more time‐efficient than conventional filling, because almost 100% of the image acquisition window is spent on data collection [Oesterle et al., 1999]. Oesterle et al. [ 1999, 2001] adjusted a silent spiral‐k BOLD contrast pulse sequence by slow ramp times and several spiral interleaves. They found that a minimum rise time of 6 msec (20 times below the hardware limit) and 64 interleaves (24.3 msec/interleave) with a slow return leading off to zero generated only 72 dB(A) at a Bruker 2 Tesla system [Oesterle et al., 2001]. Image contrast and SNR were slightly reduced compared to a conventional silent gradient echo sequence due to the long duration of the spiral readout (T2* signal loss). Slightly lower resolution was a result of the missing parts in the k‐space corners. Despite that, volume coverage was four times better.
In summary, the current silent pulse sequences allow for fast BOLD contrast imaging suitable to measure the hemodynamic response in a relatively low noise environment. In particular the incorporation of parallel imaging techniques in spiral MR imaging, eventually combined with other techniques such as SIMEX pulses, might provide substantial advances in acoustic scanner noise reduction. With such an imaging protocol the sound intensity is expected to drop below 55 dB(A).
MR Hardware Configuration Changes
Restricting the mobility of the gradient coil assembly is a time‐honored engineering approach to make quieter MR scanners. This can be achieved by constructing heavier gradient coils and mountings, thereby effectively limiting their responsiveness to Lorentz forces [Katsunuma et al., 2002]. Mounting the gradient coils supports directly to the floor (that forces immediate absorption of vibrational energy) provides an additional reduction of about 10 dB during EPI imaging [Katsunuma et al., 2002]. These methods reached a maximum because of the currently used strong static magnetic fields and gradient strengths required for ultra‐fast imaging techniques. Evidently, the acceptable total mass of the gradient system is limited [Mansfield et al., 1994, 1995].
An interesting MR hardware development is the incorporation of the gradient coils in vacuum enclosures that effectively interrupt airborne acoustic noise propagation (reduction ∼10 dB) [Katsunuma et al., 2002]. For additional restriction of structure‐borne noise, the gradient assembly is (acoustically) released from its mountings by means of rubber dampers [Katsunuma et al., 2002]. A research scanner with such a configuration provided acoustic noise reductions of up to 30 dB [Edelstein et al., 2002; Katsunuma et al., 2002]. So‐called ″quiet″ MR‐systems have become commercially available encompassing a vacuum enclosed gradient system in addition to insulators (Excelart, Toshiba Corporation, Tochigi, Japan, and Signa Twinspeed, General Electric, Milwaukee, WI) [Katsunuma et al., 2002; Price et al., 2001]. PVC‐vinyl acoustic foam insulators, positioned between the gradient coils and shimming coils, reduce acoustic noise levels by 10 dB during common EPI imaging at 3 T [Foster et al., 2000]. For similar pulse sequences, passive insulation with a fiberglass cylinder mounted directly on the inner warm bore provides approximately 20 dB noise reduction [Mechefske et al., 2002; Moelker et al., 2003b].
An alternative but still experimental solution makes use of the principle of Lorentz force balancing [Bowtell et al., 1995, 1999; Mansfield et al., 1994, 1995, 1998]. In a force balanced coil arrangement, opposite Lorentz forces can mechanically be coupled by embedding the coil in stiff, noncompressive enclosures [Mansfield et al., 1994]. As a result, the opposite forces in the gradient structure will null and quench [McJury and Shellock, 2000]. Typical force balanced gradient coils have proven good noise attenuation of up to 40 dB at particularly low excitation frequencies of 100 Hz, unfortunately decreasing to 0 dB at 3.5 kHz [Mansfield et al., 1995; Mansfield et al., 1994]. The disappointing results were due to the natural resonance frequencies of the gradient structure that were overlapping the excitation frequencies [Mansfield et al., 1994]. In turn these resonances resulted in phase errors, thus providing less cancellation and even unintended boosting of acoustic amplitudes [Mansfield et al., 1994].
Two recent improvements in the acoustic screening principle should be mentioned. First, the natural resonance frequencies of the gradient set could be pushed up toward higher frequencies (minimizes phase errors) [Mansfield et al., 1998]. This can be accomplished by either reducing the dimensions of the gradient supports (Fig. 8) or by choosing stiffer materials [Mansfield et al., 1994, 1995, 1998]. Additional screening loops in the assembly may further quench the natural resonance modes of the gradient structure (Fig. 8) [Mansfield et al., 1998]. For such coil arrangements cast in epoxy glass‐reinforced material, average noise attenuation of about 35 dB at 3.26 kHz has been reported [Mansfield et al., 2000].
Figure 8.
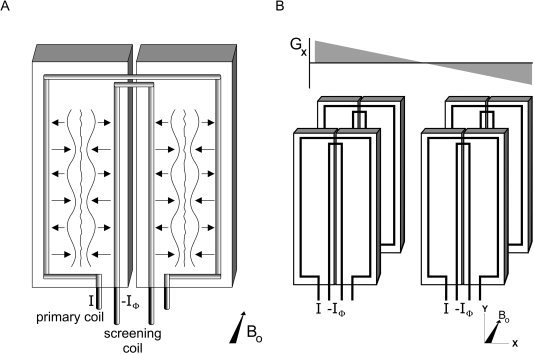
A: Improved principle of acoustic screening by force balancing: small coil dimension and an additional screening coil. The amplitude and phase of the screening currents should be adjusted for optimal acoustic noise reduction. B: Four‐sector gradient coil for generation of x‐, y‐, or z‐gradient (x‐gradient in this figure). F, Lorentz forces acting on gradient coil wires induced the gradient current I.
Other important scanner configuration changes are possible in the restriction of eddy currents in both the RF coil and main magnet [Katsunuma et al., 2002]. A typical low acoustic noise RF coil is equipped with thinner copper plates for less induction of eddy currents and independently mounted to the patient bore [Edelstein et al., 2002]. Similarly, eddy currents are sufficiently strong to cause substantial vibrations in the main magnet [Edelstein et al., 2002]; less noise is produced when making the shielding coils (secondary gradient coils) longer than the magnet [Katsunuma et al., 2002]. This construction effectively counteracts eddy current leakage into the main magnet [Katsunuma et al., 2002].
Passive Noise Reduction
The most widely used approach to counter the effects of scanner noise in fMRI is the simple and economical application of earplugs and/or earmuffs [Dancer et al., 1992; McJury and Shellock, 2000]. Characteristically, these protective devices attenuate proportionally with the frequency [Ravicz et al., 2001]. For example, the extensively used compressional E‐A‐R foam earplug (Aearo Company, Southbridge, UK) provides noise attenuation of 20 dB at 0.5 kHz and 30 dB at the frequencies >1 kHz [Berger et al., 1998; Ravicz et al., 2001]. Earmuffs show a similar reduction pattern, but with slightly less reduction at frequencies <1 kHz [Berger et al., 1998]. Obviously, the efficacy of passive acoustic screening is restricted to air‐conductive hearing. With respect to the close contact of the subject with the mechanically vibrating MR table and imager, bone conduction emerges as a relevant issue in fMRI. Although air conduction dominates in the absence of hearing protection, bone conduction through head and body become significant when wearing earplugs and earmuffs [Ravicz et al., 2001]. Therefore, combining earplug and earmuff results in a subjective attenuation of only 39–49 dB during EPI noise at >1.9 kHz. This is considerably less than an objective reduction, i.e., recordings made in the external ear canal that excludes bone conducted noise, of over 60 dB [Foster et al., 2000; Ravicz et al., 2001].
Incorporation of a passive noise attenuating system into a head RF coil has been suggested as a measure to restrict bone conduction [Talavage et al., 1999]. Ravicz et al. [ 2001] assessed the attenuation efficacy of combining earmuffs and earplugs with a helmet, made of heavy barrier layers of foam composites. Subjective reductions were up to 60 dB with a residual acoustic load that was dominated by body conduction. More commonly used is the application of vacuum‐pumped cushions (inside the head coil) filled with, e.g., sand [Monroe et al., 1999] and eventually in combination with earmuffs [Baumgart et al., 1998; Brechmann et al., 2002]. For complete acoustic screening, total encapsulation of the subject might be a viable option providing an additional reduction of 10 dB [McJury and Shellock, 2000].
An issue that has been raised with the use of passive hearing protectors is the possible interference with speech and syllable understanding relevant to auditory fMRI [Brummett et al., 1988; Chambers et al., 2001; Hurwitz et al., 1989; McJury et al., 1997]. Passive devices, however, improve rather than impair speech intelligibility for normal‐hearing persons in noisy environments [Abel and Spencer, 1997]. The effects of combining passive aids with active noise cancellation on speech are unclear, but evidence suggests that active noise cancellation improves intelligibility by about 10% [Abel and Spencer, 1997]. Another issue with passive noise cancelling devices is the non‐uniform attenuation in the frequency domain. Specifically when performing tonotopic mapping studies of the auditory cortex, one should be aware of the frequency distortions of auditory stimuli. This issue might be circumvented by frequency‐specific compensation of the stimuli in the audio system. Also, the integration of probe tubes in earplugs or earmuffs for pneumatic‐driven sound delivery is helpful. With such devices, auditory stimuli can be conducted to the subject's auditory pathway relatively unattenuated, thereby not impeding stimulus perception. Other concerns with hearing protectors are discomfort and variations in individual fitting. Deep insertion of an earplug, for example, reduces low frequencies (<500 Hz) better than a “partially” inserted earplug [Berger et al., 1998; Dancer et al., 1992; McJury et al., 2000; Ravicz et al., 2001].
Active Noise Cancellation
Additional noise reduction can be achieved by the incorporation of Active Noise Cancellation (ANC) techniques into passive hearing protectors. Active noise cancellation reduces acoustic noise by the introduction of a sound that is exactly the inverse of the original noise [Goldman et al., 1989]. An ANC system makes use of either feedback or feedforward mechanisms [Chen et al., 1999; McJury et al., 1997].
The feedback ANC strategy is used in many commercial headsets (although not yet commercially available for use in MRI) and encompasses an error microphone for capturing residual noise close to the subject's ear, and a processing unit that generates the antisound. Previously, moderate decreases in the perceived noise level (11.1 dB) during both spin‐echo and gradient‐echo pulse sequences have been measured for frequencies of <500 Hz [Goldman et al., 1989]. Implementation of self‐adapting neural networks for further error minimization demonstrated extended noise extinction to about 20 dB while clearly preserving added speech [Chen et al., 1999]. A problem of feedback ANC in auditory fMRI is a result of the short distance between the error microphone and the subject's ear, causing cancellation of both the MR‐related acoustic noise and, more importantly, acoustic stimuli [Chambers et al., 2001].
In feedforward ANC, the microphone is placed close to the noise source and the anti‐noise is injected into the noise propagation path [Chen et al., 1999]. Because the timings and amplitudes of the gradient noise during fMRI are very predictable [Edelstein et al., 2002], a feedforward strategy seems preferable to the feedback strategy [Ravicz et al., 2000]. Noise reductions of up to 40 dB for frequencies between 0.5 and 3 kHz have been reported [Chambers et al., 2001]. The subjective performance during EPI (that includes bone conduction) was substantially worse with reductions of only 12 and 5 dB at 0.6 and 1.9 kHz, respectively [Chambers et al., 2001].
A technique analogous to ANC is active structural acoustic control (ASAC) that might be a novel solution to the acoustic problem in fMRI. This method makes use of panels with vibro‐acoustic sensors and active actuators that introduce antivibrations (similar to anti‐noise but in materials other than air) [Berry, 2001]. Such active panels, combined with passive insulators, could theoretically replace the currently used inner and outer shroud materials of the MR imager, thereby providing SPL reductions over a large frequency range.
In summary, ANC is a promising technique that substantially lessens the imager noise levels, especially at lower frequencies <1 kHz. Considering the current trend toward faster imaging techniques with consequently more intense noise at higher frequencies, the application of ANC in fMRI may become less effective. Combining ANC with passive measures has proven beneficial in terms of the quality of sound (timbre), because of their complementary frequency characteristics [Abel and Spencer, 1999].
CONCLUSIONS
MR‐related acoustic noise has demonstrable effects on fMRI of the auditory cortex. Its interference with auditory functional experiments is primarily a result of direct cortical activation. With respect to the nonauditory cortices, the empirical data to date are limited and sometimes contradictory, therefore more experiments are necessary to better elucidate the effects of MR‐related acoustic noise. The answer to this problem may be in the design of a silent functional paradigm that controls the (psycho‐) acoustic interferences that play a role in the non‐auditory cortices.
The current trend toward clinical fMRI and cognitive research makes the acoustic problem more relevant. In neurodegenerative diseases (e.g., Alzheimer's disease) and psychiatric diseases (e.g., schizophrenia), fixation and attention to stimuli is complicated [Mathiak et al., 2002]. In such patients, the confounding effects of MR‐generated acoustic noise on functional data acquisitions are, therefore, likely to be of greater magnitude. In addition, fMRI plays an increasing role in planning of surgical procedures in the brain, i.e., by delineating diseased from normal tissue [Sunaert and Yousry, 2001]. Impaired statistical inferences from functional images due to artifactual absence of activation might potentially cause normal tissue to be considered diseased. Besides the trend toward clinical imaging, technical developments in magnetic resonance imaging considerably boost the acoustic noise levels and subsequently its effects in fMRI. Until now, most of the fMRI research has been carried out on 1.5 T systems, but the current need for higher field strengths and stronger gradients will lead to substantially more intense scanner noise that may counteract the efforts to reduce acoustic noise.
Various methods to reduce acoustic noise may help to provide artifact‐free fMRI. The efficacy of these measures is, unfortunately, interdependent. For example, derating gradient currents through silent imaging designs lowers the frequency distribution of scanner noise, but thereby also confines the acoustic benefits of passive barrier materials (less reduction at lower frequencies). Consequently, the simultaneous application of both, results in less reduction of the sound intensity than one would expect based on the reduction that can be gained for each method separately. The use of earplugs or earmuffs is currently the most widely used approach to soften the MR‐related acoustic noise to sufficiently low levels. From the hardware engineering perspective, successful advances in noise reduction are primarily in the application of vacuum enclosures with passive acoustic liners. These developments, specifically the hardware modifications, should allow for quieter MRI scanners that enable fast (conventional) fMRI unhampered by MR‐related acoustic noise.
REFERENCES
- Abel SM, Spencer DL (1999): Speech understanding in noise with earplugs and muffs in combination. Appl Acoust 57: 61–68. [Google Scholar]
- Abel, SM , Spencer DL (1997): Active noise reduction versus conventional hearing protection. Relative benefits for normal‐hearing and impaired listeners. Scand Audiol 26: 155–167. [DOI] [PubMed] [Google Scholar]
- Amaro E, Brammer MJ, Cruz AC, Trezza PM, Leite CC, Cerri GG (2001): Comparing silent event related fMRI to normal acquisitions. Proceedings of the 87th Scientific Assembly and Annual Meeting, Chicago, IL. p 137.
- Amaro E, Williams SC, Shergill SS, Fu CH, MacSweeney M, Picchioni MM, Brammer MJ, McGuire PK (2002): Acoustic noise and functional magnetic resonance imaging: Current strategies and future prospects. J Magn Reson Imaging 16: 497‐510. [DOI] [PubMed] [Google Scholar]
- American National Standard (1995): Measurement of sound pressure levels in air. Melville, NY: Acoustical Society of America: S1.13‐1995 [Google Scholar]
- American National Standard S3.44‐1996 (1996): Determination of occupational noise exposure and estimation of noise‐induced hearing impairment. Melville, NY: Acoustical Society of America. [Google Scholar]
- Backes WH, van Dijk P (2002): Simultaneous sampling of event‐related BOLD responses in auditory cortex and brainstem. Magn Reson Med 47: 90–96. [DOI] [PubMed] [Google Scholar]
- Bandettini PA, Cox RW (2000): Event‐related fMRI contrast when using constant interstimulus interval: theory and experiment. Magn Reson Med 43: 540–548. [DOI] [PubMed] [Google Scholar]
- Bandettini PA, Jesmanowicz A, Van Kylen J, Birn RM, Hyde JS (1998): Functional MRI of brain activation induced by scanner acoustic noise. Magn Reson Med 39: 410–416. [DOI] [PubMed] [Google Scholar]
- Baumgart F, Kaulisch T, Tempelmann C, Gaschler‐Markefski B, Tegeler C, Schindler F, Stiller D, Scheich H (1998): Electrodynamic headphones and woofers for application in magnetic resonance imaging scanners. Med Phys 25: 2068–2070. [DOI] [PubMed] [Google Scholar]
- Belin P, Zatorre RJ, Hoge R, Evans AC, Pike B (1999): Event‐related fMRI of the auditory cortex. Neuroimage 10: 417–429. [DOI] [PubMed] [Google Scholar]
- Belliveau JW, Kennedy DN, McKinstry RC, Buchbinder BR, Weisskoff RM, Cohen MS, Vevea JM, Brady TJ, Rosen BR (1991): Functional mapping of the human visual cortex by magnetic resonance imaging. Science 254: 716–719. [DOI] [PubMed] [Google Scholar]
- Berger EH, Franks JR, Behar A, Casali JG, Dixon‐Ernst C, Kieper RW, Merry CJ, Mozo BT, Nixon CW, Ohlin D, Royster JD, Royster LH (1998): Development of a new standard laboratory protocol for estimating the field attenuation of hearing protection devices. Part III. The validity of using subject‐fit data. J Acoust Soc Am 103: 665–672. [DOI] [PubMed] [Google Scholar]
- Berman RA, Colby CL (2002): Auditory and visual attention modulate motion processing in area MT+. Cogn Brain Res 14: 64–74. [DOI] [PubMed] [Google Scholar]
- Bernal B, Altman NR (2001): Auditory functional MR imaging. Am J Roentgenol 176: 1009–1015. [DOI] [PubMed] [Google Scholar]
- Berry A (2001): Advanced sensing strategies for the active control of vibration and structural radiation. Noise Control Eng J 49: 54–65. [Google Scholar]
- Bilecen D, Radu EW, Scheffler K (1998a): The MR tomograph as a sound generator: fMRI tool for the investigation of the auditory cortex. Magn Reson Med 40: 934–937. [DOI] [PubMed] [Google Scholar]
- Bilecen D, Scheffler K, Schmid N, Tschopp K, Seelig J (1998b): Tonotopic organization of the human auditory cortex as detected by BOLD‐fMRI. Hear Res 126: 19–27. [DOI] [PubMed] [Google Scholar]
- Binder JR, Frost JA, Hammeke TA, Cox RW, Rao SM, Prieto T (1997): Human brain language areas identified by functional magnetic resonance imaging. J Neurosci 17: 353–362. [DOI] [PMC free article] [PubMed] [Google Scholar]
- Birn RM, Bandettini PA, Cox RW, Shaker R (1999): Event‐related fMRI of tasks involving brief motion. Hum Brain Mapp 7: 106–114. [DOI] [PMC free article] [PubMed] [Google Scholar]
- Bowtell R, Peters (1999]: Analytic approach to the design of transverse gradient coils with co‐axial return paths. Magn Reson Med 41: 600–608. [DOI] [PubMed] [Google Scholar]
- Bowtell RW, Mansfield P (1995): Quiet transverse gradient coils: Lorentz force balanced designs using geometrical similitude. Magn Reson Med 34: 494–497. [DOI] [PubMed] [Google Scholar]
- Brechmann A, Baumgart F, Scheich H (2002): Sound‐level‐dependent representation of frequency modulations in human auditory cortex: a low‐noise fMRI study. J Neurophysiol 87: 423–433. [DOI] [PubMed] [Google Scholar]
- Brummett RE, Talbot JM, Charuhas P (1988): Potential hearing loss resulting from MR imaging. Radiology 169: 539–540. [DOI] [PubMed] [Google Scholar]
- Burke, M, Schwindt W, Ludwig U, Hennig J, Hoehn M (2000): Facilitation of electric forepaw stimulation‐induced somatosensory activation in rats by additional acoustic stimulation: an fMRI investigation. Magn Reson Med 44: 317–321. [DOI] [PubMed] [Google Scholar]
- Cacace AT, Tasciyan T, Cousins JP (2000): Principles of functional magnetic resonance imaging: application to auditory neuroscience. J Am Acad Audiol 11: 239–272. [PubMed] [Google Scholar]
- Calvert GA, Brammer MJ, Bullmore ET, Campbell R, Iversen SD, David AS (1999): Response amplification in sensory‐specific cortices during cross modal binding. Neuroreport 10: 2619–2623. [DOI] [PubMed] [Google Scholar]
- Campeau NG, Huston J, Bernstein MA, Lin C, Gibbs GF (2001): Magnetic resonance angiography at 3.0 Tesla: initial clinical experience. Top Magn Reson Imaging 12: 183–204. [DOI] [PubMed] [Google Scholar]
- Chambers J, Akeroyd MA, Summerfield AQ, Palmer AR (2001): Active control of the volume acquisition noise in functional magnetic resonance imaging: method and psychoacoustical evaluation. J Acoust Soc Am 110: 3041–3054. [DOI] [PubMed] [Google Scholar]
- Chen CK, Chiueh TD, Chen JH (1999): Active cancellation system of acoustic noise in MR imaging. IEEE Trans Biomed Eng 46: 186–191. [DOI] [PubMed] [Google Scholar]
- Cho ZH, Chung SC, Lim DW, Wong EK (1998): Effects of the acoustic noise of the gradient systems on fMRI: a study on auditory, motor, and visual cortices. Magn Reson Med 39: 331–335. [DOI] [PubMed] [Google Scholar]
- Cho ZH, Park SH, Kim JH, Chung SC, Chung ST, Chung JY, Moon CW, Yi JH, Sin CH, Wong EK (1997): Analysis of acoustic noise in MRI. Magn Reson Imaging 15: 815–822. [DOI] [PubMed] [Google Scholar]
- Counter SA, Borg E (1993): Acoustic middle ear muscle reflex protection against magnetic coil impulse noise. Acta Otolaryngol 113: 483–488. [DOI] [PubMed] [Google Scholar]
- Counter SA, Olofsson A, Grahn HF, Borg E (1997): MRI acoustic noise: sound pressure and frequency analysis. J Magn Reson Imaging 7: 606–611. [DOI] [PubMed] [Google Scholar]
- Cremillieux, Y , Wheeler‐Kingshott CA, Briguet A, Doran SJ (1997): STEAM‐Burst: a single‐shot, multi‐slice imaging sequence without rapid gradient switching. Magn Reson Med 38: 645–652. [DOI] [PubMed] [Google Scholar]
- Dancer A, Grateau P, Cabanis A, Barnabe G, Cagnin G, Vaillant T, Lafont D (1992): Effectiveness of earplugs in high‐intensity impulse noise. J Acoust Soc Am 91: 1677–1689. [DOI] [PubMed] [Google Scholar]
- Dantendorfer K, Amering M, Bankier A, Helbich T, Prayer D, Youssefzadeh S, Alexandrowicz R, Imhof H, Katschnig H (1997): A study of the effects of patient anxiety, perceptions and equipment on motion artifacts in magnetic resonance imaging. Magn Reson Imaging 15: 301–306. [DOI] [PubMed] [Google Scholar]
- de Zwart JA, van Gelderen P, Kellman P, Duyn JH (2002): Reduction of gradient acoustic noise in MRI using SENSE‐EPI. Neuroimage 16: 1151–1155. [DOI] [PubMed] [Google Scholar]
- Di Salle F, Formisano E, Seifritz E, Linden DE, Scheffler K, Saulino C, Tedeschi G, Zanella FE, Pepino A, Goebel R, Marciano E (2001): Functional fields in human auditory cortex revealed by time‐resolved fMRI without interference of EPI noise. Neuroimage 13: 328–338. [DOI] [PubMed] [Google Scholar]
- Duong TQ, Kim DS, Ugurbil K, Kim SG (2000): Spatiotemporal dynamics of the BOLD fMRI signals: toward mapping submillimeter cortical columns using the early negative response. Magn Reson Med 44: 231–242. [DOI] [PubMed] [Google Scholar]
- Edelstein WA, Hedeen RA, Mallozzi RP, El‐Hamamsy SA, Ackermann RA, Havens TJ (2002): Making MRI quieter. Magn Reson Imaging 20: 155–163. [DOI] [PubMed] [Google Scholar]
- Eden GF, Joseph JE, Brown HE, Brown CP, Zeffiro TA (1999): Utilizing hemodynamic delay and dispersion to detect fMRI signal change without auditory interference: the behavior interleaved gradients technique. Magn Reson Med 41: 13–20. [DOI] [PubMed] [Google Scholar]
- Edmister WB, Talavage TM, Ledden PJ, Weisskoff RM (1999): Improved auditory cortex imaging using clustered volume acquisitions. Hum Brain Mapp 7: 89–97. [DOI] [PMC free article] [PubMed] [Google Scholar]
- Ehret G (1997): The auditory cortex. J Comp Physiol [A] 181: 547–557. [DOI] [PubMed] [Google Scholar]
- Elliott MR, Bowtell RW, Morris PG (1999): The effect of scanner sound in visual, motor, and auditory functional MRI. Magn Reson Med 41: 1230–1235. [DOI] [PubMed] [Google Scholar]
- Engelien A, Yang Y, Engelien W, Zonana J, Stern E, Silbersweig DA (2002): Physiological mapping of human auditory cortices with a silent event‐ related fMRI technique. Neuroimage 16: 944–953. [DOI] [PubMed] [Google Scholar]
- Escera C, Alho K, Winkler I, Naatanen R (1998): Neural mechanisms of involuntary attention to acoustic novelty and change. J Cogn Neurosci 10: 590–604. [DOI] [PubMed] [Google Scholar]
- Formisano E, Linden DE, Di Salle F, Trojano L, Esposito F, Sack AT, Grossi D, Zanella FE, Goebel R (2002): Tracking the mind's image in the brain I: time‐resolved fMRI during visuospatial mental imagery. Neuron 35: 185–194. [DOI] [PubMed] [Google Scholar]
- Foster JR, Hall DA, Summerfield AQ, Palmer AR, Bowtell RW (2000): Sound‐level measurements and calculations of safe noise dosage during EPI at 3 T. J Magn Reson Imaging 12: 157–163. [DOI] [PubMed] [Google Scholar]
- Frisina RD (2001]: Subcortical neural coding mechanisms for auditory temporal processing. Hear Res 158: 1–27. [DOI] [PubMed] [Google Scholar]
- Girard F, Marcar VL, Hennel F, Martin E (2000): Anatomic MR images obtained with silent sequences. Radiology 216: 900–902. [DOI] [PubMed] [Google Scholar]
- Goldman AM, Gossman WE, Friedlander PC (1989): Reduction of sound levels with anti‐noise in MR imaging. Radiology 173: 549–550. [DOI] [PubMed] [Google Scholar]
- Hall DA, Haggard MP, Akeroyd MA, Palmer RA, Summerfield AQ, Elliott MR, Gurney EM, Bowtell RW (1999): “Sparse” temporal sampling in auditory fMRI. Hum Brain Mapp 7: 213–223. [DOI] [PMC free article] [PubMed] [Google Scholar]
- Hall DA, Haggard MP, Summerfield AQ, Akeroyd MA, Palmer AR, Bowtell RA (2001): Functional magnetic resonance imaging measurements of sound‐level encoding in the absence of background scanner noise. J Acoust Soc Am 109: 1559–1570. [DOI] [PubMed] [Google Scholar]
- Hall DA, Summerfield AQ, Goncalves MS, Foster JR, Palmer AR, Bowtell RW (2000a): Time‐course of the auditory BOLD response to scanner noise. Magn Reson Med 43: 601–606. [DOI] [PubMed] [Google Scholar]
- Hall WA, Liu H, Martin AJ, Pozza CH, Maxwell RE, Truwit CL (2000b): Safety, efficacy, and functionality of high‐field strength interventional magnetic resonance imaging for neurosurgery. Neurosurgery 46: 632–642. [DOI] [PubMed] [Google Scholar]
- Hari R, Makela JP (1988): Modification of neuromagnetic responses of the human auditory cortex by masking sounds. Exp Brain Res 71: 87–92. [DOI] [PubMed] [Google Scholar]
- Hedeen RA, Mallozzi R, Edelstein WA, Havens T (2001): Vibroacoustic modeling of noise in magnetic resonance imagers. Proceedings of the 9th Annual Meeting of the International Society of Magnetic Resonance in Medicine, Glasgow, UK. p 1751.
- Hedeen RA, Edelstein WA (1997): Characterization and prediction of gradient acoustic noise in MR imagers. Magn Reson Med 37: 7–10. [DOI] [PubMed] [Google Scholar]
- Hennel F (2000): Acoustic optimisation of rapid MRI. Proceedings of the 8th Annual Meeting of the International Society of Magnetic Resonance in Medicine, Denver, CO. p 2010.
- Hennel F (2001): Fast spin echo and fast gradient echo MRI with low acoustic noise. J Magn Reson Imaging 13: 960–966. [DOI] [PubMed] [Google Scholar]
- Hennel F, Girard F, Loenneker T (1999): “Silent” MRI with soft gradient pulses. Magn Reson Med 42: 6–10. [DOI] [PubMed] [Google Scholar]
- Hennig J, Hodapp M (1993): Burst imaging. MAGMA 1: 39–48. [Google Scholar]
- Hu X, Le TH, Ugurbil K (1997): Evaluation of the early response in fMRI in individual subjects using short stimulus duration. Magn Reson Med 37: 877–884. [DOI] [PubMed] [Google Scholar]
- Hurwitz R, Lane SR, Bell RA, Brant‐Zawadzki MN (1989): Acoustic analysis of gradient‐coil noise in MR imaging. Radiology 173: 545–548. [DOI] [PubMed] [Google Scholar]
- Jakob PM, Schlaug G, Griswold M, Lovblad KO, Thomas R, Ives JR, Matheson JK, Edelman RR (1998): Functional burst imaging. Magn Reson Med 40: 614–621. [DOI] [PubMed] [Google Scholar]
- Jancke L, Mirzazade S, Shah NJ (1999): Attention modulates activity in the primary and the secondary auditory cortex: a functional magnetic resonance imaging study in human subjects. Neurosci Lett 266: 125–128. [DOI] [PubMed] [Google Scholar]
- Jancke L, Shah NJ, Posse S, Grosse‐Ryuken M, Muller‐Gartner HW (1998): Intensity coding of auditory stimuli: an fMRI study. Neuropsychologia 36: 875–883. [DOI] [PubMed] [Google Scholar]
- Josephs O, Henson RN (1999): Event‐related functional magnetic resonance imaging: modelling, inference and optimization. Philos Trans R Soc Lond B Biol Sci 354: 1215–1228. [DOI] [PMC free article] [PubMed] [Google Scholar]
- Katsunuma A, Takamori H, Sakakura Y, Hamamura Y, Ogo Y, Katayama R (2002): Quiet MRI with novel acoustic noise reduction. MAGMA 13: 139–144. [DOI] [PubMed] [Google Scholar]
- Le TH, Patel S, Roberts TP (2001): Functional MRI of human auditory cortex using block and event‐related designs. Magn Reson Med 45: 254–260. [DOI] [PubMed] [Google Scholar]
- Liebenthal E, Binder JR, Piorkowski RL, Remez RE (2003): Short‐term reorganization of auditory analysis induced by phonetic experience. J Cogn Neurosci 15: 549–558. [DOI] [PubMed] [Google Scholar]
- Loenneker T, Hennel F, Ludwig U, Hennig J (2001): Silent BOLD imaging. MAGMA 13: 76–81. [DOI] [PubMed] [Google Scholar]
- Lovblad KO, Thomas R, Jakob PM, Scammell T, Bassetti C, Griswold M, Ives J, Matheson J, Edelman RR, Warach S (1999): Silent functional magnetic resonance imaging demonstrates focal activation in rapid eye movement sleep. Neurology 53: 2193–2195. [DOI] [PubMed] [Google Scholar]
- Ludwig U, Loenneker T, Hennel F, Hennig J (1999): Getting rid of acoustic noise: functional MRI with silent simultaneous multislice excitation gradient‐echo (SIMEX) sequences. Proceedings of the 7th Annual Meeting of the International Society of Magnetic Resonance in Medicine, Philadelphia, PA. p 1662.
- Maeder PP, Meuli RA, Adriani M, Bellmann A, Fornari E, Thiran JP, Pittet A, Clarke S (2001): Distinct pathways involved in sound recognition and localization: a human fMRI study. Neuroimage 14: 802–816. [DOI] [PubMed] [Google Scholar]
- Mansfield P, Chapman BL, Bowtell R, Glover P, Coxon R, Harvey PR (1995): Active acoustic screening: reduction of noise in gradient coils by Lorentz force balancing. Magn Reson Med 33: 276–281. [DOI] [PubMed] [Google Scholar]
- Mansfield P, Glover P, Bowtell R (1994): Active rapid acoustic screening: design principles for quiet gradient coils in MRI. Meas Sci Technol 5: 1021–1025. [Google Scholar]
- Mansfield P, Glover PM, Beaumont J (1998): Sound generation in gradient coil structures for MRI. Magn Reson Med 39: 539–550. [DOI] [PubMed] [Google Scholar]
- Mansfield P, Haywood B (2000): Principles of active acoustic control in gradient coil design. MAGMA 10: 147–151. [DOI] [PubMed] [Google Scholar]
- Mathiak K, Rapp A, Kircher TT, Grodd W, Hertrich I, Weiskopf N, Lutzenberger W, Ackermann H (2002): Mismatch responses to randomized gradient switching noise as reflected by fMRI and whole‐head magnetoencephalography. Hum Brain Mapp 16: 190–195. [DOI] [PMC free article] [PubMed] [Google Scholar]
- Mattay VS, Weinberger DR (1999): Organization of the human motor system as studied by functional magnetic resonance imaging. Eur J Radiol 30: 105–114. [DOI] [PubMed] [Google Scholar]
- Mazard A, Mazoyer B, Etard O, Tzourio‐Mazoyer N, Kosslyn SM, Mellet E (2002): Impact of fMRI acoustic noise on the functional anatomy of visual mental imagery. J Cogn Neurosci 14: 172–186. [DOI] [PubMed] [Google Scholar]
- McJury M, Blug A, Joerger C, Condon B, Wyper D (1994): Short communication: acoustic noise levels during magnetic resonance imaging scanning at 1.5 T. Br J Radiol 67: 413–415. [DOI] [PubMed] [Google Scholar]
- McJury M, Shellock FG (2000): Auditory noise associated with MR procedures: a review. J Magn Reson Imaging 12: 37–45. [DOI] [PubMed] [Google Scholar]
- McJury M, Stewart RW, Crawford D, Toma E (1997): The use of active noise control (ANC) to reduce acoustic noise generated during MRI scanning: some initial results. Magn Reson Imaging 15: 319–322. [DOI] [PubMed] [Google Scholar]
- McJury M (1995): Acoustic noise levels generated during high field MR imaging. Clin Radiol 50: 331–334. [DOI] [PubMed] [Google Scholar]
- Mechefske CK, Geris R, Gati JS, Rutt BK (2002): Acoustic noise reduction in a 4 T MRI scanner. MAGMA 13: 172–176. [DOI] [PubMed] [Google Scholar]
- Miyati T, Banno T, Fujita H, Mase M, Narita H, Imazawa M, Ohba S (1999): Acoustic noise analysis in echo planar imaging: multicenter trial and comparison with other pulse sequences. IEEE Trans Med Imaging 18: 733–736. [DOI] [PubMed] [Google Scholar]
- Miyati T, Banno T, Fujita H, Mase M, Narita H, Imazawa M, Sanada S, Koshida K, Kasuga T (2001): Characteristics of acoustic noise in echo‐planar imaging. Front Med Biol Eng 10: 345–356. [DOI] [PubMed] [Google Scholar]
- Moelker A, Wielopolski PA, Pattynama PMT (2003a): Relationship between magnetic field strength and MR‐related acoustic noise levels. MAGMA 16: 52–55. [DOI] [PubMed] [Google Scholar]
- Moelker A, Vogel MW, Pattynama PMT (2003b): Efficacy of passive acoustic screening in the MR‐Environment: Implications for the design of imager and MR‐suite. J Magn Reson Imaging 17: 270–275. [DOI] [PubMed] [Google Scholar]
- Monroe JW, Holtman R, Holtman K, Schmalbrock P, Clymer BD (1999): Evaluation of various materials for acoustic noise attenuation in MRI. Proceedings of the 7th Annual Meeting of the International Society of Magnetic Resonance in Medicine, Glasgow, UK. p 101.
- Oesterle C, Hennel F, Hennig J (2001): Quiet imaging with interleaved spiral read‐out. Magn Reson Imaging 19: 1333–1337. [DOI] [PubMed] [Google Scholar]
- Oesterle C, Hennel F, Kraemer F, Hennig J (1999): Silent spiral imaging. MAGMA 8: S479. [Google Scholar]
- Ogawa S., Lee TM, Kay AR, Tank DW (1990): Brain magnetic resonance imaging with contrast dependent on blood oxygenation. Proc Natl Acad Sci USA 87: 9868–9872. [DOI] [PMC free article] [PubMed] [Google Scholar]
- Ogawa S, Menon RS, Tank DW, Kim SG, Merkle H, Ellermann JM, Ugurbil K (1993): Functional brain mapping by blood oxygenation level‐dependent contrast magnetic resonance imaging. A comparison of signal characteristics with a biophysical model. Biophys J 64: 803–812. [DOI] [PMC free article] [PubMed] [Google Scholar]
- Opitz B, Rinne T, Mecklinger A, von Cramon DY, Schroger E (2002): Differential contribution of frontal and temporal cortices to auditory change detection: fMRI and ERP results. Neuroimage 15: 167–174. [DOI] [PubMed] [Google Scholar]
- Oxenham AJ, Plack CJ (1998): Suppression and the upward spread of masking. J Acoust Soc Am 104: 3500–3510. [DOI] [PubMed] [Google Scholar]
- Parrish T (1999): Functional MR imaging. Magn Reson Imaging Clin N Am 7: 765–782. [PubMed] [Google Scholar]
- Pascal J, Bourgeade A, Lagier M, Legros C (1998): Linear and nonlinear model of the human middle ear. J Acoust Soc Am 104: 1509–1516. [DOI] [PubMed] [Google Scholar]
- Pfleiderer B, Michael N, Ostermann J, Soros P, Heindel W (2002): Visualization of auditory habituation by means of fMRI. Proceedings of the 10th Annual Meeting of the International Society of Magnetic Resonance in Medicine, Honolulu, HI. p 1470.
- Price DL, De Wilde JP, Papadaki AM, Curran JS, Kitney RI (2000): Frequency analysis of MRI acoustic noise. Proceedings of the 8th Annual Meeting of the International Society of Magnetic Resonance in Medicine, Denver, CO. p 2008.
- Price DL, De Wilde JP, Papadaki AM, Curran JS, Kitney RI (2001): Investigation of acoustic noise on 15 MRI scanners from 0.2 T to 3 T. J Magn Reson Imaging 13: 288–293. [DOI] [PubMed] [Google Scholar]
- Prieto TE (1999): Acoustic noise levels in head gradient coils during EPI as a function of frequency encoding direction. Proceedings of the 7th Annual Meeting of the International Society of Magnetic Resonance in Medicine, Philadelphia, PA. p 105.
- Prieto TE, Bennet K, Weyers D (1998): Acoustic noise levels in a head gradient coil during echo planar imaging at 3T. Proceedings of the 6th Annual Meeting of the International Society of Magnetic Resonance in Medicine, Sydney, Australia. p 750.
- Quirk ME, Letendre AJ, Ciottone RA, Lingley JF (1989): Anxiety in patients undergoing MR imaging. Radiology 170: 463–466. [DOI] [PubMed] [Google Scholar]
- Ravicz ME, Melcher JR (2001): Isolating the auditory system from acoustic noise during functional magnetic resonance imaging: examination of noise conduction through the ear canal, head, and body. J Acoust Soc Am 109: 216–231. [DOI] [PMC free article] [PubMed] [Google Scholar]
- Ravicz ME, Melcher JR, Kiang NY (2000): Acoustic noise during functional magnetic resonance imaging. J Acoust Soc Am 108: 1683–1696. [DOI] [PMC free article] [PubMed] [Google Scholar]
- Robson MD, Dorosz JL, Gore JC (1998): Measurements of the temporal fMRI response of the human auditory cortex to trains of tones. Neuroimage 7: 185–198. [DOI] [PubMed] [Google Scholar]
- Rosen BR, Buckner RL, Dale AM (1998): Event‐related functional MRI: past, present, and future. Proc Natl Acad Sci USA 95: 773–780. [DOI] [PMC free article] [PubMed] [Google Scholar]
- Scheffler K, Bilecen D, Schmid N, Tschopp K, Seelig J (1998): Auditory cortical responses in hearing subjects and unilateral deaf patients as detected by functional magnetic resonance imaging. Cereb Cortex 8: 156–163. [DOI] [PubMed] [Google Scholar]
- Scheich H, Baumgart F, Gaschler‐Markefski B, Tegeler C, Tempelmann C, Heinze HJ, Schindler F, Stiller D (1998): Functional magnetic resonance imaging of a human auditory cortex area involved in foreground‐background decomposition. Eur J Neurosci 10: 803–809. [DOI] [PubMed] [Google Scholar]
- Seto E, Sela G, McIlroy WE, Black SE, Staines WR, Bronskill MJ, McIntosh AR, Graham SJ (2001): Quantifying head motion associated with motor tasks used in fMRI. Neuroimage 14: 284–297. [DOI] [PubMed] [Google Scholar]
- Shah NJ, Jancke L, Grosse‐Ruyken ML, Muller‐Gartner HW (1999): Influence of acoustic masking noise in fMRI of the auditory cortex during phonetic discrimination. J Magn Reson Imaging 9: 19–25. [DOI] [PubMed] [Google Scholar]
- Shah NJ, Steinhoff S, Mirzazade S, Zafiris O, Grosse‐Ruyken ML, Jancke L, Zilles K (2000): The effect of sequence repeat time on auditory cortex stimulation during phonetic discrimination. Neuroimage 12: 100–108. [DOI] [PubMed] [Google Scholar]
- Shapleske J, Rossell SL, Woodruff PW, David AS (1999): The planum temporale: a systematic, quantitative review of its structural, functional and clinical significance. Brain Res Rev 29: 26–49. [DOI] [PubMed] [Google Scholar]
- Shellock FG, Morisoli SM, Ziarati M (1994): Measurement of acoustic noise during MR imaging: evaluation of six “worst‐case” pulse sequences. Radiology 191: 91–93. [DOI] [PubMed] [Google Scholar]
- Shellock FG, Ziarati M, Atkinson D, Chen DY (1998): Determination of gradient magnetic field‐induced acoustic noise associated with the use of echo planar and three‐dimensional, fast spin echo techniques. J Magn Reson Imaging 8: 1154–1157. [DOI] [PubMed] [Google Scholar]
- Sunaert S, Yousry TA (2001): Clinical applications of functional magnetic resonance imaging. Neuroimaging Clin N Am 11: 221–236. [PubMed] [Google Scholar]
- Talavage TM, Edmister WB, Ledden PJ, Weisskoff RM (1998a): Quantification of the impact of fMRI scanner noise on auditory cortex. Proceedings of the 6th Annual Meeting of the International Society of Magnetic Resonance in Medicine. p 1502.
- Talavage TM, Edmister WB (1998b): Saturation and nonlinear fMRI responses in auditory cortex. Neuroimage 7: S362. [Google Scholar]
- Talavage TM, Edmister WB, Ledden PJ, Weisskoff RM (1999): Quantitative assessment of auditory cortex responses induced by imager acoustic noise. Hum Brain Mapp 7: 79–88. [DOI] [PMC free article] [PubMed] [Google Scholar]
- Tanaka H, Fujita N, Watanabe Y, Hirabuki N, Takanashi M, Oshiro Y, Nakamura H (2000): Effects of stimulus rate on the auditory cortex using fMRI with 'sparse' temporal sampling. Neuroreport 11: 2045–2049. [DOI] [PubMed] [Google Scholar]
- Ulmer JL, Biswal BB, Mark LP, Mathews VP, Prost RW, Millen SJ, Garman JN, Horzewski D (1998a): Acoustic echoplanar scanner noise and pure tone hearing thresholds: the effects of sequence repetition times and acoustic noise rates. J Comput Assist Tomogr 22: 480–486. [DOI] [PubMed] [Google Scholar]
- Ulmer JL, Biswal BB, Yetkin FZ, Mark LP, Mathews VP, Prost RW, Estkowski LD, McAuliffe TL, Haughton VM, Daniels DL (1998b): Cortical activation response to acoustic echo planar scanner noise. J Comput Assist Tomogr 22: 111–119. [DOI] [PubMed] [Google Scholar]
- Vouloumanos A, Kiehl KA, Werker JF, Liddle PF (2001): Detection of sounds in the auditory stream: event‐related fMRI evidence for differential activation to speech and nonspeech. J Cogn Neurosci 13: 994–1005. [DOI] [PubMed] [Google Scholar]
- Woldorff MG, Gallen CC, Hampson SA, Hillyard SA, Pantev C, Sobel D, Bloom FE (1993): Modulation of early sensory processing in human auditory cortex during auditory selective attention. Proc Natl Acad Sci USA 90: 8722–8726. [DOI] [PMC free article] [PubMed] [Google Scholar]
- Yacoub E, Hu X (2001b): Detection of the early decrease in fMRI signal in the motor area. Magn Reson Med 45: 184–190. [DOI] [PubMed] [Google Scholar]
- Yacoub E, Le TH, Ugurbil K, Hu X (1999): Further evaluation of the initial negative response in functional magnetic resonance imaging. Magn Reson Med 41: 436–441. [DOI] [PubMed] [Google Scholar]
- Yacoub E, Shmuel A, Pfeuffer J, Van De Moortele PF, Adriany G, Andersen P, Vaughan JT, Merkle H, Ugurbil K, Hu X (2001a): Imaging brain function in humans at 7 Tesla. Magn Reson Med 45: 588–594. [DOI] [PubMed] [Google Scholar]
- Yang Y, Engelien A, Engelien W, Xu S, Stern E, Silbersweig DA (2000): A silent event‐related functional MRI technique for brain activation studies without interference of scanner acoustic noise. Magn Reson Med 43: 185–190. [DOI] [PubMed] [Google Scholar]