

Abstract
The neural basis of the automatic activation of words was investigated in an fMRI study. In the study, words were presented briefly (51 or 151 msec) followed by a mask. To prevent attentional processing, subjects attended to the masks and not the words, and were required to make perceptual judgment about the masks. We found that a distributed neural network (including the frontal, temporal, occipital, parietal lobes, and the cerebellum) was activated during non‐attentional processing of words in both exposure durations. A significant main effect of presentation duration was found in bilateral cerebellum and the right fusiform gyrus, suggesting their role in the later (151 msec) processing of words. In addition, a significant interaction between presentation duration and word frequency was obtained. When the presentation duration was 151 msec, no significant difference in activation was found between high‐ and low‐frequency words. Alternatively, when the presentation duration was 51 msec, high‐frequency words evoked significantly greater activation in bilateral fusiform gyri, cerebellum, right inferior parietal lobe, medial frontal gyrus (BA 45/46/9), and the right temporal‐occipital junction (BA 21/37). These results suggest that these regions are sensitive to word frequency, and are related to both the attentional and non‐attentional access of lexical representations. Hum. Brain Mapping 18:215–221, 2003. © 2003 Wiley‐Liss, Inc.
Keywords: automatic activation, non‐attentional processing, exposure duration, Chinese words, fMRI
INTRODUCTION
An important aspect of reading is that lexical form and semantics are activated automatically. This occurs even when people cannot recall the word that they have been shown, and even when attention is directed to a non‐linguistic task. Such conditions are created through the use of stimuli followed quickly by a mask [e.g., Dehaene et al., 2001; Kouider and Dupoux, 2001] or through attentional manipulations [e.g., Price et al., 1996]. Cognitive studies with children indicate that the automatic activation of lexical form in reading is a prerequisite to normal reading.
The automatic processing of visual words is modulated by a number of linguistic variables, with frequency being especially important. This is witnessed by the observation that the processing of frequently encountered words requires less attentional allocation than uncommon words, with uncommon words demanding attentional allocation particularly at the semantic level [Becker, 1979].
Despite the importance of the automatic processing of words and the role of word frequency, their neural mechanisms are not well elucidated. Fiebach et al. [2002] found that low‐frequency words showed more activation in the left inferior frontal gyrus, the anterior insula, the thalamus, and the caudate nucleus. Fiez et al. [1999] found that low‐frequency words created slightly more activation in Brodmann's area (BA) 22, and a non‐significantly greater amount of activation at the supplementary motor area (SMA/BA 6).
We examined the neural basis of reading at different time intervals using a masking paradigm, whereby subjects were asked to make a perceptual judgment about a mask that quickly followed a word stimulus. We did this in order to examine how words are processed in an unattended condition [Dehaene et al., 2001].
To examine processing at different time intervals, we used two manipulations, word frequency and the length of time that the words were exposed for. Exposure duration was 51 or 151 msec, word frequency was high or low. A 51‐msec exposure duration was used so that very early processing in reading could be examined, whereas at 151 msec, the processing of individual lexical form should be largely completed [Perfetti and Tan, 1998]. Furthermore, when stimuli words are masked and presented for only 51 msec, no significant awareness of them is typically found [e.g., Kouider and Dupoux, 2001]. The frequency manipulation allows us to see how the speed of word processing is modulated by frequency.
SUBJECTS AND METHODS
Subjects
Eight right‐handed college students (4 men, 4 women; age range, 18–28 years) participated in the study. They were familiarized with the procedure of the experiment before scanning.
Design
The experiment used a 2 (word frequency: high, low) × 2 (exposure duration: 51, 151 msec) design. It consisted of two runs (scanning sessions), with a 51‐msec exposure duration in one run and a 151‐msec exposure duration in the other. In each experimental trial, a character was presented first (either 51 or 151 msec) followed by one of two figures (see Fig. 1) serving as a mask for either 849 msec in the long exposure duration or 949 msec in the short exposure duration. If the mask was  (see Perfetti et al., 1988, Perfetti et al. 1991), participants responded by pressing a button, otherwise they did not make any response. In the baseline trials, the procedure was the same as the experimental trials but the character was replaced by a non‐character (but character‐like) stimulus “
 ” or “
 ”.
”.
Figure 1.
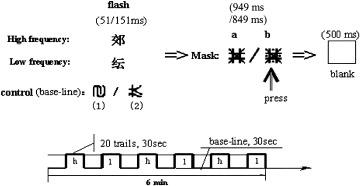
Examples and arrangement of material. In each trail, a Chinese character was presented for either 151 msec or 51 msec, and was then replaced by a target drawing. This drawing remained on the screen until 1 sec had elapsed from the initial presentation of the character. The tasks were arranged into 6 blocks. Three used high‐frequency characters and 3 used low‐frequency characters. Each block consisted of 20 trials. The control condition (baseline) also consisted of 6 blocks, with the control stimuli presented for the same duration as the test stimuli. Control stimuli were presented in the same session.
Each run had twelve 30‐sec blocks including 6 experimental and 6 baseline blocks (see Fig. 1). In each run, within the experimental blocks, three blocks used high‐frequency words and the other three used low‐frequency words. Each block consisted of twenty 1.5‐sec trials. In total, it took 6 min to finish a run.
Behavioral experiment
We recruited a different group of 20 participants from the same participant pool to perform a behavioral experiment identical to the fMRI experiment. None had participated in the fMRI study. Response times (RTs) and accuracy data were collected. In addition, to see if the subject's attention to the mask was influenced by the preceding words under different exposure duration conditions, subjects were required to perform a recognition task after the experiment, in which they were asked to judge if the words in a list (only half of them were previously shown) had been previously displayed.
Apparatus and procedure
This study was performed on a 2 T GE/Elscint Prestige whole‐body MRI scanner (Elscint Ltd., Haifa, Israel). Functional scans were obtained using a single‐shot T2*ast;‐weighted gradient‐echo echo planar imaging (EPI) sequence (20 contiguous axial slices, slice thickness = 6 mm, in‐plane resolution = 2.9 × 2.9 mm, TR/TE/θ= 3,000 msec/65 msec/90 degrees; FOV = 373 × 210 mm2; matrix, 128 × 72). For each slice, 120 images were acquired with a total scan time of 360 sec. The high‐resolution anatomical images were acquired using a T1‐weighted, Spoiled GRASS imaging (spgr) sequence resample (70 sagittal slice with 2‐mm thickness each; FOV, 220 × 220 mm2; matrix, 220 × 220).
Data analysis
We used the AFNI v. 2.2 software (NIMH) for image processing. The images of the first four time‐points were discarded. Images were pre‐processed using the iterated linearized weighted least square algorithm to correct small head motions. The impulse response functions were estimated for each voxel. General linear tests were used to test the significance of each condition at multiple time lags, and then approximate the area under the curve by summing the impulse response function parameters over all time lags. The output represented by activation maps was used as input data for further group analyses.
After spatial normalization to the Talairach brain atlas [Talairach and Tournoux, 1988], re‐sampled as 1 mm3 and smoothed with FWHM = 3 mm, the activation maps of individual subjects were analyzed with the applied linear statistical model using a two‐factor analysis of variance [Neter et al., 1996] and post‐hoc t‐tests. For the contrast between words and the baseline, the voxel‐wise threshold was set at P < 0.005. To control for multiple statistical comparisons, corrected significance values for multiple comparisons based on the result of a Monte Carlo simulation at the cluster level were used. The Talairach coordinates of the max‐of‐mass and volume (mm3) of the activation clusters were determined based on the averaged activation maps.
Selection of ROIs
Based on previous studies of language processing, we selected the following brain areas as regions of interest (ROI): bilateral inferior frontal gyri (around Broca's area, BA 44/6/45), superior temporal gyri (BA 22), inferior parietal lobes (BA 40), fusiform gyri (BA 37), and cerebellums. All these areas have been found to mediate language processing [see Fiez and Peterson, 1998 for review].
RESULTS
Behavioral
In terms of responses to the masks, no significant RT or accuracy difference in the four different conditions was found, all Fs < 1. The average RT was 445 msec for high‐ and 442‐msec for low‐frequency trials in the short‐exposure duration condition; and 438 msec for high‐ and 437 msec for low‐frequency words in the long‐exposure duration condition. The accuracy rate was at ceiling (above 95%) across all conditions.
In terms of the accuracy rate of word recognition, all groups were at the chance level. In the short‐exposure duration condition, the hit rate/miss rate/false alarm rate/correct rejection rates were 36.8, 63.2, 39.4, and 60.6% for high‐frequency words and 31.4, 68.6, 31.3, and 68.7% for low‐frequency trials, respectively. In the long‐exposure duration condition, the hit rate/miss rate/false alarm rate/correct rejection rates were 37.9, 62.1, 37.6, and 62.4% for high‐frequency trials and 34.9, 65.1, 33.5, and 66.5% for low‐frequency trials, all ts < 1. The non‐significant differences in hit/miss rates between exposure durations and between word frequency suggests that subjects attended to the masks and not the words during the experiment.
fMRI
The results of the short exposure duration condition are shown in Figure 2a (for high‐frequency words) and Figure 2b (for low‐frequency words) (see also Table I). High‐frequency words resulted in a significant activation in many regions: bilateral fusiform gyri (BA 37), superior parietal lobes (BA 7), lingual gyri (BA 19) and cerebellums, left cuneus (BA 17), right precentral gyrus (BA 6), medial frontal gyrus (BA 9/45/46), inferior parietal gyrus (BA 40), and occipital‐temporal junction (BA 21/37); low‐frequency words resulted in activation only in left superior temporal gyrus (BA 38), left inferior frontal gyrus (BA 47), and right medial occipital gyrus (BA 19). The direct comparison revealed a significant difference in the right fusiform gyrus (BA 37) and medial temporal gyrus (BA 21) (corrected P < 0.05).
Figure 2.
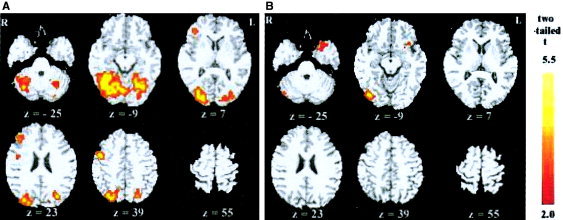
Significant brain activity resulting from high‐ (a) and low‐ (b) frequency words in the 51‐msec exposure duration condition.
Table I.
Peak activation loci and t scores in the short‐exposure duration condition
| Exposure duration = 51 msec | ||||
|---|---|---|---|---|
| x | y | z | t | |
| High‐frequency wordsa | ||||
| R medial frontal gyrus (BA45/46) | −38 | 36 | 17 | 4.43 |
| R GPrc (BA6) | −42 | 4 | 36 | 4.54 |
| R medial frontal gyrus (BA9) | −41 | 37 | 29 | 4.84 |
| L fusiform gyrus (BA37) | 20 | −42 | −13 | 4.65 |
| R fusiform gyrus (BA37) | −33 | −52 | −8 | 4.71 |
| R temporal‐occiptal junction (BA21/37) | −48 | −52 | −10 | 4.96 |
| R inferior parietal lobules (BA40) | −32 | −67 | 38 | 4.28 |
| L superior parietal lobules (BA7) | 23 | −68 | 35 | 4.82 |
| R superior parietal lobules (BA7) | −19 | −67 | 34 | 4.70 |
| L fusiform gyrus (BA19) | 22 | −60 | −8 | 4.51 |
| R lingual gyrus (BA19) | −6.5 | −58 | −1 | 4.31 |
| R medial occipital gyrus (BA18) | −31 | −78 | 21 | 4.55 |
| L cuneus (BA 17) | 7 | −88 | 3 | 4.77 |
| L cerebellum | 27 | −62 | −19 | 5.11 |
| R cerebellum | −26 | −66 | −19 | 5.02 |
| Low‐frequency wordsb | ||||
| L inferior frontal gyrus (BA47) | 30 | 19 | −20 | 4.12 |
| L superior temporal gyrus (BA38) | 26 | 10 | −31 | 3.14 |
| R medial occipital gyrus (BA19) | −37 | −73 | −5 | 3.43 |
| High vs. lowb | ||||
| R fusiform gyrus (BA37) | −45 | −46 | −13 | 4.45 |
| R medial temporal gyrus (BA21) | −45 | −43 | −5 | 4.04 |
Cluster threshold: 2,000 mm3.
Cluster threshold: 3,000 mm3.
BA, Brodmann's area.
The results of the long‐exposure duration condition are shown in Figure 3 and Table II. Areas recruited by high‐frequency words were bilateral fusiform gyri (BA 37), left medial and superior occipital gyrus (BA 18/19), right superior temporal gyrus (BA 22), occipital‐temporal junction (BA 21/37), and bilateral cerebellums (t > 2.2, corrected P < 0.05, see Fig. 3a); low‐frequency words showed activation in bilateral fusiform gyri (BA 37), left medial and superior occipital gyrus (BA 18/19), right superior temporal gyrus (BA 22), occipital‐temporal junction (BA 21/37) and bilateral cerebellums (corrected P < 0.05, see Fig. 3b).
Figure 3.
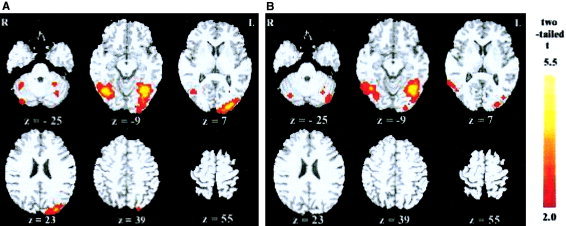
Brain areas activated by high‐ (a) and low‐ (b) frequency words with an exposure duration of 151 msec. Normalized brain activation maps are averaged across eight subjects, with colored regions showing statistically significant activation (corrected P < 0.05). All of the functional maps (in color) are overlaid on corresponding T1 images (gray scale).
Table II.
Peak activation loci and t scores in the long‐exposure duration condition*
| Exposure duration = 151 msec | ||||
|---|---|---|---|---|
| x | y | z | t | |
| High frequency words | ||||
| R superior temporal gyrus (BA22) | — | — | — | — |
| L fusiform gyrus (BA37) | 30 | −69 | −11 | 2.82 |
| R fusiform gyrus (BA37) | −35 | −60 | −14 | 3.09 |
| R temporal‐occiptal junction (BA21/37) | −48 | −56 | −6 | 3.13 |
| L fusiform gyrus (BA19) | 31 | −65 | −16 | 2.75 |
| L superior occipital gyrus (BA19) | 19 | −84 | 16 | 3.08 |
| L medial occipital gyrus (BA18) | 28 | −84 | 7 | 3.01 |
| L Cerebellum | 31 | −63 | −19 | 2.68 |
| R Cerebellum | −34 | −52 | −18 | 3.16 |
| Low frequency words | ||||
| R superior temporal gyrus (BA22) | −57 | −47 | 11 | 2.33 |
| L fusiform gyrus (BA37) | 41 | −62 | −10 | 3.05 |
| R fusiform gyrus (BA37) | −49 | −50 | −17 | 2.87 |
| R temporal‐occiptal junction (BA21/37) | −49 | −56 | −6 | 3.81 |
| L fusiform gyrus (BA19) | 37 | −66 | −10 | 3.03 |
| L superior occipital gyrus (BA19) | — | — | — | — |
| L medial occipital gyrus (BA18) | 36 | −81 | −20 | 3.45 |
| L Cerebellum | 37 | −73 | −22 | 2.79 |
| R Cerebellum | −37 | −43 | −39 | 2.48 |
Cluster threshold: 4,000 mm3.
BA, Brodmann's area.
The comparison of results between long‐ and short‐exposure duration condition showed that more areas were activated by high‐frequency words than by low‐frequency words in the short‐exposure duration condition. However, no significant difference was obtained in the 151‐msec exposure duration condition, reflecting an interaction between word frequency and exposure duration.
Further analysis of ROIs (see Table III, Fig. 4) (with nonparametric Wilcoxon signed‐rank test) showed a significant exposure duration effect in bilateral cerebellums (left: Z = 2.16, P < 0.05; right: Z = 2.37, P < 0.05) and right fusiform gyrus (Z = 2.11, P < 0.05), where stronger activation was evoked at the longer duration relative to the short one.
Table III.
ROIs analyses for high‐ and low‐frequency words, as a function of exposure duration†
| Exposure duration | Word frequency | Fusiform gyrus | Inferior prefrontal | Inferior parietal | Posterior temporal | Cerebellum | |||||
|---|---|---|---|---|---|---|---|---|---|---|---|
| LHa, c | RHb, c | LH | RHb, c | LHa, c | RHa, c | LHa, c | RHc | LHa, c | RHc | ||
| Long | High | 12.20 | 11.88 | 13.62 | 14.47 | 11.53 | 15.73 | 10.92 | 13.52 | 11.58 | 11.58 |
| (82.3) | (60.1) | (93.6) | (64.0) | (146.3) | (115.7) | (107.0) | (67.4) | (514.8) | (378.3) | ||
| Low | 15.34 | 13.38 | 14.99 | 18.47 | 15.14 | 18.89 | 13.67 | 16.78 | 13.67 | 13.43 | |
| (60.0) | (63.9) | (105.6) | (92.4) | (140.1) | (134.8) | (103.3) | (94.9) | (443.8) | (422.0) | ||
| Short | High | 22.95 | 23.51 | 21.40 | 28.00 | 16.34 | 20.62 | 15.36 | 18.19 | 15.78 | 21.32 |
| (153.1) | (180.0) | (255.1) | (220.9) | (275.2) | (334.9) | (211.0) | (238.2) | (780.0) | (819.7) | ||
| Low | 1.18 | 1.97 | 7.52 | 7.09 | 4.38 | 5.8 | 4.14 | 5.32 | 3.94 | 4.61 | |
| (41.0) | (40.9) | (73.2) | (76.2) | (92) | (91.2) | (69.9) | (69.3) | (332.6) | (343.1) | ||
We chose five regions in each hemisphere as our ROIs. For each region of interest, individual regional magnitude values were computed for each of a set of individual correlational images. These regional magnitude values were then submitted to standard statistical analysis. The first number in each unit is the average magnitude of “intensity” in each ROI across subjects, which indicates the level of functional activity; the number in parentheses is the average number of “active” voxels that satisfy the significance criterion (i.e., F > 3.9) in each ROI.
Significant (P < 0.05) exposure duration effect in low‐frequency words.
Marginally significant (P = 0.051) exposure duration effect in low‐frequency words.
Significant (P < 0.05) frequency effect in the 51‐msec‐exposure duration condition.
Figure 4.
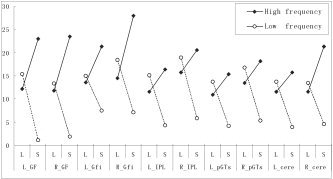
Interactions in ROI analysis. The solid line indicates the linear trend of activation by high frequency words from the long exposure duration (L) to the short exposure duration (S). The dotted line indicates the linear trend of activation by low frequency words from the long exposure duration (L) to the short exposure duration (S). The value of the y‐coordinate indicates the average intensity of functional activity in each ROI.
The interaction between exposure duration and frequency was significant in all selected regions of interest (Z > 2.0, P < 0.05). At the short duration, the difference in activation evoked by high‐ and low‐frequency words reached a significant level (Z > 2.0, P < 0.05). However, at the long duration, no significant difference was found between the processing of high‐ and low‐frequency words (Z < 1.0)
DISCUSSION
Our results showed that frontal, temporal, occipital, parietal lobes and the cerebellum were activated during non‐attentional processing of words. These areas are very similar to those found in fMRI studies of attentional processing of Chinese [e.g., Tan et al., 2000], where activation tends to be more bilateral than alphabetic scripts.
The major result of this study was that we showed that it was possible to isolate the effect of word frequency at short‐exposure duration presentations. In particular, in the analysis, there was a significant main effect of exposure duration in the bilateral cerebellums and right fusiform gyrus, and a significant interaction between exposure duration and frequency in a number of different areas. In the short‐exposure duration condition, the difference in activation evoked by high‐ and low‐frequency words was significant in all ROIs including bilateral fusiform gyri, cerebellums, postero‐superior temporal lobe, inferior parietal lobes, and inferior prefrontal lobes. In the long‐exposure duration condition, the processing of high‐ and low‐frequency words did not cause any significant differences in these areas. Similar to our finding, Price et al. [1994] reported that there was a significant effect of exposure duration during language processing, with activity differences being greater in a short exposure compared to long exposure duration. Together, these results suggest that by 151 msec, the processing of the individual lexical word forms is relatively complete (and hence the lack of a frequency effect). This result is in agreement with behavioral studies [e.g., Perfetti and Tan, 1998], which have shown that words exposed for a similar duration are able to be activated enough to be recognized, and hence presumably have had their individual lexical form retrieved, unlike those presented at the shorter duration.
Apart from the frequency effect, the other major contribution of this study was that we showed that it is possible to isolate different components used in reading at short‐ and long‐exposure durations. At the short‐exposure duration, there was activation in the posterior–superior temporal lobe, the inferior prefrontal lobe, and the inferior parietal lobe. In the long‐exposure duration, activation levels had increased in the right fusiform gyrus and bilateral cerebellums. In general, the areas activated are similar to those of other studies [for a review, see Fiez and Petersen, 1998]. However, this study shows that some are activated very early in processing (i.e., our 51‐msec conditions), whereas some are activated later (i.e., our 151‐msec conditions).
One pattern of particular importance was the increasing activation level of the cerebellum at different exposure durations. It is now clear that the cerebellum participates in a much wider range of functions (including language) than just coordinating autonomic and somatic motor functions [Fiez, 1996; Gao et al., 1996; Middleton et al., 1994]. This study shows that the cerebellum has a greater role in the later stage (151 msec) of words' processing under non‐attentional conditions.
In conclusion, there were two main results from this study. First, we showed that using words exposed for different durations, frequency effects could be isolated to different stages of processing. Second, we showed that brain structures used in reading are very similar when people do or do not allocate attention to the words. This suggests that much of the processing that occurs when reading occurs automatically.
Acknowledgements
We thank Charles Perfetti for his helpful advice.
REFERENCES
- Becker CA (1979): Semantic context and word frequency effect in visual word recognition. J Exp Psychol 5: 252–259. [DOI] [PubMed] [Google Scholar]
- Dehaene S, Naccache L, Cohen L, Bihan DL, Mangin JF, Poline JB, Riviere D (2001): Cerebral mechanisms of word masking and unconscious repetition priming. Nat Neurosci 4: 752–758. [DOI] [PubMed] [Google Scholar]
- Fiebach CJ, Friederici AD, Muller K, von Cramon DY (2002): fMRI evidence for dual routes to the mental lexicon in visual word recognition. J Cogn Neurosci 14: 11–23. [DOI] [PubMed] [Google Scholar]
- Fiez JA (1996): Cerebellar contributions to cognition. Neuron 16: 13–15. [DOI] [PubMed] [Google Scholar]
- Fiez JA, Peterson SE (1998): Neuroimaging studies of word reading. Proc Natl Acad Sci USA 95: 914–921. [DOI] [PMC free article] [PubMed] [Google Scholar]
- Fiez JA, Balota DA, Raichle ME, Petersen SE (1999): Effects of lexicality, frequency, and spelling‐to‐sound consistency on the functional anatomy of reading. Neuron 24: 205–218 [DOI] [PubMed] [Google Scholar]
- Gao J‐H, Parsons LM, Bower JM, Xiong J, Li J, Fox PT (1996): Cerebellum implicated in sensory acquisition and discrimination rather than motor control. Science 272: 545–547. [DOI] [PubMed] [Google Scholar]
- Kouider S, Dupoux E (2001): A functional disconnection between spoken and visual word recognition: evidence from unconscious priming. Cognition 82: B35–B49. [DOI] [PubMed] [Google Scholar]
- Middleton FA, Strick PL (1994): Anatomical evidence for cerebellar and basal ganglia involvement in higher cognitive function. Science 266: 458–61 [DOI] [PubMed] [Google Scholar]
- Neter J, Kutner MH, Nachtsheim CJ, Wasserman W (1996): Applied linear statistical models, 4th ed. Chicago: Irwin. [Google Scholar]
- Perfetti CA, Tan LH (1998): The time course of graphic, phonological, and semantic activation in Chinese character identification. J Exp Psychol 24: 101–118. [Google Scholar]
- Perfetti CA, Zhang S (1991): Phonological processing in reading Chinese characters. J Exp Psychol 17: 633–643. [Google Scholar]
- Perfetti CA., Bell LC, Delaney SM (1988): Automatic (pre‐lexical) phonetic activation in silent word reading: Evidence from back masking. J Mem Lang 27: 59–70. [Google Scholar]
- Price CJ, Wise RJ, Watson JD, Patterson K, Howard D, Frackowiak RS (1994): Brain activity during reading. The effects of exposure duration and task. Brain 117: 1255–1269. [DOI] [PubMed] [Google Scholar]
- Price CJ, Wise RJ, Frackowiak RSJ (1996): Demonstrating the implicit processing of visually presented words and pseudowords. Cereb Cortex 6: 62–70. [DOI] [PubMed] [Google Scholar]
- Talairach J, Tournoux P (1988): Co‐planar sereotaxc atlas of the human brain. Rayport M, translator. New York: Thieme Medical Publishers. [Google Scholar]
- Tan LH, Spinks JA, Gao JH, Liu HL, Perfetti CA, Xiong J, Stofer KA, Pu Y, Liu Y, Fox PT (2000): Brain activation in the processing of Chinese characters and words: A functional MRI study. Hum Brain Mapp 10: 16–27. [DOI] [PMC free article] [PubMed] [Google Scholar]