

Abstract
Positron emission tomography (PET) was used to study the involvement of supraspinal structures in human locomotion. Six right‐handed adults were scanned in four conditions while imagining locomotor‐related tasks in the first person perspective: Standing (S), Initiating gait (IG), Walking (W) and Walking with obstacles (WO). When these conditions were compared to a rest (control) condition to identify the neural structures involved in the imagination of locomotor‐related tasks, the results revealed a common pattern of activations, which included the dorsal premotor cortex and precuneus bilaterally, the left dorsolateral prefrontal cortex, the left inferior parietal lobule, and the right posterior cingulate cortex. Additional areas involving the pre‐supplementary motor area (pre‐SMA), the precentral gyrus, were activated during conditions that required the imagery of locomotor movements. Further subtractions between the different locomotor conditions were then carried out to determine the cerebral regions associated with the simulation of increasingly complex locomotor functions. These analyses revealed increases in rCBF activity in the left cuneus and left caudate when the W condition was compared to the IG condition, suggesting that the basal ganglia plays a role in locomotor movements that are automatic in nature. Finally, subtraction of the W from the WO condition yielded increases in activity in the precuneus bilaterally, the left SMA, the right parietal inferior cortex and the left parahippocampal gyrus. Altogether, the present findings suggest that higher brain centers become progressively engaged when demands of locomotor tasks require increasing cognitive and sensory information processing. Hum. Brain Mapping 19:47–62, 2003. © 2003 Wiley‐Liss, Inc.
Keywords: walking, standing, obstacles, motor imagery
INTRODUCTION
Walking requires the production of a basic locomotor rhythm that coordinates the patterns of muscle activation, the control of the moving body, and the adaptation of these movements to meet the environmental demands [Patla, 1991]. The motor commands that elicit this complex sequential behavior in mammals are generated at the spinal level by a “Central Pattern Generator” (CPG). Fine control of stepping movements, however, is believed to depend on higher brain centers including the motor cortex [Armstrong 1986; Drew et al., 1996]. The primary motor cortex would be involved in the modulation of locomotion, particularly when precise control of limb trajectory and foot placement is needed [Armstrong and Drew, 1984; Drew, 1991]. Neurons in the primary motor cortex of cats are not only active throughout the step cycle, but they increase their level of activity before and during stepping over an obstacle as well. The latter findings suggest that the activity in the primary motor cortex can be modulated through visual information that the animal uses to modify the limb trajectory necessary for avoiding the obstacle [Drew, 1988, 1991, 1993]. Altogether, the results of animal studies support the notion that the M1 cortex [Rossignol, 1996] contributes to the regulation of visually controlled locomotion.
While sharing many similarities with quadrupeds, the motor control of human walking presents some unique features. For instance, the existence of a locomotor CPG in human is still a matter of debate. Evidence in favor of its existence comes from observations in infants who show spontaneous rythmic stepping movements immediately after birth if they are held erect and moved along a horizontal surface [Forssberg, 1985; Lamb and Yang, 2000]. Unlike spinal cats, however, humans with complete transection of the spinal cord are not able to walk [Bussel et al., 1996; Calancie et al., 1994]. Moreover, spontaneous, rythmic, and alternating activity in flexors and extensors of the lower limbs in adults with a spinal cord lesion is rare [Calancie et al., 1994]. Such findings suggest that, contrary to cats, the activation of human locomotor structures within the brainstem and spinal cord are more dependent upon cortical and subcortical inputs. Data supporting this statement come from several sources. First, recent studies using transcranial magnetic stimulation in humans have demonstrated that the primary motor cortex exerts a fine control on ankle muscles during the swing phase of locomotion [Lavoie et al., 1997]. Second, this cortical region has been shown to be as tightly linked to the activity of the ankle dorsiflexors during locomotion as during voluntary contractions [Capaday et al., 1999], hence suggesting that the biomechanical demands of bipedal locomotion have further encephalised the neural control of human walking [Capaday et al., 1999; Lavoie et al., 1997]. Third, Nutt and colleagues [1993] have reported that patients with lesions involving the premotor cortex have difficulty in initiating and maintaining gait when turning or negotiating narrow passages. Fourth, neurophysiological and biomechanical studies in healthy subjects [Crenna and Frigo, 1991; Jian et al., 1993; McFadyen and Winter, 1991] and in patients with SMA lesions [Massion et al., 1989; Massion, 1992; Viallet et al., 1992] suggest that the SMA cortex is involved in motor preparation and programming of tasks such as initiating or terminating gait. Despite these findings, however, little is known with respect to the neural networks that mediate the different types of locomotor tasks such as gait initiation, walking, and walking over or around obstacles in humans.
Brain imaging studies using Positron Emission Tomography (PET) and Single‐Photon Emission Computerized Tomography (SPECT) have recently been used to explore the neuroanatomical system involved in walking [Fukuyama et al., 1997; Greenstein et al., 1995; Honda, et al., 1995; Ishii et al., 1995], but the results have been inconsistent. For instance, studies investigating the patterns of changes in regional cerebral blood flow (rCBF) during walking on a treadmill [Greenstein et al., 1995], overground walking [Fukuyama et al., 1997], or standing [Greenstein et al., 1995] have reported activations in several cortical and subcortical regions known to be related to motor activity, like the primary sensorimotor, SMA, cingulate, prefrontal, and the inferior parietal cortices, as well as the caudate and anterior cerebellar cortex. Using the FDG‐PET activation technique, Ishii et al. [1995] have also reported activations in the cerebellum after subjects walked on a treadmill. These studies, however, were limited by the low resolution available using SPECT [Greenstein et al., 1995; Fukuyama et al., 1997], and the fact that only one locomotor function (i.e., walking) could be investigated at a time [Fukuyama et al., 1997; Greenstein et al., 1995; Ishii et al., 1995].
The aim of this exploratory study was thus to use PET to assess the cerebral structures selectively involved in locomotor‐related tasks such as standing (S), gait initiation (IG), walking (W) with and without obstacles (WO). To study the neural network mediating these different locomotor conditions in the same subject with a better resolution than SPECT, we used the H2 15O methodology with PET in conjunction with a form of motor imagery involving visuo‐spatial components. This idea was based on the premise that motor imagery activates cortical and subcortical motor related structures similar (albeit not identical) to those observed when subjects execute physically the movements [Colebatch et al., 1991; Deiber et al., 1998; Lang et al., 1994; Porro et al., 1996; Roth et al., 1996; Sanes, 1994; Stephan et al., 1995]. Given that during motor imagery complex motor action can be simulated without any overt motor output, it was possible to study multiple locomotor‐related tasks in the same subjects in a single session.
It was predicted that imagination of these locomotor conditions would produce changes of rCBF in motor‐related areas believed to play a role, not only in the imagination of those tasks and the visuo‐spatial components associated with these locomotor conditions, but in the actual execution of those movements [Colebatch et al., 1991; Decety et al., 1994; Lafleur et al., 2002; Stephan et al., 1995]. More specifically, we expected activations in motor‐related cortical and subcortical regions, such as the primary sensorimotor, SMA, cingulate, prefrontal, and the inferior parietal cortices, as well as the striatum and cerebellum.
SUBJECTS AND METHODS
Subjects
Six healthy right‐handed adults (five women, one man) aged between 41–70 years (mean: 55.9 years) participated in the study. This age range was chosen to provide controls for a future study involving subjects with hemiparesis due to a stroke. All subjects gave informed, written consent for their participation in the study. The protocol was approved by the Ethics Committee of the Montreal Neurological Institute, McGill University.
Assessment of motor imagery ability
Prior to PET scanning, the subjects' ability to generate mental images was evaluated using a questionnaire and a chronometric test. First, a modified version of the Vividness of Movement Imagery Questionnaire (VMIQ) developed by Isaac et al. [1986] was used to evaluate the vividness with which subjects were able to imagine oneself or someone else when performing body movements. Test–retest reliability (Pearson r = 0.76) assessed over a 3‐week interval, stability over 6 months and concurrent validity (Pearson r = 0.81) of the VMIQ have been previously reported [Isaac, 1985; Isaac et al., 1986]. In the present study, only 10 lower limb movements from the original VMIQ (such as running, jumping, kicking a stone, running upstairs, etc) were selected. The subjects were instructed to rate the degree of clearness and vividness of the motor image on a five‐point scale (1 = image as vivid as normal vision, and 5 = no image at all). The chronometric test consists of a new custom‐made imagery task [Malouin et al., 1997], during which the subjects were required to estimate the distance covered when imagining walking at a “slow” or “fast” pace during varying time periods. They were instructed to walk “mentally” until the experimenter told them to stop. Unknown to the subject, however, each trial was terminated after varying time periods (15, 30, 60 sec), and the order of their presentation was counterbalanced within each condition, such that the subjects were unable to predict when they should stop walking. We expected that if subjects followed the instructions and were successful in visualizing themselves walking, a correlation should be observed between the time periods and the subject's estimations of the distance traveled. Furthermore, the linear function observed in both “slow” and “fast” conditions should be different, the latter revealing a steeper slope than in the “slow” walking condition.
Scanning conditions
Each subject underwent eight PET scans within a single session that lasted approximately 2 hours (see Fig. 1). Each scan lasted 60 sec and was separated by an inter‐scan period of approximately 10 min. Subjects were required to begin each condition 10 sec prior to the isotope injection. In the Rest baseline control condition (scan 1 or 8), subjects were simply instructed to relax and to think of nothing with their eyes closed. By contrast, in the imagery conditions they were asked to imagine in the first‐person perspective the motor tasks illustrated in the video prior to scanning. In the Imagining standing condition (scan 8 or 1), subjects were required to imagine themselves standing upright in a corridor of the research center. These two non‐locomotor conditions were administered only once, and the order in which they were presented was counterbalanced within the group. In addition, three imagined locomotor conditions were repeated twice: initiating gait (IG), walking (W), and walking with obstacles (WO). In the Initiating gait (IG) condition, the subjects were asked to imagine that they were repeatedly taking a step forward with the right leg, stopping and returning to their initial position over and over again during the scan. In the Imagining walking condition , the subjects were instructed to imagine that they were walking in the corridor at a regular pace. In the Imagining walking with obstacles (WO) condition, the instructions and procedure were the same as in the previous condition, except that the subjects were now required to imagine that they had to walk through a series of narrow passages (obstacles). These obstacles were created by positioning pairs of chairs facing each other on both the right and left sides of the corridor. Approximately five steps separated each obstacle, and the subject's task was to imagine that they were zigzagging from one obstacle to the next at a regular pace. As for the control conditions, the order of presentation of these three experimental conditions was counterbalanced within the subject group.
Figure 1.

Experimental design: schematic representation of the behavioral and physiological assessments, as well as the sequence of scanning conditions. Subjects were administered two motor imagery tests before scanning. Then before each scan, the subjects were shown thrice a video illustrating the task they had to imagine as if in the first‐person perspective, and were asked to rate the vividness of the mental images after each viewing, and again after each scan. EMG and ECG were recorded for 1 min just before and during each scan. The subjects were scanned during two non‐locomotor conditions (rest and imagining standing, which were presented in a counterbalanced order) as well as during three experimental imagery conditions: initiating gait, walking, and walking with obstacles; the latter conditions were presented in a pseudorandom order. The experimental conditions were repeated twice (2 sets), for a total of eight scans.
Physiological and behavioral measures
One of the major problems in studying covert motor behavior, such as motor imagery, is that there is no external control to check that the subjects did carry out the task, and that they were successful in doing so. Consequently, the following control measures were used to increase the probability that the subjects were engaged in motor imagery during the appropriate scans (Fig. 1). Based on previous work showing the relationship between heart rate and the level of effort during motor imagery tasks such as walking [Decety and Lingren, 1991; Decety et al., 1993; Wuyam et al., 1995], electrocardiographic recordings (ECGs) were made before and during each scan using a telemetric system. To control for lower‐limb movements and muscle contractions during the imagery tasks, surface electrodes were placed bilaterally over the plantarflexor muscles as these muscles were consistently activated during lower limb movements in supine. Electromyographic recordings (EMGs) were made before and during each scan, using a portable EMG system (Pathway‐MR 20). In order to control the setting and visuo‐spatial environment in which the subjects were asked to imagine themselves standing or walking during scanning sessions, motor imagery was standardized as follows. The subjects were shown, on three occasions before each scan, a 60‐sec video that was created to illustrate each imagery condition in the first person perspective (the camera was placed so as to show what the subject's eyes would see). The environment was the same in each condition and consisted of a long and wide illuminated corridor. The only difference between conditions consisted of the locomotor activity that subjects had to imagine and the visuo‐spatial components associated with each condition. The pace at which the person was walking in the videos and the distance traveled was also controlled and kept constant in each condition. After viewing each video, subjects were requested to imagine that they were performing the same task, and then to rate the vividness of their mental images using the five‐point scale. During scanning, the subjects were required to keep their eyes closed, to avoid lower‐limb movements and leg muscle contractions and to simulate the task observed in the video. Similarly, after each 60‐sec scanning period, subjects were also asked to rate the vividness of the mental images that they were able to maintain during the entire scanning period.
PET and magnetic resonance imaging (MRI)
PET scans were obtained with a CTI/Siemens HR+ system, which produces 63 image slices at an intrinsic resolution of 4.2 × 4.2 × 4.0 mm. The relative distribution of the cerebral blood flow (CBF) was measured in both baseline and the activated conditions with the bolus H2 15O methodology [Raichle et al., 1983] without arterial sampling [Fox and Raichle, 1984]. Subjects received approximately 10 mCi of 15O‐labeled H2O per scan. For each subject, a high‐resolution MRI study was also acquired using a Philips Gyroscan 1.5T with a T1‐weighted fast field echo sequence giving 160 sagittal images with a 1 mm3 voxels and a TR of 19 msec, a TE of 10 msec, and a flip angle of 30 degrees.
Data reduction and statistical analysis
Behavioral data
Imagery ability.
The percent frequency distribution of the scores obtained on the two motor imagery questionnaires (imagining one's self or someone else) was calculated for each condition. The scores obtained for imagining the experimental conditions before and during the scans were also transformed in percent frequency distribution. The perceived distance walked (in feet) during the three durations (15, 30, and 60 sec) at fast and slow pace was averaged for each subject. An ANOVA with repeated measures was used to determine the effect of time and pace on the imagined distance the subjects walked and their interaction.
Physiological variables.
The bilateral muscle activity of the plantarflexors was monitored on‐line before and during each imagined scanning condition to detect the occurrence of muscle contractions and leg movements during motor imagery. The effect of the motor imagery on heart rate (beat/min) was studied by comparing the change (beats/min during scanning − beats/min before scanning) in heart rate recorded during each imagined condition to the change observed in the rest condition (ANOVA with repeated measures). The probability level was set at 0.05.
PET and MRI data
The MRI images were re‐sliced so as to be co‐registered with the PET data [Evans et al., 1991]. An orthogonal coordinate frame was then established, based on the antero‐posterior commissure line as defined in the MRI volume [Evans et al., 1992]. These coordinates were used to apply a trilinear re‐sampling of each pair of MRI and PET data sets into a standardized coordinate system [Talairach and Tournoux, 1988]. To overcome residual anatomical variability persisting after stereotaxic standardization, the PET images were reconstructed with a 14‐mm Hanning filter, and then normalized for global CBF and averaged across subjects within each scanning condition. The mean state‐dependent change (CBF) image volume was obtained [Fox et al., 1985] and converted to a t‐statistic volume by dividing each voxel by the mean standard deviation in normalized CBF for all intra‐cerebral voxels [Worsley et al., 1992].
Individual MRI images were subjected to the same averaging procedure, such that composite stereotaxic image volumes, sampled at 1.5 mm in each dimension, were obtained for both t‐statistic and MRI volumes. Anatomical and functional images were merged to allow direct localization on the MRI images of t‐statistic peaks identified by an automatic peak‐detection algorithm. The significance of a given CBF activation was assessed by application of an intensity threshold to the t‐statistic images [Worsley et al., 1992]. This threshold, based on 3‐D Gaussian random field theory, predicts the likelihood of obtaining a false positive in an extended 3‐D field. For an exploratory search involving all peaks within the gray matter volume of 600 cm3, the threshold for reporting a peak as significant was set at t ≥ 4.2 according to the method described previously by Worsley and colleagues [1996]. Correcting for multiple comparisons, a t‐value of 4.2 corresponds to an uncorrected probability of P < 0.0004 (two‐tailed) and yields a false positive rate of only 0.07 in 218 resolution elements (each of which has dimensions 14 × 14 × 14 mm), which approximates the volume of the gray matter scanned. The threshold for peaks located in cerebral structures for which a priori hypotheses had been formulated was determined using a region‐base method to measure significance levels [Worsley et a.l, 1996]. For example, the cut‐off values were: 3.2 for the primary motor cortex, 3.6 for the premotor, inferior parietal and SMA areas, 3.8 for the prefrontal, 3.5 for the cingulum, 3.2 for the striatum, and 4.0 for the cerebellum.
RESULTS
Behavioral data
Imaging ability
The frequency distribution of the scores from the imagery questionnaire are represented in Figure 2A. The results reveal that for 80% of the motor tasks the subjects had a score of 3 or better indicating that the vividness and clarity of the images most of the time ranged from perfectly clear (score 1) to moderately clear (score 3) when they imagined themselves or someone else performing the motor tasks of the lower limbs.
Figure 2.

A: Percent frequency of the scores from the modified VMIQ corresponding to the vividness of motor images (scale 1 = perfectly clear; 5 = no image) when imagining one's self or someone else performing motor tasks with the lower limbs prior to the scanning session. B: Frequency distribution of scores representing the vividness of motor images (on a 5‐point scale) when subjects imagined the experimental conditions after viewing the video just before the scans (before) and during the scans. C: Mean (SD) perceived distance when imagining walking at “slow” and “fast” paces during the three time periods. Note the steeper slope in the fast pace compared to the slow pace condition.
The ability to represent mentally the imagined conditions before and during the scans is illustrated in Figure 2B. The results indicate that 90% of the time, the subjects had a score of 2 or better before scanning and a score of 3 or better during the scans. This shift of the distribution curve to the left when imagining the experimental conditions demonstrates that the subjects kept a clear mental representation of the simulated tasks during the experimental procedures. The mean (SD) perceived distance walked at slow and fast speeds for three time periods is shown in Figure 2C. The results from the ANOVA showed a main effect for pace (P < 0.003; F = 12.5, [df 17, 2]) but not for time periods and there was no interaction between pace and time periods. These results indicate that the increase in the perceived distance walked at faster pace was the same for the three time periods. The activation level of the plantarflexor muscles during scanning remained similar to that recorded at baseline. Moreover, during online monitoring, no movement artefacts or activation bursts were detected, thus ruling out the effect of muscle activity on brain activation patterns during the imagined conditions. There was a non‐significant increase of heart rate in the three imagined conditions, with the largest increase (mean: 3.8 beats/min) for the WO condition (Fig. 3), whereas, the mean heart rate slightly decreased (1.1 beats/min) during the rest condition.
Figure 3.

Mean (SD) heart rate changes relative to baseline during rest and during each imagined conditions: S: standing; IG: gait initiation; W: walking; WO: walking with obstacles.
Blood flow
Motor imagery of locomotion
Table I and Figure 4 summarize the brain regions that were significantly activated when the imagined conditions (S, IG, W, WO) were compared to the control rest condition. As expected, a basic activation pattern common to all imagined conditions was observed. The neural network emerging when subtracting the rest condition from the S condition (Table IA and Fig. 4A) was characterized by a bilateral activation of the dorsal premotor cortex and precuneus, together with the activation in the left dorsolateral prefrontal cortex (DLPC), the left inferior parietal lobule and the right posterior cingulate cortex. When the rest condition was subtracted from the imagined locomotor tasks (Table IB–D and Fig. 4B–D), additional areas became significantly activated: the pre‐SMA area, either bilaterally (WO) or on the left side only (IG, W), the precentral gyrus (midline with a predominance to the right side) (Fig. 5). Moreover, increased activity of the right posterior cingulate cortex was also found in all imagined conditions, except in the IG condition.
Table I.
Mental Representation of Locomotor Tasks Minus RES
| Brain regions | Coordinates | t‐stat. | Brain regions | Coordinates | t‐stat. | ||||
|---|---|---|---|---|---|---|---|---|---|
| x | y | z | x | y | z | ||||
| A. Standing minus rest | B. Initiating gait minus rest | ||||||||
| Left hemisphere | Left hemisphere | ||||||||
| Dorsal premotor cortex | −21 | 11 | 59 | 5.12 | Dorsal premotor cortex | −24 | 10 | 57 | 6.51 |
| Precuneus | −5 | −61 | 57 | 4.99 | Precuneus | −1 | −73 | 48 | 3.97 |
| Inferior parietal lobule | −47 | −45 | 46 | 4.00 | Inferior parietal lobule | −48 | −47 | 44 | 4.94 |
| Dorsolateral prefrontal cortex | −44 | 20 | 42 | 3.97 | Dorsolateral prefrontal cortex | −34 | 32 | 30 | 3.72 |
| Pre‐supplementary motor area | — | — | — | — | Pre‐supplementary motor area | −4 | 15 | 59 | 3.90 |
| Postcentral gyrus | — | — | — | — | Postcentral gyrus (arm) | −29 | −31 | 59 | 4.12 |
| Right hemisphere | Right hemisphere | ||||||||
| Dorsal premotor cortex | 36 | −7 | 58 | 3.78 | Dorsal premotor cortex | 34 | −9 | 60 | 3.99 |
| Precuneus | 3 | −52 | 34 | 4.31 | Precuneus | 4 | −74 | 50 | 3.50 |
| Posterior cingulate cortex | 3 | −19 | 36 | 3.81 | Posterior cingulate cortex | — | — | — | — |
| Precentral gyrus | — | — | — | — | Precentral gyrus (leg) | 1 | −35 | 66 | 4.31 |
| C. Walking minus rest | D. Walking with obstacles minus rest | ||||||||
| Left hemisphere | Left hemisphere | ||||||||
| Dorsal premotor cortex | −24 | 8 | 60 | 5.72 | Dorsal premotor cortex | −24 | 8 | 58 | 7.51 |
| Precuneus | −4 | −71 | 60 | 4.54 | Precuneus | −8 | −61 | 61 | 4.35 |
| Inferior parietal lobule | −50 | −47 | 42 | 4.30 | Inferior parietal lobule | −40 | −52 | 50 | 4.09 |
| Dorsolateral prefrontal cortex | −47 | 15 | 37 | 4.07 | Dorsolateral prefrontal cortex | −35 | 32 | 33 | 3.50* |
| Pre‐supplementary motor area | −6 | 11 | 59 | 3.70 | Pre‐supplementary motor area | −6 | 6 | 65 | 3.95 |
| Postcentral gyrus(arm) | −32 | −28 | 60 | 4.54 | Postcentral gyrus (arm) | −29 | −31 | 54 | 3.48 |
| Right hemisphere | Right hemisphere | ||||||||
| Dorsal premotor cortex | 39 | −9 | 58 | 3.26* | Dorsal premotor cortex | 35 | −9 | 60 | 4.65 |
| Precuneus | 8 | −74 | 54 | 3.48 | Precuneus | 9 | −71 | 57 | 3.39 |
| Posterior cingulate cortex | 3 | −23 | 33 | 4.03 | Posterior cingulate cortex | 3 | −21 | 32 | 3.60 |
| Precentral gyrus (leg) | 1 | −30 | 68 | 3.38 | Precentral gyrus (leg) | 3 | −30 | 66 | 3.46 |
| Pre‐supplementary motor area | — | — | — | — | Pre‐supplementary motor area | 11 | 10 | 55 | 4.12 |
Did not reach conventional level of significance at P < 0.05.
Figure 4.
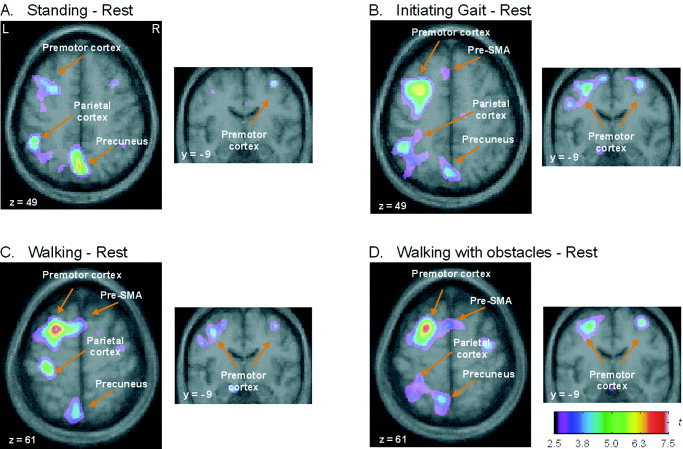
Merged PET‐MRI sections illustrating increases of regional cerebral blood flow associated with the imagining of locomotor‐related tasks. The images were averaged over the 6 subjects and represent: (A) Standing, (B) Initiating gait, (C) Walking, (D) Walking with obstacles minus the control condition Rest. Each subtraction yielded focal changes in blood flow shown as t‐statistic images. The range is coded by the color scale (L = left; R = right).
Figure 5.

Merged PET‐MRI sections illustrating increases of regional cerebral blood flow (rCBF) changes associated with the imagining of locomotor‐related tasks. The images were averaged over the 6 subjects and represent the three imagined locomotor conditions: walking, initiating gait and walking with obstacles) minus the control condition rest. Conventions are as in Figure 4. Areas of activation in (A) the leg area in the precentral gyrus and (B) the arm area in the postcentral gyrus.
Neural correlates of walking conditions
A series of subtractions were carried out between the imagined conditions to determine the neural substrates specific to each locomotor task. Subtracting the imagined IG condition from imagined W revealed significant rCBF changes in the left cuneus and the caudate nucleus, hence suggesting these structures are associated with walking in humans (Table II and Fig. 6). Lastly, neural correlates mediating the WO condition were identified by subtracting the imagined W from WO condition. The latter comparison revealed a novel network (Fig. 7) including the precuneus bilaterally, the left SMA, and the right parietal inferior lobule (Table III). Interestingly, the left parahippocampal gyrus was also active, although not significantly.
Table II.
Walking minus initiating gait
| Brain regions | Stereotaxic coordinates | t‐stat. | ||
|---|---|---|---|---|
| x | y | z | ||
| Left hemisphere | ||||
| Cuneus | −4 | −69 | 14 | 4.29 |
| Caudate nucleus | −16 | 18 | 7 | 3.54 |
Figure 6.

Merged PET‐MRI sections illustrating increases of regional cerebral blood flow (rCBF) changes associated with the imagining of walking. The images were averaged over the 6 subjects and represent walking minus the initiating gait condition. Conventions are as in Figure 4. Areas of activation are the left caudate nucleus and the left cuneus
Figure 7.

Merged PET‐MRI sections illustrating increases of regional cerebral blood flow (rCBF) changes associated with the imagining of walking with obstacles. The images were averaged over the 6 subjects and represent walking with obstacles minus the walking condition. Conventions are as in Figure 4. Areas of activation are the left SMA and the left parahippocampal area.
Table III.
Walking with obstacles minus walking
| Brain regions | Stereotaxic coordinates | t‐stat. | ||
|---|---|---|---|---|
| x | y | z | ||
| Left hemisphere | ||||
| Supplementary motor area | −15 | −18 | 54 | 3.90 |
| Precuneus | −17 | −59 | 54 | 3.71 |
| Parahippocampal gyrus | −23 | −28 | −3 | 3.72* |
| Right hemisphere | ||||
| Inferior parietal lobule | 47 | −50 | 27 | 3.73 |
| Precuneus | 12 | −64 | 65 | 3.51 |
Did not reach conventional level of significance at P < 0.05.
DISCUSSION
The main objective of the present study was to examine the pattern of brain activation when a person imagined oneself standing and performing various locomotor‐related tasks. Based on previous findings that motor imagery and motor performance share similar neural substrates, it was postulated that the activated regions during imagination of locomotor‐related tasks would provide insight into the neural network associated with actual standing and locomotion. More specifically, it was expected that higher brain centers would be progressively engaged with the increasing cognitive and sensory information processing demands of locomotor tasks. As expected, a common set of activated structures including the premotor, prefrontal, and parietal regions was found in all simulated conditions, including the S condition. Additional activations in the pre‐SMA, the leg area of the motor cortex, were observed, however, when rCBF activity in the rest condition was subtracted from those that involved the imagination of locomotor movements per se (IG, W, WO). Subtractions between the different locomotor conditions yielded rCBF increases in the tail (IG‐S) and head (W‐IG) of the caudate nucleus on the left, suggesting that the basal ganglia play a role in locomotor movements that are automatic in nature. Finally, subtraction of the W from WO condition revealed a novel network including the precuneus bilaterally, the left SMA, the right parietal inferior cortex, and the left parahippocampal gyrus to a lesser extent, hence supporting the idea that locomotor adjustments during obstructed gait depend highly upon cortical inputs from various motor and visuo‐spatial sources.
Motor imagery ability
The results from the motor imagery questionnaire and chronometric test, which provide a tool for screening and familiarizing subjects to use motor imagery, indicate that subjects had a clear image of the motor tasks they were required to perform mentally. Interestingly, the motor imagery scores from the questionnaire suggest that the subjects were better in using motor imagery during the scanning session than during the initial evaluation with the VMIQ. Repeated viewing of the video recorded in the first person perspective served to standardize across subjects the motor images that they had to evoke in the different simulated conditions, and likely contributed to the ability of the subjects to imagine themselves performing the locomotor tasks during scanning. Such a methodological approach has been used in previous studies to train subjects in imagining motor actions from different perspectives [Ruby and Decety, 2001] or in mental navigation tasks [Maguire et al., 1998]. Thus, motor imagery training through video viewing appears a necessary step to familiarize the subjects with the task at hand, and guide them in developing a proper mental image of the motor action [Maguire et al., 1998; Ruby and Decety, 2001]. Likewise, the difference in distance perceived while imagining walking at both slow and fast pace in the chronometric test provides additional evidence that subjects were able to produce adequate motor images.
The difference in heart rate between baseline and experimental conditions was small and very variable. Although not statistically significant, these results show a trend towards an increase in heart rate that parallels the increasing physiological demand of the tasks. Indeed, despite the large inter‐subject variability and the small differences in energy demands across the locomotor tasks, the results revealed a trend in heart rate changes that parallels the increase in complexity (see Fig. 3). Moreover, the small changes in heart rate are consistent with the 1.4 beats/min increase per km/h, reported by Decety and colleagues [1991] during imagining walking on a treadmill at increasing speeds (i.e., from 4 km/hr to 12 km/hr). In the latter study, it has been found that the increase in heart rate during simulated walking represented only 18% of heart rate changes measured during actual walking [Decety et al., 1991]. Finally, results from the EMG recordings suggest that the pattern of blood flow changes observed in the experimental conditions cannot be attributed to movements or muscle activation, as no change in muscular activity occurred during scanning.
Motor imagery of locomotion
Subtracting the rest control from the imagined conditions revealed significant activations that were common to all. These included the precuneus and dorsal premotor cortex bilaterally, the left dorsolateral prefrontal cortex and left inferior parietal lobule, as well as in the right posterior cingulate cortex, which are part of a well‐documented neural network associated with the mental representation of motor actions [Decety and Jeannerod, 1995; Jeannerod, 1994; Stephan et al., 1995]. It is important to note that in all conditions, subjects were instructed to imagine themselves performing the action in the first‐person perspective, and were required to replay in their mind the scenes observed in the video prior to scanning. Therefore, it is conceivable that the bilateral activity seen in the precuneus is related to its role in visuo‐spatial processing [Fletcher et al., 1995], and in the imagination of conditions involving motor actions in space [Decety et al., 1997; Ogido et al., 2000; Ruby and Decety, 2001; Stephan et al., 1995; Thobois et al., 2000]. The bilateral increase of activity in the dorsal premotor cortex, also seen in previous motor imagery studies [Leonardo et al., 1995; Seitz et al., 1997; Stephan et al., 1995], may be due to its contribution in the preparation of sequential movements and visuomotor integration [Rizzolatti et al., 1988]. The activation in the left dorsolateral prefrontal cortex (DLPFC) concurs with other investigations, which have demonstrated that this structure is important for selecting and planning voluntary movements [Frith et al., 1991] or simulating motor actions [Decety et al., 1994; Grafton et al., 1995; Stephan et al., 1995]. The increased rCBF activity in the right posterior cingulate cortex is consistent with its role in the coordination of spatial attention and vigilance [Naito et al., 2000; Vogt et al., 1992], mental navigation [Maguire et al., 1997, 1998], and the detection of spatial targets, especially when attentional shifts are influenced by volitional cue‐induced anticipatory biases [Mesulam et al., 2001]. Finally, the increase of activity in the left inferior parietal lobule is also in agreement with previous studies in which motor imagery in the first‐person perspective was used. For example, Ruby and Decety [2001] have reported activation in the left inferior parietal lobule when subjects are imagining a motor task in the first‐person perspective, and activation in the right inferior parietal lobule when they are required to imagine similar tasks in the third‐person perspective.
Subtraction of the rest condition from each of the three imagined locomotor conditions that required simulated movements of only one (IG) or both lower limbs (W, WO), activated additional cortical regions such as the left pre‐SMA, and the precentral gyri (for the leg area). The pre‐SMA activation during simulation of tasks involving limb movements concurs with other imaging studies, which have demonstrated that this area is activated during imagination of sequential movements, while the SMA proper is activated when subjects are asked to execute movements physically [Rao et al., 1993; Roth et al., 1996; Sanes, 1994; Stephan et al., 1995; Tyszka et al., 1994]. Findings from previous studies in humans and animals have shown that pre‐SMA neurons are particularly active in planning spatio‐temporal actions, and in updating motor plans for subsequent temporally ordered movements [Chen et al., 1995; Shima et al., 1996; Tanji and Shima, 1996]. Thus, the present finding supports the role of the pre‐SMA region in providing proper sequencing and timing of limb movements during locomotion.
Activations in the leg area of the primary motor cortex were not expected given the low spatial resolution of PET. To our knowledge, activations in primary motor and somatosensory cortices during motor imagery have been confirmed only when more sensitive imaging techniques like fMRI were used [Leonardo et al., 1995; Lotze et al., 1999; Porro et al., 1996, 2000; Roth et al., 1996; Schnitzler et al., 1997; Tyskza et al., 1994]. A plausible reason why significant activity in primary cortical areas during motor imagery was detected with PET is that walking (i.e., a multi‐joint task) involves movements from the whole body including the trunk and limbs, hence engaging more sensorimotor cortical areas than when single‐joint movements are performed.
One unexpected result of the present study was the absence of significant blood flow activity in the cerebellum during the S condition. The latter finding differs from that of Ouchi and collaborators [1999] who have reported increased activity in the anterior cerebellar lobe during maintenance of different upright postures. Although conjectural, this difference in the pattern of results may be related to the less challenging nature of our standing condition, given that the rCBF activation in the cerebellum has been shown to increase in parallel with the difficulty of the standing task. In the present study, subjects were instructed to imagine that they were standing normally, a task less demanding compared to those used by Ouchi et al. [1999] that required subjects either to stand with the feet together, with the feet in tandem, or on one foot.
Likewise, there was also no activation of the cerebellum during the mental simulation of the different locomotor tasks. Such a finding is in agreement with other motor imagery studies, in which activations have been observed in the anterior cerebellum during physical execution of motor actions, but not during the imagination of both upper‐limb and lower‐limb movements [Christensen et al., 2000; Deiber et al., 1998; Gerardin et al., 2000; Seitz et al., 1997; Stephan et al., 1995]. Again, although conjectural, this lack of activation in the cerebellum may be due to the automatic nature of the rhythmic movements involved in the three locomotor conditions [Doyon and Ungreleider, 2002; Doyon, 1997; Doyon et al., 1997], as increased activity in this structure has previously been observed in novel tasks that require learning of a sequence of either hand [Decety et al., 1988; Jüepner et al., 1997; Lotze et al., 1999; Luft et al., 1998] or foot movements [Lafleur et al., 2002].
Neural correlates of walking
The subtraction of the IG condition from the W condition revealed a specific activation of the left cuneus and left caudate nucleus. Given the role of the cuneus in the processing of spatial attributes [Decety et al., 1997], its activation is likely related to the higher demands generated by the changes in visual scenes during walking, as compared to the more stable visual stimulation produced during IG. Likewise, the activation of the caudate nucleus is believed to reflect the automatic nature of the rhythmic bilateral movements of the lower‐limbs that the subjects have to imagine during this condition [e.g., Doyon et al., 1998].
Neural correlates of walking with obstacles
The subtraction of the W condition from the WO condition revealed the existence of a distinct neural network that involves the precuneus bilaterally, the left SMA, the right inferior parietal cortex, and the left parahippocampal gyrus to a lesser degree. The activation in the parietal regions, and in the precuneus in particular, likely reflects the fact that subjects had to integrate both visual and somatosensory information in order to determine the specific location of the chairs, and their position relative to themselves while imagining walking through the obstacles in the corridor. This interpretation is consistent with the role of this structure in the processing of the spatial properties of visual scenes [Fletcher et al., 1995], the construction of an internal representation on a large environmental scale [Maguire et al., 1998], and the processing of optical flow as reported by de Jong et al. [1994] during viewing of simulated forward motion.
The small activation in the parahippocampal gyrus observed during the WO condition fits well with the known contribution of this structure in topographical memory [Habib and Sirigu, 1987; Maguire et al., 1996, 1998] and mental navigation [Berthoz, 1997; Maguire et al., 1998; Mellet et al., 2000]. For example, using PET, Maguire and colleagues [1996] have demonstrated that the involvement of this structure in mental navigation depends upon the process by which the mental representation of a route is learned. In this study, rCBF activity was measured while subjects tried to memorize the route through an urban area using a film footage depicting either specific landmarks (navigational condition) or not (non‐navigational condition). Interestingly, the left parahippocampal cortex was only activated when subjects had memorized the route that included navigational landmarks. The latter finding is in line with the present results, because subjects learned the route through obstacles by viewing a video recorded in the first person perspective, and thus could identify spatial landmarks. This interpretation is also in agreement with recent findings demonstrating that the parahippocampal gyrus is involved in the encoding of an environment when salient landmarks are present, but not during exploration of an empty environment [Ghaem et al., 1997; Maguire et al., 1998; Mellet et al., 2000].
Lastly, the rCBF changes found in the left SMA concur with recent findings in imagery studies involving complex motor tasks of the upper extremity [Ruby and Decety, 2001; Thobois et al., 2000], or the simulation of bicycling movements [Christensen et al., 2000]. Although it has been shown that the pre‐SMA is often active during imagery conditions [Roth et al., 1996; Sane et al., 1994; Stephan et al., 1995; Tyszka et al., 1994], in more recent studies, activations have either been found in the left SMA or in both cortical regions [Christensen et al., 2000; Ruby and Decety, 2001; Thobois et al., 2000]. The degree of complexity of the task in the WO condition, which required subjects to recall several landmarks along the walking pathway, may explain why the activity in our study was found in the SMA and not in the pre‐SMA. Although conjectural, the latter interpretation is in accord with findings that SMA neurons are particularly active when monkeys are required to execute multiple movement sequences from memory [Tanji and Shima, 1994; Tanji and Mushiake, 1996].
CONCLUSIONS
Our findings demonstrate that specific neural networks can be activated during the imagination of locomotor‐related tasks. The present results underline the involvement of multiple cerebral regions during the simulation of locomotor tasks that require preparation, planning, visuo‐spatial processing, and adaptation to environmental constraints. Given that mental practice through motor imagery can produce representational changes in the brain comparable to those yielded by physical practice, [Jackson et al., 2001a,b; Pascual‐Leone et al., 1995], our findings provide the rationale for investigating further the use of motor imagery as a tool for improving locomotor skills.
Acknowledgements
We thank the subjects who participated in this study. We also extend our gratitude to Daniel Tardif and Kate Hanratty for their assistance in preparing the figures.
REFERENCES
- Armstrong DM (1986): Supraspinal contribution to the initiation and control of locomotion in the cat. Prog Neurobiol 26: 273–361. [DOI] [PubMed] [Google Scholar]
- Armstrong DM, Drew T (1984): Locomotor‐related neuronal discharges in cat motor cortex compared with periopheral receptive fields and evoked movements. J Physiol (Lond) 346: 497–517. [DOI] [PMC free article] [PubMed] [Google Scholar]
- Berthoz A (1997): Parietal and hippocampal contributionto topokinetic and topographic memory. Phil Trans R Soc Lond B 352: 1437–1448. [DOI] [PMC free article] [PubMed] [Google Scholar]
- Bussel B, Roby‐Brami A, Néris O, Yakovleff A (1996): Evidence for a spinal stepping generator in man. Paraplegia 34: 911–92. [DOI] [PubMed] [Google Scholar]
- Calancie B, Needham‐Shropshire B, Jacobs P, Willer P, Zych G, Green BA (1994): Involuntary stepping after chronic spinal cord injury. Brain 117: 1143–1159. [DOI] [PubMed] [Google Scholar]
- Capaday C, Lavoie B, Barbeau H, Schneider C, Bonnard M (1999): Studies on the corticospinal control of human walking. I. Responses to focal transcranial stimulation of the motor cortex. J Neurophysiol 81: 129–139. [DOI] [PubMed] [Google Scholar]
- Chen YC, Thaler D, Nixon PD, Stern C, Passingham RE (1995): The function of the medial premotor cortex (SMA). II. The timing and selection of learned movements. Exp Brain Res 102: 445–460. [DOI] [PubMed] [Google Scholar]
- Christensen LO, Johannsen P, Sinkjaer T, Petersen N, Pyndt HS, Nielsen JB (2000): Cerebral activation during bicycle movements in man. Exp Brain Res 135: 66–72. [DOI] [PubMed] [Google Scholar]
- Colebatch JG, Deiber M‐P, Passingham RE, Friston KJ, Frackowiak RSJ (1991): Regional cerebral blood flw during voluntary arm and hand movements in human subjects. J Neurophysiol 65: 1392–1401. [DOI] [PubMed] [Google Scholar]
- Crenna P, Frigo C (1991): A motor program for the initiation of forward oriented movements in man. J Physiol 437: 635–653. [DOI] [PMC free article] [PubMed] [Google Scholar]
- Decety J, Jeannerod M (1995): Imagery and its neurological substrate. Rev Neurol (Paris) 151: 474–479. [PubMed] [Google Scholar]
- Decety J, Lindgren M (1991): Sensation of effort and duration of mentally executed actions. Scand J Psychol 32: 97–104. [DOI] [PubMed] [Google Scholar]
- Decety J, Philippon B, Ingvar DH (1988): rCBF landscapes during motor performance and motor ideation of a graphic gesture. Eur Arch Psychiatry Neurol Sci 238: 33–38. [DOI] [PubMed] [Google Scholar]
- Decety J, Jeannerod M, Germain M, Pastene J (1991): Vegetative response during imagined movement is proportional to mental effort. Behavior Brain Res 42: 1–5. [DOI] [PubMed] [Google Scholar]
- Decety J, Jeannerod M, Durozard D, Baverel G (1993): Central activation of autonomic effectors during mental simulation of motor actions in man. J Physiol 461: 549–563. [DOI] [PMC free article] [PubMed] [Google Scholar]
- Decety J, Perani D, Jeannerod M, Bettinardi V, Tadary B, Woods R, Mazziota JC, Fazio F (1994): Mapping motor representations with positron emission tomography. Nature 371: 600–602. [DOI] [PubMed] [Google Scholar]
- Decety J, Grezes J, Costes N, Perani D, Jeannerod M, Procyk E, Grassi F, Fazio F (1997): Brain activity during observation of actions. Influence of action content and subject's strategy. Brain 120: 1763–1777. [DOI] [PubMed] [Google Scholar]
- Deiber MP, Ibanez V, Honda M, Sadato N, Raman R, Hallett M (1998): Cerebral processes related to visuomotor imagery and generation of simple finger movements studied with positron emission tomography. NeuroImage 7: 73–85. [DOI] [PubMed] [Google Scholar]
- De Jong BM, Shipp S, Skidmore B, Frackowiak RSJ, Zeki S (1994): The cerebral activity related to the visual perception of forward motion in depth. Brain 117: 1039–1054. [DOI] [PubMed] [Google Scholar]
- Doyon J (1997): Skill learning In: Schmahmann JD, editor. The cerebellum and cognition. San Diego: Academic Press; p 273–294. [Google Scholar]
- Doyon J, Ungerleider LG (2002): Functional anatomy of motor skill learning In: Squire LR, Schacter DL, editors. Neuropsychology of memory, 3rd ed. New York: The Guilford Publication Inc. p 225–238. [Google Scholar]
- Doyon J, Gaudreau D, Laforce RJ, Castonguay M, Bédard PJ, Bédard F, Bouchard JP (1997): Role of the striatum, cerebellum, and frontal lobes in the learning of a visuomotor sequence. Brain Cogn 34: 218–245. [DOI] [PubMed] [Google Scholar]
- Doyon J, Laforce RJ, Bouchard JP, Gaudreau D, Roy J, Poirier M, Bédard PJ, Bédard F, Bouchard JP (1998): Role of the striatum, cerebellum and frontal lobes in the automatization of a repeated visuomotor sequence of movements. Neuropsychologia 36: 625–641. [DOI] [PubMed] [Google Scholar]
- Drew T (1988): Motor cortical cell discharge during voluntary gait modification. Brain Res 457: 181–187. [DOI] [PubMed] [Google Scholar]
- Drew T (1991): The role of the motor cortex in the control of gait modification in the cat In: Shimamura S, Grillner S, Edgerton VR, editors. Neurobiological basis of human locomotion. Tokyo: Japan Scientific Societies Press; p 201–211. [Google Scholar]
- Drew T (1993): Motor cortical activity during voluntary gait modifications in the cat. I. Cells related to the forelimbs. J Neurophysiol 70: 179–199. [DOI] [PubMed] [Google Scholar]
- Drew T, Jiang W, Kably B, Lavoie S (1996): Role of the motor cortex in the control of visually triggered gait modifications. Can JPhysiol Pharmacol 74: 426–442. [PubMed] [Google Scholar]
- Evans AC, Marrett S, Torrescorzo J, Ku S, Collins L (1991): MRI‐PET correlation in three dimensions using a volume‐of‐interest (VOI) atlas. J Cereb Blood Flow Metab 11: A69–A78. [DOI] [PubMed] [Google Scholar]
- Evans AC, Marrett S, Neelin P, Collins L, Worsley K, Dai W, Milot S, Meyer E, Bub D (1992): Anatomical mapping of functional activation in stereotactic coordinate space. NeuroImage 1: 43–63. [DOI] [PubMed] [Google Scholar]
- Fletcher PC, Frith CD, Grasby PM, Shallice T, Frackowiak RSJ, Dolan RJ (1995): The mind's eye precuneus activation in memory related imagery. NeuroImage 2: 195–200. [DOI] [PubMed] [Google Scholar]
- Forssberg H (1985): Ontogeny of human locomotor control. I. Infant stepping, supported locomotion and transition to independent locomotion. Exp Brain Res 57: 480–493. [DOI] [PubMed] [Google Scholar]
- Fox PT, Raichle ME (1984): Stimulus rate dependence of regional cerebral blood flow in human striate cortex, demonstrated by positron emission tomography. J Neurophysiol 51: 1109–1120. [DOI] [PubMed] [Google Scholar]
- Fox PT, Perlmutter JS, Raichle ME (1985): A stereotactic method of anatomical localization for positron emission tomography. J Comput Assist Tomogr 9: 141–153. [DOI] [PubMed] [Google Scholar]
- Fukuyama H, Ouchi Y, Matsuzaki S, Nagahama Y, Yamauchi H, Ogawa M, Kimura J, Shibasaki H (1997): Brain functional activity during gait in normal subjects. Neurosci Lett 228: 183–186. [DOI] [PubMed] [Google Scholar]
- Frith CD, Friston KJ, Liddle PF, Frackowiak RSJ (1991): Willed actions and the prefrontal cortex in man. Proc R Soc Lond B 244 241–246. [DOI] [PubMed] [Google Scholar]
- Gerardin E, Sirigu A, Lehericy S, Poline JB, Gaymard B, Marsault C, Agid Y, Le Bihan D (2000): Partially overlapping neural networks for real and imagined hand movements. Cereb Cortex 10: 1093–1104. [DOI] [PubMed] [Google Scholar]
- Ghaem O, Mellet E, Crivello F, Tzourio N, Mazoyer B, Berthoz A, Denis M (1997): Mental navigation along memorized routes activates the hippocampus, precuneus and insula. Neuroreport 8: 739–744. [DOI] [PubMed] [Google Scholar]
- Grafton ST, Hazeltine E, Ivry R (1995): Functional mapping of sequence learning in normal humans. J Cogn Neurosci 7: 497–510. [DOI] [PubMed] [Google Scholar]
- Greenstein JI, Gastineau EA, Siegel BH, Macsata R, Conklin JJ, Maurer AH (1995): Cerebral hemisphere activation during human bipedal locomotion. Hum Brain Mapp 1: 320. [Google Scholar]
- Habib M, Sirigu A (1987): Pure topographical disorientation: a definition and anatomical basis. Cortex 23: 73–85. [DOI] [PubMed] [Google Scholar]
- Honda M, Freund HJ, Shibasaki H, Seitz RJ, Knorr U, Sadato N, Yonekura Y, Hallet M (1995): Cerebral activation by locomotive movements with the imagination of natural walking. Hum Brain Mapp 1: 318. [Google Scholar]
- Isaac A (1985): A shortened version of Betts's questionnaire upon mental imagery. J Clin Psychol 23: 386–389. [DOI] [PubMed] [Google Scholar]
- Isaac A, Marks DF, Russell DG (1986): An instrument for assessing imagery of movement: the vividness of movement imagery questionnaire (VMIQ). J Ment Image 10: 23–30. [Google Scholar]
- Ishii K, Senda M, Toyoma H, Oda D, Ishii K, Ishiwata K, Sasaki T (1995): Brain function in bipedal gait: a PET study. Hum Brain Mapp 1: 321. [Google Scholar]
- Jackson PL, Lafleur MF, Malouin F, Richards CL, Doyon J (2001a): Potential role of mental practice using motor imagery in neurological rehabilitation. Arch Phys Med Rehabil 82: 1133–1141. [DOI] [PubMed] [Google Scholar]
- Jackson PL, Lafleur M, Malouin F, Richards CL, Doyon J (2001b): Mental practice of a sequential task modulates orbitofrontal organization. NeuroImage 13: 1197. [Google Scholar]
- Jeannerod M (1994): The representing brain: Neural correlates of motor intention and imagery. Behav Brain Sci 17: 187–245 [Google Scholar]
- Jian Y, Winter DA, Ishac MG, Gilchrist L (1993): Trajectory of the body COG and COP during initiation and termination of gait. Gait Posture 1: 9–22. [Google Scholar]
- Jueptner M, Ottinger S, Fellows SJ, Adamschewski J, Flerich L, Muller SP, Diener HC, Thilmann AF, Weiller C (1997): The relevance of sensory input for the cerebellar control of movements. NeuroImage 5: 41–48. [DOI] [PubMed] [Google Scholar]
- Lafleur M, Jackson P, Malouin F, Richards CL, Evans AC, Doyon J (2002): Motor learning produces parallel dynamic functional changes during the execution and imagination of sequential foot movements. NeuroImage 16: 142–157. [DOI] [PubMed] [Google Scholar]
- Lamb T, Yang JF (2000): Could different directions of infant stepping be controlled by the same locomotor central pattern generator? J Neurophysiol 83: 2814–2824. [DOI] [PubMed] [Google Scholar]
- Lang W, Petit L, Hollinger P, Pietrzyk U, Tzourio N, Mazoyer B, Berthoz A (1994): A positron emission tomography study of oculomotor imagery. NeuroReport 5: 921–924. [DOI] [PubMed] [Google Scholar]
- Lavoie BA, DeVanne H, Capaday C (1997): Differential control of reciprocal inhibition during walking versus postural and voluntary motor tasks in humans. J Neurophysiol 78: 429–438. [DOI] [PubMed] [Google Scholar]
- Leonardo M, Fieldman J, Sadato N, Campbell G, Ibanez V, Cohen L, Deiber M‐P, Jezzard P, Pons T, Turner R, Le Bihan D, Hallett M (1995): A functional magnetic resonance imaging study of cortical regions associated with motor task execution and motor ideation in humans. Hum Brain Mapp 3: 83–92. [Google Scholar]
- Lotze M, Montoya P, Erb M, Hulsmann E, Flor H, Klose U, Birbaumer N, Grodd W (1999): Activation of cortical and cerebellar motor areas during executed and imagined hand movements: a fMRI study. J Cogn Neurosci 11: 491–501. [DOI] [PubMed] [Google Scholar]
- Luft AR, Skalej M, Stefanou A, Klose U, Voigt K (1998): Comparing motion‐ and imagery‐related activation in the human cerebellum: a functional MRI study. Hum Brain Mapp 6: 105–113. [DOI] [PMC free article] [PubMed] [Google Scholar]
- Maguire EA, Burke T, Philips J, Staunton H (1996): Topographical disorientation following unilateral temporal lobe lesions in humans. Neuropsychologia 34: 993–1001. [DOI] [PubMed] [Google Scholar]
- Maguire EA, Frackowiak RSJ, Frith CD (1997): Recalling route around London: activation of the right hippocampus in taxi driver. J Neurosci 17: 7103–7110. [DOI] [PMC free article] [PubMed] [Google Scholar]
- Maguire EA, Frith CD, Burgess N, Donnet JG, O'Keefe J (1998): Knowing where things are : parahippocampal involvesmnet in encoding object locations in virtual large scale space. J Cogn Neurosci 10: 61–76. [DOI] [PubMed] [Google Scholar]
- Malouin F, Doyon J, Dumas F, Jackson PL, Evans AC, Richards CL (1997): Mental representation of locomotion: a PET study. NeuroImage 5: S132. [Google Scholar]
- Massion J. (1992): Movement, posture and equilibrium: interaction and coordination. Progress in Neurobiol 38: 35–56. [DOI] [PubMed] [Google Scholar]
- Massion J, Viallet F, Massarino R, Khalil R (1989): The supplementary motor area is implicated in the coordination between posture and movement in man. CR Acad Sci III 308: 417–428. [PubMed] [Google Scholar]
- McFadyen BJ, Winter DA (1991): Anticipatory locomotor adjustments during obstructed human walking. Neurosci Res Commun 9: 37–44. [Google Scholar]
- Mellet E, Bricogne S, Tzourio‐Mazoyer N, Ghaëm O, Petit L, Zago L, Etard O, Berthoz A, Mazoyer B, Denis M (2000): Neural correlates of topographic mental exploration: the impact of route versus survey perspective learning. NeuroImage 12: 588–600. [DOI] [PubMed] [Google Scholar]
- Mesulam MM, Nobre AC, Kim YH, Parrish TB, Gitelman DR (2001): Heterogeneity of cingulate contributions to spatial attention. NeuroImage 13: 1065–1072. [DOI] [PubMed] [Google Scholar]
- Naito E, Kinomura S, Geyer S, Kawashima R, Roland PE, Zilles K (2000): Fast reaction to different sensory modalities activates common fields in the motor areas, but the anterior cingulated cortex is involved in the speed of reaction. J Neurophysiol 83: 1701–1709. [DOI] [PubMed] [Google Scholar]
- Nutt JG, Marsden CD, Thompson PD (1993): Human walking and higher‐level gait disorders, particularly in the elderly. Neurology 3: 268–279. [DOI] [PubMed] [Google Scholar]
- Ogido T, Kobayashi K, Sugishita M (2000): The precuneus in motor imagery: a magnetoencephalographic study. NeuroReport 11: 1345–1349. [DOI] [PubMed] [Google Scholar]
- Ouchi Y, Okada H, Yoshikawa E, Nobezawa S, Fatatsubashi M (1999): Brain activation during maintenance of standing postures in humans. Brain 122: 329–338. [DOI] [PubMed] [Google Scholar]
- Pascual‐Leone A, Nguyet D, Cohen LG, Brasil‐Neto JP, Cammarota A, Hallett M (1995): Modulation of muscle responses evoked by transcranial magnetic stimulation during the acquisition of new fine motor skills. J Neurophysiol 74: 1037–45. [DOI] [PubMed] [Google Scholar]
- Patla AE (1991): Visual control of human locomotion In: Patla AE, editor. Adaptability of human gait. North‐Holland: Elsevier Science Publishers B.V. p 55–97. [Google Scholar]
- Porro CA, Francescato MP, Cettolo V, Diamond ME, Baraldi P, Zuiani C, Bazzocchi M, Di Prampero PE (1996): Primary motor and sensory cortex activation during motor performance and motor imagery: a functional magnetic resonance imaging study. J Neurosci 16: 7688–7698. [DOI] [PMC free article] [PubMed] [Google Scholar]
- Porro CA, Cettolo V, Francescato MP, Baraldi P (2000): Ipsilateral involvement of primary motor cortex during motor imagery. Eur J Neurosci 12: 3059–3063. [DOI] [PubMed] [Google Scholar]
- Raichle ME, Martin WRW, Herscovitch P, Mintun MA, Markham J (1983): Brain blood flow measured with intravenous H2O15. II. Implementation and validation. J Nucl Med 24: 790–798. [PubMed] [Google Scholar]
- Rao SM, Binder JR, Bandettini PA, Hammeke TA, Yetkin FZ, Jesmanowicz A, Lisk LM, Morris GL, Mueller WM, Estkowski LD (1993): Functional magnetic resonance imaging of complex human movements. Neurology 43: 2311–2318. [DOI] [PubMed] [Google Scholar]
- Rizzolatti G, Camarda R, Fogassi L, Gentulicci M, Luppino G, Matelli M (1988): Functional organization of inferior area 6 in the macaque monkey. II. Area F5 and the control of distal movements. Exp Brain Res 7: 491–507. [DOI] [PubMed] [Google Scholar]
- Roth M, Decety J, Raybaudi M, Massarelli R, Delon‐Martin C, Segebarth C, Morand S, Gemignani A, Decorps M, Jeannerod M (1996): Possible involvement of primary motor cortex in mentally simulated movement: a functional magnetic resonance imaging study. NeuroReport 7: 1280–1284. [DOI] [PubMed] [Google Scholar]
- Ruby P, Decety P (2001): Effect of subjective perspective taking during simulation of action: a PET investigation of agency. Nature Neurosci 4: 546–550. [DOI] [PubMed] [Google Scholar]
- Rossignol S (1996): Visuomotor regulation of locomotion. J Can Physiol Pharmacol 74: 418–425. [PubMed] [Google Scholar]
- Sanes JN (1994): Neurophysiology of preparation, movement and imagery. Behav Brain Sci 17: 221–223. [Google Scholar]
- Schnitzler A, Salenius S, Salmelin R, Jousmaki V, Hari R (1997): Involvement of primary motor cortex in otor imagery: a neuromagnetic study. NeuroImage 6: 2101–208. [DOI] [PubMed] [Google Scholar]
- Seitz RJ, Canavan AG, Yaguez L, Herzog H, Tellmann L, Knorr U, Huang Y, Homberg V (1997): Representations of graphomotor trajectories in the human parietal cortex: evidence for controlled processing and automatic performance. Eur J Neurosci 9: 378–389. [DOI] [PubMed] [Google Scholar]
- Shima K, Mushiake H, Saito N, Tanji J (1996): Role of cells in the presupplementary motor area in updating motor plans. Proc Natl Acad Sci 93: 8694–8698. [DOI] [PMC free article] [PubMed] [Google Scholar]
- Stephan KM, Fink GR, Passingham RE, Silbersweig D, Ceballos‐Baumann AO, Frith CD, Frackowiak RS (1995): Functional anatomy of the mental representation of upper extremity movements in healthy subjects. J Neurophysiol 73: 373–386. [DOI] [PubMed] [Google Scholar]
- Talairach J, Tournoux P (1988): Co‐planar stereotaxic atlas of the human brain : an approach to cerebral imaging. New York: Georg Thieme Verlag. [Google Scholar]
- Tanji J, Mushiake H (1996): Comparison of neuronal activity in the supplementary motor area and primary motor cortex. Cogn Brain Res 3: 143–150. [DOI] [PubMed] [Google Scholar]
- Tanji J, Shima K (1994): Role for supplementary motor area cells in planning several movements ahead. Nature: 371: 413–416. [DOI] [PubMed] [Google Scholar]
- Tanji J, Shima K (1996): Supplementary motor cortex in organisation of movement. Eur Neurol 36 (Suppl 1): 13–19. [DOI] [PubMed] [Google Scholar]
- Thobois S, Dominey PF, Decety J, Pollak P, Grégoie MC, Le Bars D, Broussole E (2000): Motor imagery in normal subjects and in asymmetrical Parkinson's disease: A PET study. Neurology 55: 996–1002. [DOI] [PubMed] [Google Scholar]
- Tyszka JM, Grafton ST, Chew W, Woods RP, Colletti PM (1994): Parceling of mesial frontal motor areas during ideation and movement using functional magnetic resonance imaging at 1.5 tesla. Ann Neurol 35: 746–749. [DOI] [PubMed] [Google Scholar]
- Viallet F, Massion J, Massarino R, Khalil R (1992): Coordination between posture and movement in a bimanual load lifting task: putative role of a medial frontal region including the supplementary motor area. Exp Brain Res 88: 674–684. [DOI] [PubMed] [Google Scholar]
- Vogt BA, Finch DM, Olson CR (1992): Functional heterogeneity in cingulated cortex: the anterior executive and posterior evaluative regions. Cereb Cortex 2: 435–443. [DOI] [PubMed] [Google Scholar]
- Worsley KJ, Evans AC, Marrett S, Neelin P (1992): A three‐dimensional statistical analysis for CBF activation studies in human brain. J Cereb Blood Flow Metab 12: 900–918. [DOI] [PubMed] [Google Scholar]
- Worsley KJ, Marrett S, Neelin P, Vandal AC, Friston KJ, Evans AC (1996): A unified statistical approach for determining significant signals in images of cerebral activation. Hum Brain Mapp 4: 58–73. [DOI] [PubMed] [Google Scholar]
- Wuyam B, Moosavi SH, Decety J, Adams L, Lansing RW, Guz A (1995): Imagination of dynamic exercise produced ventilatory responses that were more apparent in competitive sportsmen. J Physiol 482 713–724. [DOI] [PMC free article] [PubMed] [Google Scholar]