

Abstract
A functional MRI study compared activation in the red nucleus to that in the lateral cerebellar dentate nucleus during passive and active tactile discrimination tasks. The study pursued recent neuroimaging results suggesting that the cerebellum may be more associated with sensory processing than with the control of movement for its own sake. Because the red nucleus interacts closely with the cerebellum, the possibility was examined that activity in red nucleus might also be driven by the requirement for tactile sensory processing with the fingers rather than by finger movement alone. The red and dentate nuclei were about 300% more active (a combination of activation areas and intensities) during passive (non‐motor) tactile stimulation when discrimination was required than when it was not. Thus, the red nucleus was activated by purely sensory stimuli even in the absence of the opportunity to coordinate finger movements or to use the sensory cues to guide movement. The red and dentate nuclei were about 70% more active during active tactile tasks when discrimination was required than when it was not (i.e., for simple finger movements alone). Thus, the red nucleus was most active when the fingers were being used for tactile sensory discrimination. In both the passive and active tactile tasks, the observed activation had a contralateralized pattern, with stronger activation in the left red nucleus and right dentate nucleus. Significant covariation was observed between activity in the red nucleus and the contralateral dentate during the discrimination tasks and no significant correlation between the red nucleus and the contralateral dentate activity was detected during the two non‐discrimination tasks. The observed interregional covariance and contralateralized activation patterns suggest strong functional connectivity during tactile discrimination tasks. Overall, the pattern of findings suggests that the activity in the red nucleus, as in the lateral cerebellum, is more driven by the requirements for sensory processing than by motor coordination per se. Hum. Brain Mapping 10:147–159, 2000. © 2000 Wiley‐Liss, Inc.
INTRODUCTION
Our knowledge of the red nucleus (RN) is largely derived from animal studies where it has been regarded almost exclusively as a neural structure dedicated to movement execution [for review, Keifer and Houk 1994]. It is known that the RN receives substantial projections from the motor and premotor regions of cerebral cortex [Humphrey et al., 1984; Tokuno, 1995] and is intimately associated with the cerebellum [Flumerfelt et al., 1973; Stanton, 1980] itself historically considered primarily a motor structure [Holmes, 1939; Houk and Wise, 1995; Ito, 1984; Thach et al., 1992; Welsh et al., 1995]. The magnocellular region of the RN projects to structures in the medulla and spinal cord that are considered fundamentally motoric [Kennedy et al., 1986]. The parvocellular region of the RN, especially developed in primates [Flumerfelt et al., 1973; Stanton, 1980], projects to the inferior olive [Courville and Otabe, 1974; Strominger et al., 1979] which, in projecting to the cerebellum, has also traditionally been assumed to be a predominately motor structure [Keifer and Houk, 1994].
Over the last several years, both neuroimaging of healthy subjects and lesion‐deficit correlations in neurological patients have suggested that the lateral cerebellum may be involved in a variety of non‐motor operations, including semantic word generation [Petersen et al., 1989], perception of temporal order [Ivry and Keele, 1989], visual attention [Allen et al., 1997], tactile or proprioceptive information processing [Blakemore et al., 1998; Bucher et al., 1997; Jueptner et al., 1997; Seitz et al., 1991], and executive planning, spatial reasoning, and other cognitive processes [Bracke‐Tolkmitt et al., 1989; Grafman et al., 1992; Kim et al., 1994; Schmahmann, 1997]. Based on anatomical, electrophysiological and behavioral studies of the rat cerebellum [Bower and Kassel, 1990], we have been investigating an hypothesis that the cerebellum may actually be more associated with control of sensory data acquisition for a wide range of sensory systems [Bower 1997a, 1997b]. If correct, such a supporting function may explain the diverse set of behaviors that are now known to evoke activity in the lateral cerebellum. In other words, activation of the cerebellum in temporal order perception [Ivry and Keele, 1989], semantic word generation [Petersen et al., 1989], visual attention [Allen et al., 1997], and even executive planning, spatial reasoning, and other cognitive processes [Bracke‐Tolkmitt et al., 1989; Grafman et al., 1992; Kim et al., 1994; Schmahmann 1997] may be more related to the dependence of these tasks on well controlled sensory data than related to different specific roles for the lateral cerebellum in each of those behaviors. Several recent imaging and neurological studies evaluating tactile, proprioceptive, visual, auditory, and even olfactory information processing would seem to be consistent with this suggestion [Blakemore et al., 1998; Bucher et al., 1997; Jueptner et al., 1997; Parsons et al., 2000; Penhune et al., 1998; Seitz et al., 1991; Sobel et al., 1998; Tesche & Karhu, 2000; Thier et al., 1999]. Recently, we have been using fMRI studies in humans in an attempt to disentangle tactile sensory‐related processing from classical motor‐control in the lateral hemispheres of the cerebellum. We have previously proposed [Bower 1997a, 1997b] that these lateral/posterior cerebellar regions are more concerned with tactile sensory function than motor control per se. Using fMRI we have previously demonstrated that the lateral (dentate) nucleus and cortex of the human cerebellum are strongly activated when fine finger movements were used for tactile sensation and discrimination, but not by simple grasping finger movements alone [Gao et al., 1996; Parsons et al., 1997a, 1997b]. Interpreted in the context of electrophysiological and modeling studies [Bower 1997a, 1997b], these experiments suggest that lateral regions of the cerebellum may be more involved in some process related to tactile sensation and discrimination than in the control of finger movements themselves.
In the present experiments we sought to extend our analysis of the cerebellar system to the human red nucleus which receives substantial projections from the cerebellar dentate nucleus [Flumerfelt et al., 1973; Stanton, 1980]. We used functional magnetic resonance imaging (fMRI) to determine whether the human red nucleus, like the dentate nucleus [Gao et al., 1996] and cerebellar cortex [Parsons et al., 1997a, 1997b], is more strongly activated when the fingers are used for tactile object discrimination as compared to movement alone [Liu et al., 1997a]. To do this we have used two complementary pairs of tasks, i.e., passive (non‐motor) tasks versus active tasks [Gao et al., 1996]. In addition, because the dentate nucleus directly influences the red nucleus, we were interested in determining how the activation levels in these two structures covaried. This was assessed by measuring trial‐by‐trial, interregional covariance [Friston et al., 1993; Liu et al., 1997b]. The results demonstrate strong, contralateralized coactivation of the red and dentate nuclei and indicate that activation in the red nucleus (RN), like the dentate nucleus (DN), is much greater during passive (non‐motor) tactile stimulation when discrimination is required than when it is not and that it is greater during active tactile tasks when discrimination is required than when it is not (i.e., for simple finger movements alone).
MATERIALS AND METHODS
Subjects and activation paradigms
The seven human subjects (2 females and 5 males; 27 to 41 years old) had no known history of neurological or psychiatric illness and volunteered to participate after providing informed consent.
Each subject took part in two fMRI experiments performed on different days. Two complementary activation paradigms, i.e., a passive pair of tactile tasks and an active pair of tactile tasks, were used in two fMRI experiments, respectively. The passive pair consisted of a Cutaneous‐Stimulation (CS) task and a Cutaneous‐Stimulation plus Discrimination (CD) task; the active pair consisted of a Grasping‐Objects (GO) task and a Grasping‐Objects plus Discrimination (GD) task. These tasks were adapted from a previous study [Gao et al., 1996] and modified as described below. The subject was blindfolded and trained for 10 minutes on each pair of the tasks prior to MRI scanning. During the experiments, the subject was positioned supine inside the core of a 1.9 T whole‐body MRI system (Elscint/Prestige; Haifa, Israel). To minimize head‐movement artifacts, the head was restrained in an individually molded plastic face mask.
In Experiment 1, the subject performed the passive tactile tasks with the wrist, hand, and fingers immobilized by taping the hand to a rigid plastic hand‐shaped template. Passive cutaneous stimulation was applied by two experimenters (who did not necessarily know the purpose of this study but applied the stimuli according to the instructions given) with different grades of sandpaper brushing against the finger pads of both hands of the subject. The sandpaper stimulus was one of four grades (U.S.A. Standard Grading system; maximal packing of grain size: 268, 141, 33, and 23.6 μm, respectively) and was applied to the pads of index, middle, and ring fingers by a series of three simultaneous strokes. In the control (CS) task, the subject was given the sole instruction to pay attention to the stimulus. The stimuli were randomly and simultaneously alternated every 3 seconds by each experimenter. In the non‐motor discrimination (CD) task, the same stimuli were applied, but the subject was asked to covertly judge whether or not the roughness or texture of the sandpaper on the two hands matched. During the tasks, the subjects were instructed to not engage in any voluntary movements. The passive task design eliminated possible finger and wrist movements and allowed the subject to discern the similarity (or the difference) in the cutaneous stimuli applied to both hands.
In Experiment 2, the subject performed the active pair of tasks, in which each hand was enclosed in a woven cotton sock but otherwise unrestrained. Each sock contained an identical set of four different stimuli. Each stimulus was a smooth wooden sphere 2.5 cm in diameter. The stimuli were differentiated by zero, one, two, or three additional planar surfaces, and the presence or absence of a small hole. In the control (GO) task, the subject independently and repeatedly grasped a small wooden sphere simultaneously with fingers of each hand, rotated it three times for approximately three seconds and then dropped it. In the sensorimotor discrimination (GD) task, the subject simultaneously grasped two spheres, one in each hand, and started with one hand to rotate the grasped sphere as a reference while using the opposite hand to find the shape among the four test spheres that matched the reference. If the test sphere was judged to be different from the reference, it was dropped and another sphere was picked up and compared with the reference. If two stimuli in each hand were judged to match or there was no match after three trials, both the reference and the test spheres were released and a new cycle began with the opposite hand grasping a reference. Note that this control task (GO) is a modification of the control task in Gao et al. (1996) in which there was no rotation, and the stimulus was picked up simply in a pinch grasp. In the present study we aimed to have the rotating finger movements in the GO task and the GD task as similar as possible (see Discussion). The performance of this task was closely monitored by an experimenter in order to ensure that the finger movement adhered to task instructions. If the subject was not performing as instructed, the experimenter re‐instructed the subject as to the details of the task. In fact, our observations confirmed that the subject closely conformed to the instructions.
Imaging protocols
A polarized circular head coil was used for RF transmission and MRI signal reception. After acquiring routine scout T1‐weighted 3D MRI images, several T2‐weighted 2D images with different orientations were acquired for localization of the RN and DN, which can be identified by their relative low signal on the images [Drayer et al., 1986]. An oblique transverse slice through both centers of the RN and DN was selected for the functional scanning. A conventional T2* gradient echo pulse sequence was used, which is sensitive to the local activity associated changes in cerebral blood flow and oxygenation [Frahm et al., 1994]. The imaging parameters were: echo time = 40 ms; repetition time = 60 ms; a flip angle = 20 degrees; slice thickness = 5 mm. Images were acquired with 200 phase‐encoding steps and 200 complex pairs of the readouts in a field of view 20 cm by 20 cm, giving an in‐plane spatial resolution of 1 mm x 1 mm and a temporal resolution of 12 seconds per image.
For each fMRI experiment, the subject underwent nine continuous functional scans. A total of 135 T2*‐weighted images were acquired when the subject performed three cycles of rest, the CS and the CD tasks in Experiment 1, or, three cycles of rest, the GO, and the GD tasks in Experiment 2. Each condition was performed for the entire duration of an fMRI scan and 15 functional images were recorded. During the resting condition, the subjects did not touch the stimuli.
Data processing and analysis
All the post‐scan image processing was performed on a SUN Ultra30 workstation (Sun Microsystems, Mountain View, CA) using a MEDX software package (Sensor Systems, Inc., USA) and in‐house programs written in C or MATLAB (The Mathworks, Natick, MA). Both MRI phase and magnitude images were reconstructed from acquired free induction decays by 2D fast Fourier transformation. The phase images were used to identify the veins that had large MRI signal changes and the corresponding pixels on the magnitude images were excluded from further statistical analysis. The global MRI signal intensity drift was corrected with a scalar normalization procedure and a linear‐detrending program in MEDX.
Both task‐induced activation (task versus rest) and relative activation (discrimination task versus its control task) were individually determined by group t‐tests with a pixel‐clustering technique [Xiong et al., 1995]. The level of statistical significance (p < 0.05) of the detected averaged MRI signal changes was set by combining two criteria (t score and cluster size): (a) only pixels with the significant changes (t > 2.0) were included in a t‐score map, and (b) the regions with less than five contiguous activated pixels were excluded from the t‐score map. The resulting statistical parametric map was then overlaid directly on the T2*‐weighted image to illustrate activation sites. The direct overlay assured anatomical accuracy of the localized activation. Based on the activation map, both activated areas and activation intensities in the regions of interest (ROIs) were measured. For the time course of activation, the value for each image (with intervals of 12 seconds) were obtained by averaging the MRI signal intensities of the activated pixels in the nucleus of interest. A time course in an area with no significant activation was also obtained as a control for each fMRI experiment and the values at each time point were averaged over all the pixels in the area.
For simplicity, activation amplitudes (in arbitrary units) were used as indices of the integrated activations induced in the nuclei. The activation amplitude was computed as the product of the activated area and the activation intensity within the nuclei of interest. This index has physiological relevance especially for those anatomically definable nuclei consisting of the same population of neurons. In this study, the activated area (in units of mm2) was the number of the pixels with significant MRI signal changes (p < 0.05) as defined on the activation map. The activation intensity, either for each cycle or for all three cycles of the tasks, was determined by averaging the task‐induced MRI signal changes over all the pixels within the nuclei.
For cross‐subject comparisons and group mean data, activation amplitudes of both red nuclei and both dentate nuclei were individually measured and averaged over all three cycles of the tasks. The significant difference of the mean of the activation amplitudes during the discrimination task and its control task was determined by one‐tail, paired t tests (n = 7). The relative or discrimination‐dependent activation maps were also averaged over the seven subjects by a procedure of spatial normalization based on the anatomical landmarks [Fox, 1995]. The t‐score maps (unthresholded and unclustered) and the corresponding anatomical images from all the subjects were co‐registered to a standard T2* image from one subject by scaling, transformation, and interpolation. The same criteria (t > 2.0 and cluster size = 5) were used to determine the statistical significance of the activation [Xiong et al., 1995].
Based on an ROI analysis method [Fox, 1991], the coherence of sustained responses between the RN and DN was determined by comparison of their spatial activation patterns and measurement of the task‐dependent interregional covariance. The activation amplitudes and, more importantly, the changes of amplitude for each individual subject in each cycle of tasks, were used to calculate the cross‐subject correlation (the normalized covariance) between the activation amplitudes in RN and DN. The statistical significance of the cross correlation (r) was determined using ANOVA.
RESULTS
Identification of the RN and DN
As expected, both the RN and DN were readily identifiable by their distinct relatively low signal intensities on the T2*‐weighted MRI images (Fig. 1). The RN and DN in adult humans have a high density of capillaries and a high level of iron deposit, which induce a relatively high magnetic susceptibility and cause a reduction in the MRI signal intensities in the nuclei compared to the surrounding tissues [Drayer, 1986]. Since the human RN is spindle‐shaped and approximately 5 mm thick in the central region [Padel, 1993] and the DN is approximately 7‐11 mm in the direction parallel to the brain stem, with its center of mass more ventrally located, the selected brain slice (5 mm thick) covered nearly the entire RN and the most of the ventral DN.
Figure 1.
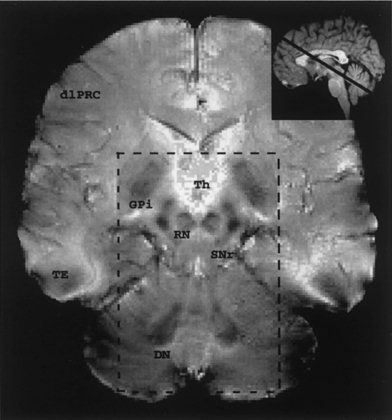
An oblique transverse T2*‐weighted MRI image of a brain section (5 mm thick) through the centers of the red nuclei (RN) and dentate nuclei (DN). The inlay is a mid‐sagittal T1 MRI image showing the orientation of the image plane, which parallels the superior cerebellar peduncle. The dash‐line box delineates a region of interest chosen for displaying the task‐induced activations as shown in Figures 2 & 3. Th: thalamus; GPi: internal globus pallidus; SNr: pars reticulata of substantia nigra; dlPFC: dorsolateral prefrontal cortex; TE: inferiotemporal cortex.
The selected image plane also has important anatomical relevance in that it is parallel to the axis of the superior cerebellar peduncle and traverses other distinguishable subcortical regions, including the internal globus pallidus (GPi) and the pars reticulata of the substantia nigra (SNr), which are the output structures of basal ganglia [Parent, 1996]. Unlike most regions of cerebral cortex, all these subcortical nuclei have definable boundaries on the MRI images, providing good anatomical grounds for comparisons across subjects and trials of the observed task‐associated activitions within the nuclei of interest.
Characterization of the evoked responses in the RN and DN
The task‐induced activations are illustrated in a set of fMRI images from a single representative subject (Figs. 2 & 3). In Experiment 1, slight but significant activations (Fig. 2A) were found in the left RN and right DN when the subject passively experienced the sandpaper stimulation produced by the experimenters (CS), while no significant activation was detected in the right RN and left DN. During the CD task when the subject covertly judged whether or not the stimuli on each hand was the same, both left and right RN and DN showed comparable increases in the task‐associated activation (Fig. 2B). The accompanying increases of activation in the RN and DN (in both spatial extent and intensity) suggest that there was greater activity in both regions during the sensory discrimination task than in the control task. Accordingly, the activations during the CD task also exhibited the contralateralized pattern in which the left RN and right DN showed greater activation than the right RN and left DN respectively.
Figure 2.
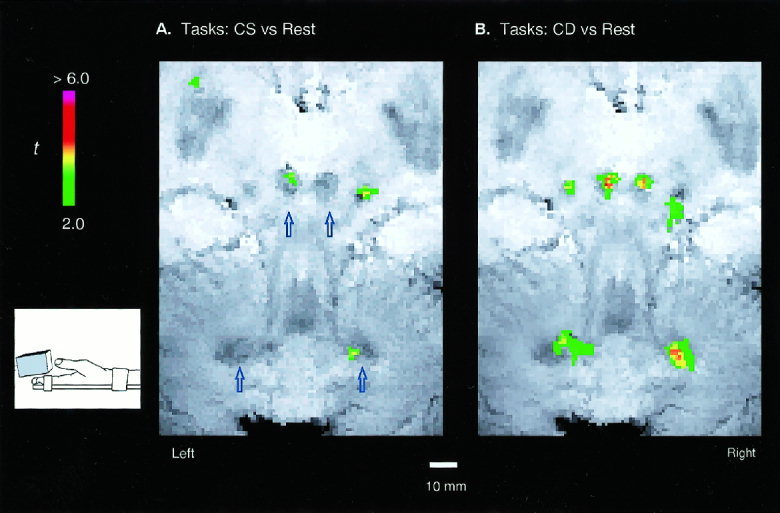
Task‐induced activations for a single, representative subject. The focused functional maps (t ‐score coded colors) overlaid directly on the T2* anatomical MRI images, showing the task‐induced activations in the RN and DN. Activation induced by the passive (non‐motor) pair of tactile tasks in which the subject, with the hands immobilized, experienced the stimulation of sandpaper of different grades touching the fingers. A t‐threshold of 2.0 and a pixel‐clustering size of 5 were chosen to reflect a significance level of p < 0.05 for the detected activation.
Figure 3.
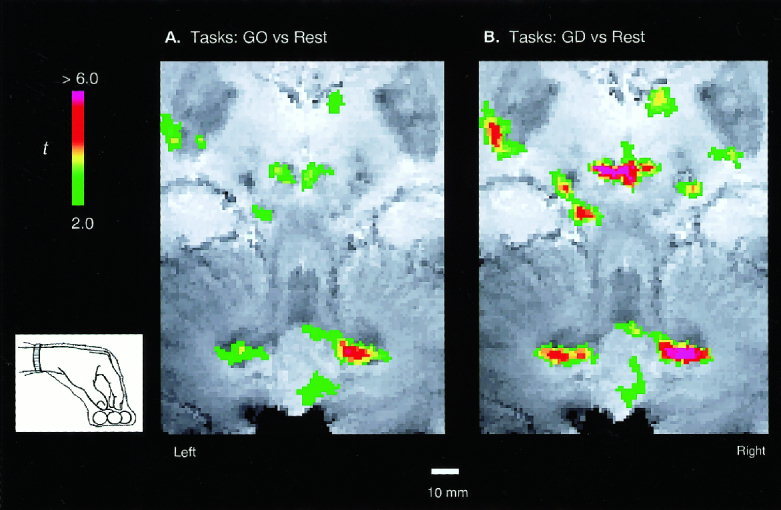
Task‐induced activations for a single, representative subject. The focused functional maps (t ‐score coded colors) overlaid directly on the T2* anatomical MRI images, showing the task‐induced activations in the RN and DN. Activation induced by the active pair of tactile tasks in which the subject's hands were unrestrained and allowed to grasp and manipulate the wooden balls of different shapes. A t‐threshold of 2.0 and a pixel‐clustering size of 5 were chosen to reflect a significance level of p < 0.05 for the detected activation.
In Experiment 2, the active tactile tasks induced much stronger and more extensive bilateral activation of RN and DN (Fig. 3) as compared to the passive tasks (Fig. 2). The strongest activation was found during the GD task and the activated regions nearly covered the whole RN and the ventral part of DN (Fig. 3B). As in Experiment 1, the activation had an asymmetric, contralateralized pattern, with stronger activation in the left RN and right DN. The smaller activations in the right RN and left DN for all tasks were likely due to the left cerebral hemispheric dominance for motor control in our right‐handed subjects. These results are also consistent with the anatomical studies of decussation of the dentato‐rubral projection at the superior cerebellar peduncle [Parent, 1996].
Figure 4 demonstrates the time courses of the mean MRI signal intensities in a non‐activated region and in the activated regions of the left RN and right DN during the three cycles of each experiment. The temporal patterns as well as the contralateralized activation patterns were observed consistently in every other subject.
Figure 4.
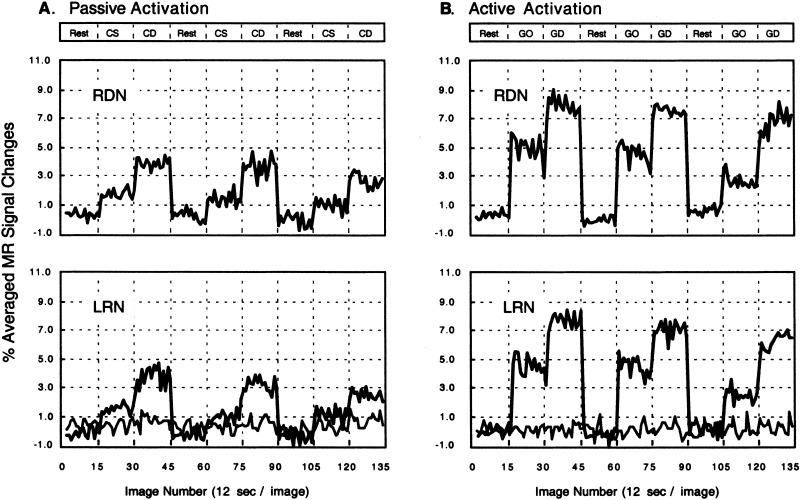
The time courses of the task‐induced activations in the left red nucleus (LRN) and right dentate nucleus (RDN) for the same data in Figures 2 & 3. A baseline of the averaged MRI signal intensities (the light line) in an area with no significant activation was also shown for each experiment.
Group comparisons
The well‐defined anatomy of the human RN and DN provide a basis for group mean data and quantitative comparison of the activation amplitudes across subjects (Figs. 5 & 6). Our results showed that both the RN and DN were about 300% more active (a combination of activation areas and intensities) when sensory discrimination was required in the CD task than when it was not required in the CS task (Fig. 5A). Thus, even in the absence of movements, there was a significant increase in activation in the RN, as well as the DN, in response to the task requirement for sensory discrimination. Likewise, the RN and DN were about 70% more active when the discrimination was required in the GD task than when it was not required in the GO task (Fig. 5B).
Figure 5.
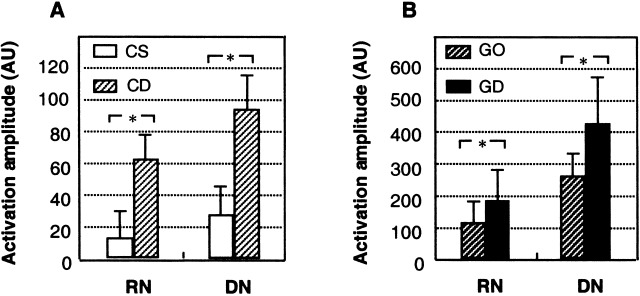
Mean (±SEM) activation amplitudes for both sides of the RN and DN in the seven subjects. The activation amplitude in arbitrary units (AU) is defined as product of the number of activated pixels within the nuclei of interest and the percent change of the MRI signal intensities averaged over all the pixels of the nuclei. *: the statistical level (p <0.05) of significant increases of the mean activation amplitudes in the RN and DN during the discrimination task (CD or GD) when compared with those during its control task (CS or GO), determined by one‐tail paired t‐tests (n = 7).
Figure 6.
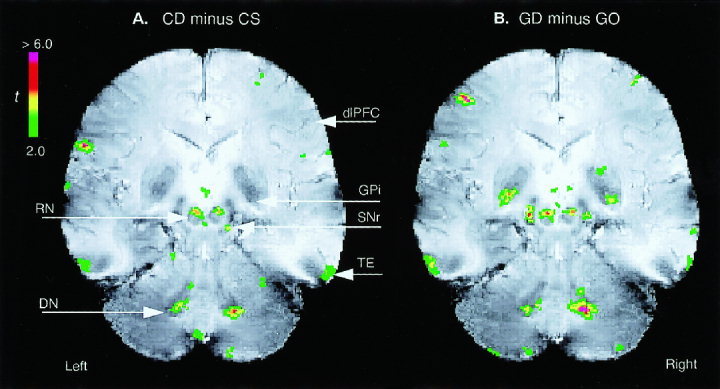
The relative activations in the RN and DN due to tactile discriminations. A: the passive tactile roughness discrimination (CD) task versus its control (CS) task; B: the active object‐shape discrimination (GD) task versus its control (GO) task. Both the functional and anatomical images were normalized to a standard image from one subject by scaling, transformation, and interpolation, and then were averaged across the seven subjects (see Materials and Methods). Other recognized active sites include GPi, SNr, dlPFC, and TE.
The relative activation maps (Fig. 6) demonstrated discrimination‐dependent increases of activity in the RN and DN. Because the hand movement in the GO task was designed to be closely matched to that in the GD task, activity due to movement per se would be largely removed by the subtraction. Therefore, the increase of activation in the RN, as in the DN, present after subtracting out activation due to movement, was consistent with the indication from the CD‐CS contrast that the RN is more active when the subject is engaged in sensory discrimination than in pure finger movements. In addition, for both pairs of the tasks, the discrimination‐dependent activations in the RN were rostrally located, while the increases in the DN were ventrally located.
An ROI‐based analysis was used to assess the functional connectivity among the red nuclei and the dentate nuclei by calculating inter‐subject trial‐by‐trial interregional covariance (Table I). Significant correlations (p < 0.05) were found mostly between the RN and the contralateral DN or between both sides of the same nuclei for the activation amplitudes during the discrimination (CD and GD) tasks or for the amplitude changes (CD minus CS and GD minus GO). The strongest correlation was between the left RN and the right DN for the discrimination‐dependent activations (r = +0.64 for CD minus CS or, r = +0.72 for GD minus GO). No significant correlation between the RN and the contralateral DN was found during the CS and the GO tasks. The positive correlation coefficients, particularly for the changes of activation amplitude, likely represent the parallel enhancement of activities in the RN and DN across the seven subjects.
Table I.
Task‐induced interregional covariance, determined by the cross‐subject (n = 7) correlation of the trial by trial changes in activation amplitudes between the RN and the DN. RRN: right RN; LRN: left RN; RDN: right DN; LDN: left DN. r: correlation coefficient; *: significant correlation at a level of p < 0.05
| (A) The Passive Tactile Tasks | ||||||||||||
|---|---|---|---|---|---|---|---|---|---|---|---|---|
| r | CS vs rest | CD vs rest | CD vs CS | |||||||||
| RRN | LRN | RDN | LDN | RRN | LRN | RDN | LDN | RRN | LRN | RDN | LDN | |
| RRN | 1 | .26 | .07 | .27 | 1 | .26 | .19 | .37 | 1 | .42* | .39 | .62* |
| LRN | 1 | .32 | .22 | 1 | .49* | −.14 | 1 | .64* | .44* | |||
| RDN | 1 | .19 | 1 | .41* | 1 | .47* | ||||||
| LDN | 1 | 1 | 1 | |||||||||
| (B) The Active Tactile Tasks | ||||||||||||
| r | GO vs rest | GD vs rest | GD vs GO | |||||||||
| RRN | LRN | RDN | LDN | RRN | LRN | RDN | LDN | RRN | LRN | RDN | LDN | |
| RRN | 1 | .15 | −.11 | .22 | 1 | .42* | .31 | .53* | 1 | .49* | .22 | .69* |
| LRN | 1 | .37 | .12 | 1 | .56* | .32 | 1 | .72* | .35 | |||
| RDN | 1 | .14 | 1 | .45* | 1 | .56* | ||||||
| LDN | 1 | 1 | 1 | |||||||||
DISCUSSION
The principal focus of this paper is on activity patterns in the RN and their relationship to activity in lateral regions of the cerebellum. In order to set the context for our consideration of the functional implications of our findings, we will first discuss what is known about the functional neuroanatomy of the human RN.
The mammalian red nucleus
The mammalian, and especially the primate, RN can be primarily divided into two regions, the magno‐ and parvo‐cellular regions, each with distinctly different anatomical and presumably functional organization [Courville and Otabe, 1974; Flumerfelt et al., 1973; Humphrey et al., 1984; Stanton, 1980; Strominger et al., 1979; Tokuno, 1995]. The caudal magnocellular RN is the largest region of the RN in non‐primates but in both non‐primates and primates it gives rise to the rubrospinal tract. This pathway has historically been associated with “motor related” functions like the facilitation of muscle tone in the flexor groups [Rengachary, 1996] and the control of the speed and rotation of forelimb movements [Gibson et al., 1985; Miller and Sinkjaer, 1998]. Monkeys subjected to unilateral or bilateral pyramidotomy tend to largely retain voluntary control over the limbs while this control is abolished with lesion of the RN or rubrospinal tract [Lawrence and Kuypers, 1968]. In humans, the largest region of the RN is actually the parvocellular region, which does not project to the spinal cord at all, but instead projects to the inferior olive [Massion, 1967; Parent, 1996]. The function of this portion of RN remains almost entirely unknown [Keifer and Houk, 1994], but of course is particularly intriguing given the fact that the inferior olive projects exclusively back to the cerebellum itself [De Zeeuw et al., 1998].
In the current imaging study, limitations in resolution do not allow us to clearly distinguish between these two regions. However, given the relative size of the parvocellular region in humans, it is very likely that most of the activation we observe comes from this subdivision of the RN. This interpretation is also supported by the strong correlation between activity in the DN and the RN in this study. It is known that the DN provides a substantial projection to the parvocellular region of the RN [Kennedy et al., 1986]. As also shown here, the extensive activation in the RN associated with tactile sensation and perceptual judgment suggests that the parvocellular RN may be involved in relaying back to the cerebellum by way of the inferior olive, information associated with these sensory related behaviors. Our own preliminary results, in fact, demonstrate that activity levels in the inferior olive partially mimic activity in the RN and the DN for the different tasks used in this study [Pu et al., 1998]. While it is beyond the scope of this article, several studies have suggested a role for the DN in control of the dynamical state of the inferior olive [Lang et al., 1996; Llinas, 1974; Llinas and Sasaki, 1989]. Involvement of the RN, which also receives large projections from the DN, adds further complexity to this system. Our results demonstrating RN activation when subjects were asked to reach, grasp, hold and rotate tactile stimuli (Fig. 3A) are, in principle, consistent with the idea that the RN is related to voluntary limb movements [Dugas and Smith, 1992; Houk and Gibson, 1987; Robinson, 1995; Sinkjaer et al., 1995; van Kan et al., 1994]. However, as discussed in the next section, we suggest that our data, on closer inspection, must raise the question whether these activation patterns may be secondary to the movement itself, and might actually be more related to the use of the arm, hand, and especially the fingers in tactile sensory data acquisition.
Red nucleus responses to tactile stimuli
The data from both the non‐movement and movement tactile tasks clearly demonstrate that the RN, like the DN, was more strongly activated when the subject was engaged in tactile sensory discrimination. The significant activation during the non‐movement tasks is consistent with the idea that the RN is activated by purely sensory stimuli in the absence of any motor response. Thus, tactile sensory stimulation alone evokes substantial RN activity, even in the absence of the opportunity to coordinate finger movements [Ito, 1984] or to use the sensory cues to guide movement [Vinay and Padel, 1990]. Moreover, we have shown that the relative increases of activation amplitudes during both the CD and GD tasks are commensurate in the RN and DN (Figs. 5 & 6; Table I), suggesting that the activity changes in the DN, rather than some other afferents, are likely to be principally responsible for the activity changes in the RN.
We have also found that there is a larger absolute scale of responsiveness in the RN for the active (GO and GD) tasks than for the passive (CS and CD) tasks (Figs. 2, 3, 4, 5). As already mentioned, this result is consistent with previous studies in the RN [Dugas and Smith, 1992; Houk and Gibson, 1987; Robinson, 1995; Sinkjaer et al., 1995; van Kan et al., 1994], indicating the general association of this structure with finger or limb movements. However, we have also shown that this activation is maximal for finger movements involving sensory discrimination.
Dissociating sensory from motor control
One important difference between the current experiments and our previous findings [Gao et al., 1996] is the substantial activation of the DN induced by active finger movements not explicitly involving sensory discrimination. Previous reports from our laboratory using a different non‐discrimination finger movement paradigm had reported little or no activation of the DN with finger movements alone [Gao et al., 1996], consistent with the finding of little activation observed using other primarily fine motor tasks involving the hand [Kim et al., 1994]. While the image planes were slightly different between our two studies (the image plane was more ventral in the current study), we believe that the difference in DN response in each case is more likely to be related to differences in the finger movements the subjects were asked to make. In the first study, the finger movement alone task (GO) consisted of simply picking up tactile objects with a pincer grasp. We originally selected this particular movement because it closely mimics the type of task that has typically been used to study the cerebellar control of fine finger movements in monkeys [Dugas and Smith, 1992; Houk and Gibson, 1987; Robinson, 1995; Sinkjaer et al., 1995; van Kan et al., 1994]. In effect, we adopted the standard of the field for the type of finger movements the cerebellum was thought to control. Our previous results demonstrated clearly that the human DN generated little activity during this type of pure fine finger movement task.
In contrast, in the current experiments we were interested in making the GO and GD finger movements as similar as possible to evaluate how DN and RN activity scaled with the additional requirement for sensory discrimination. In other words, we aimed to determine whether the requirement to perform a sensory discrimination added any additional activation, or whether all the activation could be attributed simply to the finger movements themselves. In doing so, we were aware that we were potentially confounding our results by blurring the distinction between sensory and motor components of the behavior (rather than dissociating these components, which was our goal in Gao et al., 1996). Specifically, as finger movements become more complex, there is almost certainly a greater need by the motor system for higher quality tactile sensory information. In the context of the sensory data acquisition theory we are testing [Bower, 1997a, 1997b], this increased requirement for sensory data control should by itself result in greater cerebellar activation. The data presented in this paper shows, as expected, that the DN as well as the RN are more active under these conditions. However, even when every effort was made to match the finger movements in both the GO and GD tasks, the largest activations in both DN and RN are still found during the sensory discrimination task.
With respect to the hypothesis we set out to test, the increased activation seen with sensory discrimination reflects the greater requirement for tactile data in the discrimination task. As such, we believe that the present data are consistent with the sensory data acquisition hypothesis. While one could argue that this reasoning is somewhat circular, i.e. increased activation during tactile discrimination implies an increased need for control of tactile sensory data, and vice versa, it is important to point out that this was the result predicted before the experiments were conducted. Further, if these regions of the cerebellum were only concerned with motor coordination, it is hard to understand why the very similar movements produced a 70% difference in cerebellar activity. Finally, it should also be noted that the hypothesis we are testing was not formulated to explain imaging data; rather, these results of imaging experiments were used to test a hypothesis that emerged from electrophysiological, anatomical and behavioral studies in a different mammalian species [Bower, 1997a, 1997b].
Consistent with our previous report [Gao et al., 1996], sensory stimulation even without finger movements activates the DN and RN, although in the current experiment at a level reduced with respect to either active task. In our view, the reduced activation levels with passive (non‐movement) sensory discrimination reflects the fact that in this task the fingers cannot be used to improve the quality of sensory data acquisition. However, the three facts that (1) the DN and, in this study, the RN both respond when sensory data alone is present, (2) that DN and RN activity scales with the sensory requirements of the task, and (3) that there is a complete lack of DN response during simple finger movements alone [Gao et al., 1996], suggest that overall our results are more consistent with the proposal that requirements for sensory processing, rather than motor coordination per se, drive activity in these structures.
The RN and DN as support structures
In the introduction of this paper and elsewhere [Bower, 1997a, 1997b], we have tried to draw the distinction between, on the one hand, the possibilitiy that cerebellum and its related nuclei support a wide range of information processing in other brain regions, and, on the other, the possibility that these circuits are primarily involved in that processing itself. This is a particularly important distinction with respect to brain imaging studies. In general in the field of brain imaging, increased activation during a particular task is taken to imply direct involvement of that brain region in the task studied. However, because the cerebellum appears to be a “side loop” on most sensory/motor systems [Bower, 1997a, 1997b], we believe caution must be exercised in attributing its direct involvement in operations elicited by a task. With respect to the current results, for example, the fact that tactile sensory stimulation alone is observed to evoke substantial DN and RN activity, and that the largest activity in both structures is evoked during tactile sensory discrimination would typically be interpreted to suggest that these structures are directly involved in tactile discrimination. However, there is a great deal of evidence that sensory discrimination is closely associated with cerebral cortex in general, and primary regions (e.g. SI) of cerebral cortex in particular [for reviews, see Gardner, 1988; Gardner et al., 1989; Kandell and Jessell, 1991; Martin, 1991; Martin and Jessell, 1991a, 1991b]. As discussed earlier, the outputs of the human RN for example are almost exclusively to the spinal cord and to the inferior olive. Thus, there is no direct connection between the RN and the cerebral cortex. The RN projection to the spinal cord, however, does provide a means to directly influence the acquisition of tactile sensory data through the slight repositioning of the sensory surfaces [Bower, 1997a, 1997b]. Clearly additional experiments will be necessary to directly investigate the functional role of the human red nucleus, particularly the parvocellular portion. However, this testing requires that the sensory and motor components of behaviors be clearly distinguished and, where possible, separated, and that the any causal relationship between brain activation and direct involvement in a particular computation be carefully considered.
Edited by: Karl Friston, Associate Editor.
REFERENCES
- Allen G, Buxton RB, Wong EC, Courchesne E (1997): Attentional activation of the cerebellum independent of motor involvement. Science 275: 1940–1943. [DOI] [PubMed] [Google Scholar]
- Blakemore SJ, Wolpert DM, Frith CD (1998): Central cancellation of self‐produced tickle sensation. Nature Neurosci 1: 635–640. [DOI] [PubMed] [Google Scholar]
- Bower JM, Kassell J (1990): Variability in tactile projection patterns to cerebellar folia crus‐IIa of the Norway rat. J Comp Neurol 302: 768–778. [DOI] [PubMed] [Google Scholar]
- Bower JM (1997a): Is the cerebellum sensory for motor's sake, or motor for sensory's sake: the view from the whiskers of a rat? Progress in Brain Res 114: 463–496. [DOI] [PubMed] [Google Scholar]
- Bower J M (1997b): The cerebellum and the control of sensory data acquisition. The cerebellum and cognition In: International review of neurobiology, Vol 41 Schmahmann J, editor. San Diego, CA: Academic Press, p 489–513. [DOI] [PubMed] [Google Scholar]
- Bracke‐Tolkmitt R, Linden A, Canavan GM, Rockstroh B, Scholz E, Wessell K, Diener HC (1989): The cerebellum contributes to mental skills. Behav Neurosci 103: 442–446. [Google Scholar]
- Bucher SF, Seelos KC, Dodel RC, Reiser M, Oertel WH (1997): Activation mapping in essential tremor with functional magnetic resonance imaging. Ann of Neurol 41: 32–40. [DOI] [PubMed] [Google Scholar]
- Courville J, Otabe S (1974): The rubro‐olivary projection in the macaque: an experimental study with silver impregnation methods. J Comp Neurol 158: 479–494. [DOI] [PubMed] [Google Scholar]
- De Zeeuw CI, Simpson JI, Hoogenraad CC, Galjart, Niels, Koekkoek SKE, Ruigrok TJH (1998): Microcircuitry and function of the inferior olive. Trends in Neurosci 21: 391–407. [DOI] [PubMed] [Google Scholar]
- Drayer B, Burger P, Darwin R, Riederer S, Herfkens R, Johnson GA (1986): MRI of brain iron. Am J Roentgenol 147: 103–110. [DOI] [PubMed] [Google Scholar]
- Dugas C, Smith AM (1992): Responses of cerebellar Purkinje cells to slip of a hand‐held object. J Neurophysiol 67: 483–495. [DOI] [PubMed] [Google Scholar]
- Flumerfelt BA, Otabe S, Courville J (1973): Distinct projections to the red nucleus from the dentate and interposed nuclei in the monkey. Brain Res 50: 408–414. [DOI] [PubMed] [Google Scholar]
- Fox PT (1991): Physiological ROI definition by image subtraction. J Cereb Blood Flow Metab 11: 79–82. [DOI] [PubMed] [Google Scholar]
- Fox PT (1995): Spatial normalization: origins, applications, and alternatives. Hum Brain Mapp 4: 1–2. [Google Scholar]
- Frahm J (1994): Brain or vein‐oxygenation or flow? On signal physiology in functional MRI of human brain activation. NMR Biomed 7: 45–48. [DOI] [PubMed] [Google Scholar]
- Friston KJ, Frith CD, Liddle PF, Frackowiak RS (1993): Functional connectivity: the principal‐component analysis of large (PET) data sets. J Cereb Blood Flow Metab 13: 5–14. [DOI] [PubMed] [Google Scholar]
- Gao J‐H, Parsons LM, Bower JM, Xiong J, Li J, Fox PT (1996): Cerebellum implicated in sensory acquisition and discrimination rather than motor control. Science 272: 545–547. [DOI] [PubMed] [Google Scholar]
- Gardner EP (1988): Somatosensory cortical mechanisms of feature detection in tactile and kinesthetic discrimination. Can J Physiol Pharmocol 66: 439–454. [DOI] [PubMed] [Google Scholar]
- Gardner EP, Hamalainen HA, Palmer CI, Warren S (1989): Touching the outside world: Representation of motion and direction within primary somatosensory cortex In: Sensory processing in the mammalian brain: Neural substrates and experimental strategies. New York: Oxford University Press, p 49–66. [Google Scholar]
- Gibson AR, Houk JC, Kohlerman NJ (1985): Relation between red nucleus discharge and movement parameters in trained macque monkeys. J Physiol (Lond.) 385: 551–570. [DOI] [PMC free article] [PubMed] [Google Scholar]
- Grafman J, Litvan I, Massaquoi S, Stewart M, Sirigu A, Hallett M (1992): Cognitive planning deficits in patients with cerebellar atrophy. Neurology 42: 1493–1496. [DOI] [PubMed] [Google Scholar]
- Holmes G (1939): The cerebellum of man. Brain 62: 1–30. [Google Scholar]
- Houk JC, Gibson AR (1987): Sensorimotor processing through the cerebellum In: King JS, editor. New oncepts in erebellar neurobiology. New York: Alan R. Liss, Inc., p 387–416. [Google Scholar]
- Houk JC, Wise SP (1995): Distributed modular architectures linking basal ganglia, cerebellum, and cerebral‐cortex ‐ their role in planning and controlling action. Cerebral Cortex 5: 95–110. [DOI] [PubMed] [Google Scholar]
- Humphrey DR, Gold R, Reed DJ (1984): Sizes, laminar and topographic origins of cortical projections to the major divisions of the red nucleus in the monkey. J Comp Neurol 225: 75–94. [DOI] [PubMed] [Google Scholar]
- Ito M (1984): The Cerebellum and Motor Control. New York: Raven Press. [Google Scholar]
- Ivry RB, Keele SW (1989): Timing functions of the cerebellum. J Cognit Neurosci 1: 136–152. [DOI] [PubMed] [Google Scholar]
- Jueptner M, Ottinger S, Fellows SJ, Adamschewski J, Flerich L, Muller SP, Diener HC, Thilmann AF, Weiller C (1997): The relevance of sensory input for the cerebellar control of movements. Neuroimage 5: 41. [DOI] [PubMed] [Google Scholar]
- Kandel ER, Jessell TM (1997): Touch In: Principles of Neural Science. Kandel ER, Schwartz JH, Jessell TM, editors (3rd ed.). Norwalk, CT: Appleton & Lange, p 367–384. [Google Scholar]
- Keifer J, Houk JC (1994): Motor function of the cerebellorubrospinal system. Physiol Reviews 74: 509–542. [DOI] [PubMed] [Google Scholar]
- Kim S‐G, Ugurbil K, Strick PL (1994): Activation of a cerebellar output nucleus during cognitive processing. Science 265: 946–951. [DOI] [PubMed] [Google Scholar]
- Lang EJ, Sugihara I, Llinas R (1966): GABAergic modulation of complex spike activity by the cerebellar nucleoolivary pathway in rat. J Neurophysiol 76: 255–275. [DOI] [PubMed] [Google Scholar]
- Lawrence DG, Kuypers HG (1968): The functional organization of the motor system in the monkey. II. The effects of lesions of the descending brain‐stem pathways. Brain 91: 15–36. [DOI] [PubMed] [Google Scholar]
- Liu Y, Pu Y, Gao J‐H, Fox PT (1997a): Assessment of Human Red Nucleus using fMRI. Neuroimage 5: 263. [Google Scholar]
- Liu Y, Gao J‐H, Pu Y, Parsons LM, Liotti M, Fox PT (1997b): Visualization of the functioning neural connections between the human red and dentate nuclei. (Abstract) Society for Neurosci. 23: 1098. [Google Scholar]
- Llinas R (1974): Eighteenth Bowditch Lecture. Motor aspects of cerebellar control. Physiologist 17: 19–46. [PubMed] [Google Scholar]
- Llinas R, Sasaki K (1989): The functional organization of the olivo‐cerebellar system as examined by multiple Purkinje cell recordings. Eur J Neurosci 1: 587–602. [DOI] [PubMed] [Google Scholar]
- Martin JH (1997): Coding and processing of sensory information In: Principles of Neural Science. Kandel ER, Schwartz JH, Jessell TM, editors (3rd edition). Norwalk, CT: Appleton & Lange, p 329–340. [Google Scholar]
- Martin JH, Jessell TM (1997a): Modality coding in somatic sensory system In: Principles of neural science. Kandel ER, Schwartz JH, Jessell TM, editors (3rd edition). Norwalk, CT: Appleton & Lange, p 341–352. [Google Scholar]
- Martin JH, Jessell TM (1997b): Anatomy of the somatic sensory system In: Principles of neural science. Kandel ER, Schwartz JH, Jessell TM, editors (3rd edition). Norwalk, CT: Appleton & Lange, p 353–366. [Google Scholar]
- Massion J (1967): The mammalian red nucleus. Physiol Rev 47: 383–436. [DOI] [PubMed] [Google Scholar]
- Middleton FA, Strick PL (1997): Dentate output channels: motor and cognitive components. Progress in Brain Res 114: 553–566. [DOI] [PubMed] [Google Scholar]
- Miller LE, Sinkjaer T (1998): Primate red nucleus discharge encodes the dynamics of limb muscle activity. J Neurophysiol 80: 59–70. [DOI] [PubMed] [Google Scholar]
- Padel Y (1993): Magnocellular and parvocellular red nuclei. Anatomical and functional aspects of their connections with the cerebellum and other nervous centres. Rev Neurol (Paris) 149(11): 703–715. [PubMed] [Google Scholar]
- Parent A (1996): In Carpenter's Human Neuroanatomy, 9th Ed Baltimore: Williams & Wilkins, 1996. [Google Scholar]
- Parsons LM, Bower JM, Gao J‐H, Xiong J, Li J, Fox PT (1997): Lateral cerebellar hemispheres actively support sensory acquisition and discrimination rather than motor control. Learn Memory 4: 49–62. [DOI] [PubMed] [Google Scholar]
- Parsons LM, Bower JM, Xiong J, Saenz M, Fox PT (1997): Cerebral control of cerebellar processes that support passive and active sensation. Neuroimage 5: 215. [Google Scholar]
- Parsons LM, Denton D, Egan G, McKinley, Shade RM, Lancaster J, Fox PT (2000): Neuroimaging evidence implicating cerebellum in support of sensory/cognitive processes associated with thirst. Proceedings of National Academy of Science USA: 97: 2332–2336. [DOI] [PMC free article] [PubMed] [Google Scholar]
- Penhune VB, Zatorre RJ, Evans AC (1998): Cerebellar contributions to motor timing: A PET study of auditory and visual rhythm reproduction. J Cog Neurosci 10: 752–765. [DOI] [PubMed] [Google Scholar]
- Petersen SE, Fox PT, Posner MI, Mintun M, Raichle ME (1989): Positron emission tomographic studies of the cortical anatomy of single‐word processing. Nature 331: 585–589. [DOI] [PubMed] [Google Scholar]
- Pu Y, Liu Y, Gao J‐H, Parsons LM, Xiong J, Liotti M, Qin Y‐L, Bower JM, Fox PT (1998): Implication of human inferior olive in sensory discrimination, a fMR study (Abstract). Society for Neurosci 24: 1150. [Google Scholar]
- Rengachary SS (1996): Cranial nerve examination In Wilkins RH, Rengachary SS, editors. Neurosurgery. McGraw‐Hill, p 67–85. [Google Scholar]
- Robinson FR (1995): Role of the cerebellum in movement control and adaptation. Curr Opinion Neurobiol 5: 755–762. [DOI] [PubMed] [Google Scholar]
- Schmahmann JD, editor (1997): The cerebellum and cognition. New York: Academic Press. [Google Scholar]
- Seitz RJ, Roland PE, Bohm C, Greitz T, Stoneelander S (1991): Somatosensory discrimination of shape: Tactile exploration and cerebral activation. Eur J Neurosci 3: 481–492. [DOI] [PubMed] [Google Scholar]
- Sinkjaer T, Miller L, Andersen T, Houk JC (1995): Synaptic linkages between red nucleus cells and limb muscles during a multi‐joint motor task. Exp Brain Res 102: 546–550. [DOI] [PubMed] [Google Scholar]
- Sobel N, Prabhakaran V, Hartley CA, Desmond JE, Zhao Z, Glover GH, Gabrieli JDE, Sullivan EV (1998): Odorant‐induced and sniff‐induced activation in the cerebellum of the human. J Neurosci 18: 8990–9001. [DOI] [PMC free article] [PubMed] [Google Scholar]
- Stanton GB (1980): Topographical organization of ascending cerebellar projections from the dentate and interposed nuclei in Macaca mulatta: an anterograde degeneration study. J Comp Neurol 190: 699–731. [DOI] [PubMed] [Google Scholar]
- Strominger NL, Truscott TC, Miller RA, Royce GJ (1979): An autoradiographic study of the rubro‐olivary tract in the rhesus monkey. J Comp Neurol 183: 33–45. [DOI] [PubMed] [Google Scholar]
- Tesche CD, Karhu JJT (2000): Anticipatory cerebellar responses during somatosensory omission in man. Hum Brain Mapp 9: 119–142. [DOI] [PMC free article] [PubMed] [Google Scholar]
- Thier P, Haarmeier T, Treue S, Barash S (1999): Absence of a common functional denominator of visual disturbances in cerebellar disease. Brain 122: 2133–2146. [DOI] [PubMed] [Google Scholar]
- Thach WT, Goodkin HP, Keating JG (1992): The cerebellum and the adaptive coordination of movement. Ann Rev Neurosci 15: 403–442. [DOI] [PubMed] [Google Scholar]
- Tokuno H, Takada M, Nambu A, Inase M (1995): Somatotopical projections from the supplementary motor area to the red nucleus in the macaque monkey. Exptl Brain Res 106: 351–355. [DOI] [PubMed] [Google Scholar]
- Welsh JP, Lang EJ, Sugihara I, Llinas R (1995): Dynamic organization of motor control within the olivocerebellar system. Nature 374: 453–457. [DOI] [PubMed] [Google Scholar]
- van Kan PL, Horn KM, Gibson AR (1994): The importance of hand use to discharge of interpositus neurones of the monkey, J Physiol 480: 171–190. [DOI] [PMC free article] [PubMed] [Google Scholar]
- Xiong J, Gao J‐H, Lancaster JL, Fox PT (1995): Clustered pixels analysis for functional MRI activation studies of the human brain. Hum Brain Mapp 3: 287–301. [Google Scholar]