

Abstract
The present study investigated the effect of attention on brain activation in a dichotic listening situation. Dichotic listening is a technique to study laterality effects in the auditory sensory modality. Two different stimuli were presented simultaneously, one in each ear. Twelve subjects listened to lists of consonant‐vowel syllables, or short musical instrument passages, with the task of detecting a “target” syllable or musical instrument by pressing a button. The target stimulus appeared an equal number of times in the left and right ear. The subjects were instructed to either concentrate on the stimuli presented in both ears, or only on the left or right ear stimulus. Brain activation was measured with 15O‐PET, and significant changes in regional normalized counts (rNC) were evaluated using statistical parametric mapping (SPM96) software. Concentrating on either the right or left ear stimulus significantly decreased activity bilaterally in the temporal lobes compared to concentrating on both ear stimuli, at the expense of an increased activation in the right posterior and inferior superior parietal lobe. The CV‐syllables activated areas corresponding to the classic language areas of Broca and Wernicke. The musical instrument stimuli mainly activated areas in visual association cortex, cerebellum, and the hippocampus. An interpretation of the findings is that attention has a facilitating effect for auditory processing, causing reduced activation in the primary auditory cortex when attention is explicitly recruited. The observed activations in the parietal lobe during the focused attention conditions could be part of a modality non‐specific “attentional network”. Hum. Brain Mapping 10:87–97, 2000. © 2000 Wiley‐Liss, Inc.
Keywords: Dichotic listening, PET, attention, speech perception, brain imaging
INTRODUCTION
The dichotic listening (DL) situation means that two different auditory stimuli are presented at the same time, one in each ear (Kimura, 1961; Bryden, 1988). A common empirical finding with the DL technique is that more items are reported from the right compared to the left ear input, for speech stimuli (Bryden, 1988; Hugdahl, 1995). This is called a Right‐Ear Advantage (REA), and is one of the most frequently used indices of brain laterality within the auditory domain (see Hugdahl, 1988 for an overview). The REA is considered to be a result of the anatomical fact that the contralateral neural pathways are more preponderant than the ipsilateral ones (Brodal, 1981), and that the left hemisphere is “programmed” to be superior to the right hemisphere for processing of linguistic auditory input (Kimura, 1961; 1967). As a consequence, speech stimuli presented in the right ear are processed more readily than similar information simultaneously presented in the left ear.
The attenuation, or absence, of a REA is used as a measure of cognitive dysfunction after brain damage (Eslinger & Damasio, 1988; Lee, Loring, Varney, Roberts, et al., 1994, Grote, Pierre‐Louis, Smith, Roberts, et al., 1995; Hugdahl & Wester, 1992; Zatorre, 1989), particularly temporal lobe damage. Other authors have used dichotic listening to infer cognitive dysfunctions in psychiatric patients (e.g. Wexler, 1986; Wexler, Giller & Southwick, 1991; Green, Hugdahl, & Mitchell, 1994; Bruder, 1988; O'Leary, Andreasen, Hurtig, Kesler, et al., 1996a). Thus, it seems important to investigate the underlying mechanisms behind the ear advantage effect in dichotic listening to both speech and non‐speech stimuli.
The “classic” approach to specify the functional anatomy of dichotic listening has been to compare performance on the dichotic listening test with performance on invasive tests like the Sodium‐Amytal procedure (Wada & Rasmussen, 1960; Hugdahl, Carlsson, Uvebrant, & Lundervold, 1997), or to systematically compare dichotic listening performance in selected patient groups with discrete lesions in either the left or right hemisphere (Sparks & Geschwind, 1968; Eslinger & Damasio, 1988). However, with the advent of the new neuroimaging techniques, it is possible to study changes in regional neural activity indexed as regional cerebral blood flow (rCBF) in the critical brain areas during a dichotic listening task (e.g. O'Leary, et al., 1996 b). In a previous study from our laboratory (Hugdahl, Brønnick, Kyllingsbæk, Law, et al., 1999) we used the 15O‐PET technique to record changes in rCBF when the subjects listened to dichotic presentations of either consonant‐vowel syllables, or short passages of musical instruments. The subjects were instructed to press a button whenever a “target” stimulus was detected among the different CV‐syllable or musical instrument stimuli. Changes in rCBF during the active stimulus conditions were contrasted against a situation with passive listening to binaural presentations of simple tones, to cancel out the effects of auditory perception per se. Significant clusters of activation were observed in the posterior part of the superior temporal gyrus, overlapping both the primary auditory cortex and the receptive language areas. A “left‐larger‐than‐right” asymmetry was observed for the CV‐syllables, while a “right‐larger‐than‐left” asymmetry was observed for the musical instrument stimuli.
However, although the ear advantage typically observed in dichotic listening is a robust experimental phenomenon (cf. Hugdahl & Hammar, 1997), the REA is subject to influence from selective shifting of attention to either the left or right ear (Asbjørnsen & Bryden, 1998; Bryden, Munhall, & Allard, 1983, Asbjørnsen & Hugdahl, 1995; Mondor & Bryden, 1991). The ability to overcome the REA in dichotic listening has been reported both for sustained attention, instructing the subject to focus attention on one ear across all trials in a session (e.g. Asbjørnsen & Hugdahl, 1995; Hugdahl & Andersson, 1986), and for shifting of attention to one ear on a trial‐by‐trial basis through the presentation of a “cue” stimulus just before the dichotic stimuli (e.g. Mondor & Bryden, 1991). Thus, it is obvious that focusing of attention to the right or left side in auditory space may dramatically affect the ear advantage seen in dichotic listening. This means that “instruction‐driven” or top‐down processing strategies may modulate “stimulus‐driven” or bottom‐up processing strategies.
An important, but largely unresolved, issue is to what extent previously observed behavioral effects of attention on dichotic listening performance is paralleled by changes in brain activation. This would provide a contribution to the understanding of how attention works in conjunction with the processing of a sensory stimulus. It is important to keep in mind that in the traditional “attention‐paradigm” in dichotic listening (e.g., Hugdahl & Andersson, 1986; Bryden et al., 1983), the sensory stimulus parameters are kept constant across test conditions, while instruction about focusing of attention is manipulated. In a first study on the effect of attention on changes in rCBF, O'Leary, Andreasen, Hurtig, Hichwa, et al. (1996b) used the 15O‐PET technique when subjects listened to dichotic presentations of consonant‐vowel‐consonant (CVC) syllables, with instructions to either focus attention on the right or left ear (see also O'Leary, Andreasen, Hurtig, Torres, et al., 1997). Compared to a baseline condition, focusing attention laterally resulted in increased rCBF in the contralateral hemisphere, that is, increased rCBF on the right side when attention was focused on the left ear stimulus, and vice versa. The increased activation was mainly seen in the primary and secondary auditory cortices.
A possible confound with the O'Leary et al. (1996b) study is that the authors did not have a divided attention condition with the same dichotically presented stimuli. Thus, it is difficult to disentangle lateralized effects of attention from lateralized effects caused by the stimulus per se. This is a critical issue since dichotic presentations of speech sounds cause clear lateralized behavioral effects per se, i.e. the right ear advantage. In the present study we compared changes in rCBF with the 15O‐PET technique to dichotic presentations of consonant‐vowel (CV) syllables under three attentional conditions: “attend to both ears”, “attend to the left ear”, “attend to the right ear”. The task of the subject was to detect a “target” CV‐syllable that was presented equally often in the left and right ear. A second block of scans involved presenting short passages of musical instruments, under the same dichotic and attention conditions as for the CV‐syllables. If attention does not affect processing of the auditory stimulus, changes in rCBF would be the same for all three attention conditions. If attention affects the processing of the sensory stimulus, changes in rCBF in the critical areas would differ between the different attention conditions.
METHODS
Subjects
The subjects were 12 right‐handed male subjects between 20 and 30 years of age. The subjects were all medical students. Handedness was checked with the Edinburgh Handedness Inventory (Oldfield, 1971). All subjects had Danish as their native language, and the CV‐syllables did not represent any real words. Informed consent was obtained according to the Declaration of Helsinki II and the study was approved by the local ethics committee of Copenhagen (KF 01‐171/93).
Stimuli
The stimuli were digitized and presented from a PC equipped with a Creative Laboratories SoundBlaster 16 board. Stimulus presentations were controlled from software written in the MEL2 (Micro Electronic Laboratory, Schneider; Rodgers, Maciejcyk, Zucculotto et al., 1995) programming language. After digitization, the stimuli were temporally aligned for simultaneous onset in the left and right channels with the help of a sound editing program equipped with stereo channel editing capability (Goldwave Software). All stimuli were aligned at the initial energy release as closely as possible.
Pairs of consonant‐vowel (CV)‐syllables and excerpts from musical instruments were presented through earphones in a dichotic listening situation. All stimuli had a duration of 380 ms, with an onset‐to‐onset interstimulus interval of 1000 ms (+/‐ 200 ms). The two classes of stimuli were matched with regard to the parameters duration, intensity, and interstimulus interval. The CV‐syllables were /Ba/, /Da/, /Ka/, and the musical instrument sounds were /Harpsichord/, /Guitar/, and /Organ/. Thus, 3 CVs and 3 musical instrument excerpts were used. In addition, binaural presentations of 3 simple tones (800, 1200, and 1600 Hz) served as baseline conditions (repeated twice) for subtraction with the CV‐syllables and musical instrument conditions1.
Half the subjects had the /da/‐syllable as the target, the other half of the subjects had the /ka/‐syllable as target. For the musical instruments, half the subjects had the /harpsichord/ as target, the other half of the subjects had the /organ/ as target. The order of presentation of the CV‐syllables and musical instrument stimuli was counterbalanced across subjects, with half the subjects starting with the CV‐syllables stimuli, and the other half of the subjects starting with the musical instruments stimuli.
There were 96 trials for each scan, 64 target‐trials and 32 non‐target trials. For half of the 64 target‐trials, the target stimulus appeared in the right ear channel and for the other half of the trials it appeared in the left ear channel. Thus the target stimulus appeared equally often in the right and in the left ear channel. The non‐target and target‐trials were randomly distributed across the 96 trials. There were 96 trials also for the baseline conditions.
PET scanning and image analysis
Positron emission tomography (PET) scans were obtained with an 18 ring GE‐Advance scanner operating in 3D acquisition mode, producing 35 image slices with an interslice distance of 4.25 mm. The total axial field of view was 15.2 cm with an approximate in‐plane resolution of 5 mm. The technical specifications have been described elsewhere (DeGrado, Turkington, Williams, Stearns et al., 1994). Each subject received 12 intravenous “slow bolus” injections of 200 MBq (5.4 mCi) of H2 15O over 15 sec. The study involved a total of 12 scans. The active scans that are reported in the present paper occurred first in the scan sequence. The other scans involved detecting target stimuli among simple tones and passive listening conditions without key‐pressing (which does not control for motor activity confounds).
The interscan interval was 10‐12 min. A 10 min transmission scan was performed for attenuation correction. Head movements were limited by head‐holders constructed by thermally molded foam. Images were reconstructed with an 4.0 mm Hanning filter transaxially and a 8.5 mm Ramp filter axially. The resulting distribution images of time integrated counts were used as indirect measurements of the regional neural activity (Fox & Mintun, 1989). Each scan had a duration of 90 seconds.
Procedure
The subjects were instructed that they would hear two different sounds, one in each ear. Two parameters were manipulated, the stimulus character (CV‐syllables or musical instruments) and the strategy of attention to these stimuli. In the “attend both ears” (divided attention) condition they were instructed that they should be attentive to both ears and press the button whenever they detected the “target” stimulus. In the “attend left ear” (focused attention) condition, they were instructed to focus attention to the left ear, and only press the button when they detected the target in the designated ear. In the “attend right ear” (focused attention) condition, they were instructed to focus attention to the right ear, and only press the button when they detected the target in the designated ear. For each of the three attentional conditions, they were also specifically instructed before each scan whether they should listen to CV‐syllables or musical instruments. The subjects also had a few test‐trials for each condition before the actual stimulus presentation began. Response accuracy data were automatically recorded in the MEL2 software for later analysis of number of correct target hits for each experimental condition.
Before the scanning began, the earphones were put in place in the subjects' ears. Eyepads were placed over the subjects' eyes to eliminate distracting light stimuli. The subject pressed the right or left button of a computer mouse positioned on an armrest to the right of the subject, whenever a target was detected.
Each activation scan started with the listening task followed by an injection after a delay of 10s. Data acquisition was started 25s later, and ended after 90s. A trial began by presenting the target stimulus 10 times with an interstimulus interval (ISI) of 1200 ms, to familiarize the subject with the target stimulus. Following a delay of 5s, 96 dichotic stimulus pairs were then presented.
DATA ANALYSIS
Analysis of variance (ANOVA).
The response accuracy scores were statistically evaluated in an analysis of variance (ANOVA), in a 2 Stimulus (CV‐syllables vs. Musical instruments) × 2 Ear (Left vs. Right) × 3 Attention (“both ears”, “right ear”, “left ear”) factorial design. The design was a complete within‐subjects design, with all subjects measured on all independent variables. Tukey's HSD test was used for post‐hoc follow‐up tests, while the LSD test was used for planned comparisons.
PET image analysis
PET image analysis was performed using Statistical Parametric Mapping software (SPM‐96, Wellcome Department of Cognitive Neurology, London, UK; Friston, 1994). All intra‐subject images were aligned on a voxel‐by‐voxel basis using a 3‐D automated six parameters rigid body transformation (AIR software, Woods et al., 1992), and transformed into the Montreal Neurological Institute (MNI) standard of the Talairach and Tournoux (1988) stereotactic atlas (via Friston, Ashburner, Frith, Poline et al., 1995). Before statistical analysis, the images were filtered with a 16 mm isotropic Gaussian filter to increase the signal to noise ratio and to accommodate residual variability in morphological and topographical anatomy that was not accounted for by the stereotactic normalization process. Differences in global activity were removed by proportional normalization of global brain counts to a value of 50.
Tests of the null hypothesis, which rejects regionally specific condition activation effects in normalized counts (rNC), were performed comparing conditions on a voxel‐by‐voxel basis. The resulting set of voxel values constituted a statistical parametric map of the t statistic, SPM{t}. A transformation of values from the SPM{t} into the unit gaussian distribution using a probability integral transform allowed changes to be reported in Z‐scores (SPM{Z}) (Friston, 1994; Friston, Frith, Liddle, & Frackowiak, 1991). Significantly activated areas were determined based either on the change in a single voxel at a threshold of p < 0.05 (Z > 4.60) after correction for multiple non‐independent comparisons or on the number of contiguous voxels of a given activation cluster above p < 0.01 (Z > 2.33), uncorrected for multiple comparisons (Friston, Worsley, Frackowiak, Mazziotta, & Evans, 1994). The activated areas were then characterized in terms of peak Z‐score and cluster size above this level. When there were specific a priori localizing hypotheses, follow‐up analyses of simple main effects were performed at a significance level of p < .05 (Z > 1.64) uncorrected.
The SPM‐96 analyses involved a number of planned comparisons initially testing the main effect of dividing and focusing attention (“both ears” vs. average of “left ear” and “right ear”), regardless of the character of the stimulus; the main effect of stimulus character (CV‐syllables vs. musical instruments), regardless whether attention was divided or focused; and the interaction effect of stimulus character and attention. This was followed by an analysis of the main effect of direction of attention focusing (“left ”vs. “right ear”), regardless of whether the character of the stimulus; the main effect of stimulus character (CV‐syllables vs. musical instruments), regardless whether attention was divided or focused; and the interaction effect of stimulus character and attention.
Based on previous research with PET on attention, increased rNC counts were expected in the frontal, parietal, and occipital lobes, particularly in the right inferior parietal lobe area, and in the orbitofrontal area (Pardo, Fox, & Raichle, 1991; Cohen, Semple, Gross, King, & Nordahl, 1992; Corbetta, Miezin, Dobmeyer, Shulman, & Petersen, 1990). Cabeza and Nyberg (1997) found in their review of PET studies of cognitive processes that parietal and frontal lobe activation during attention was independent of sensory modality. Moreover, LaBerge and Buchsbaum (1990) found that rCBF activation was higher over contralateral brain areas when the subject focused attention on one side in space. Thus, increased activation were expected in the inferior and superior parietal lobes as an effect of focusing attention to either the left or right ear contrasted with the divided attention condition. In addition, based on the work by O'Leary et al. (1997) on auditory attention, specific activations were expected in the left and right superior temporal gyrus and the adjacent auditory association cortices.
RESULTS
DL response accuracy
There was a significant main effect of Attention, F(2,22) = 4.05, p = 0.031. Follow‐up tests revealed significantly more target hits during the “attend right ear” condition (p < 0.05). The two‐way interaction of stimuli x attention was also significant, F(2,22) = 5.94, p = 0.008, caused by more target hits during the “attend right ear” condition for the CV syllable stimuli, and more target hits during the “attend left ear” condition for the musical instrument stimuli. Also, the two‐way interaction of Stimuli × Ear was significant, F(2,22) = 6.96, p = 0.023, caused by a REA for the CV‐syllable stimuli, and a corresponding (smaller) LEA for the musical instrument stimuli. Finally, the three‐way interaction of Attention × Ear × Stimuli was significant, F(2,22) = 8.07, p = 0.002. The three‐way interaction was followed‐up with tests for simple main‐effects using planned comparisons, contrasting the right versus left ear scores for all combinations of attention x stimuli conditions. These analyses revealed a significant REA (p < 0.05) for the CV‐syllables during the “attend both ears” and “attend right ear” conditions, and a tendency towards significance (p <0.07) for a LEA during the “attend left ear” condition. The corresponding comparisons for the musical instrument stimuli showed a significant LEA during the “attend both ears” condition as the only significant difference (p < 0.05).
PET image analysis
Significant rNC changes are shown in Figures 2‐4 transformed into the MNI‐Talairach and Tournoux (1988) reference system.
Figure 2.
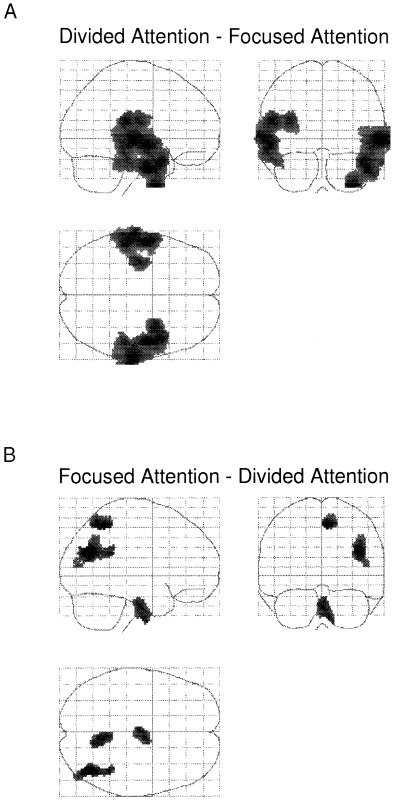
A: Regions activated during the divided attention minus the combined focused attention conditions. B: The lower panel show the reversed subtraction, i.e. the focused attention conditions minus the divided attention condition. The data were transformed to Z‐scores in the SPM‐96 analysis software and projected through sagittal, coronal, and axial views of a transparent brain. The SPM{Z}'s in Figures 2 to 4 are thresholded at p < 0.01, uncorrected, and at a cluster extend threshold of k > 250.
Figure 4.
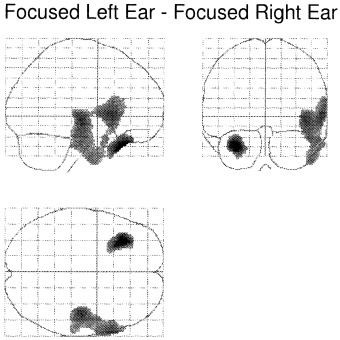
Regions activated during the focused left ear condition minus the focused right ear condition. No significant activations were observed for the reversed subtraction.
For the main effect of dividing minus focusing of attention, significant rNC increases on the cluster level were observed in the superior temporal gyrus in the left hemisphere and in the superior and middle temporal gyri in the right hemisphere. See Table I and Figure 2A.
Table I.
Increases in rNC during divided attention compared to focused attention
| Region | Talairach coordinates at peak activation | Cluster level | Voxel level | ||||
|---|---|---|---|---|---|---|---|
| x | y | z | Size (k) | P‐value | Z‐score | P‐value | |
| Right superior and middle temporal gyrus & | 62 | −20 | 0 | 4627 | <0.001 | 4.28 | 0.18 |
| Right temporal pole | 50 | −2 | −32 | 4.10 | 0.32 | ||
| Left superior and middle temporal gyrus | −56 | −4 | −6 | 3324 | <0.005 | 3.81 | 0.65 |
| Increases in rNC during focused attention compared to divided attention. | |||||||
| Right posterior middle temporal lobe & | 42 | −66 | 28 | 461 | 0.49 | 3.66 | 0.81 |
| Right inferior parietal lobe | 40 | −48 | 24 | 3.01 | 1.00 | ||
| Right precuneus | 8 | −52 | 54 | 276 | 0.86 | 3.49 | 0.94 |
For the reversed comparison (focused attention minus divided attention) neither the voxel nor cluster level showed significant activations. However, activation tendencies were found in the right precuneus in the posterior part of the right superior parietal lobe, the right posterior middle temporal lobe and right inferior parietal lobe. See Table I and Figure 2B.
To explore this finding further we performed analyses of simple main effects by subtracting the “attend both ears” (divided attention) condition from the “attend right” and “attend left” ear (focused attention) conditions, separately for the CV‐syllable and musical instrument conditions at a level of p < 0.05 (Z > 1.64), uncorrected. Predicted activation tendencies were observed in the left and right inferior parietal lobes and in the right precuneus for the CV‐syllables “attend left ear” minus “attend both ears” contrast. For the corresponding “attend right ear” minus “attend both ears” contrast (see also Table II) activation in the right precuneus and left inferior parietal lobe was seen. The same analyses for the musical instrument stimuli yielded activation tendencies in the left and right inferior parietal lobes and in the right precuneus for the “attend left ear” minus “attend both ears” contrast. See also Table II. For the corresponding “attend right ear” minus “attend both ears” contrast, there were no significant activations in the parietal lobe even at this threshold level.
Table II.
Increases in rNC during attention to the presentation of CV‐syllables to the left ear compared to divided attention
| Region | Talairach coordinates at peak activation | Cluster level | Voxel level | ||||
|---|---|---|---|---|---|---|---|
| x | y | z | Size (k) | P‐value | Z‐score | P‐value | |
| Right precuneus | 6 | −56 | 56 | 421 | 0.97 | 3.53 | 0.92 |
| Left inferior parietal lobe | −56 | −52 | 42 | 138 | 1.00 | 2.77 | 1.00 |
| Right inferior parietal lobe | 36 | −46 | 28 | 628 | 0.99 | 2.51 | 1.00 |
| Increases in rNC during attention to the presentation of CV‐syllables to the right ear compared to divided attention. | |||||||
| Right precuneus | 6 | −48 | 54 | 304 | 1.00 | 2.65 | 1.00 |
| Left inferior parietal lobe | −56 | −52 | 42 | 79 | 1.00 | 2.50 | 1.00 |
| Increases in rNC during attention to the presentation of musical instruments to the left ear compared to divided attention. | |||||||
| Left inferior parietal lobe | −38 | −50 | 30 | 440 | 1.00 | 3.16 | 1.00 |
| Right precuneus | 22 | −64 | 54 | 478 | 1.00 | 2.75 | 1.00 |
| Right inferior parietal lobe | 58 | −26 | 36 | 119 | 1.00 | 2.57 | 1.00 |
For the significant main effect of stimulus character, a first analysis involved subtracting the musical stimuli condition from the CV‐syllables condition. This yielded significant activation at almost identical loci in the central sections of the left and right superior and middle temporal gyri, corresponding to the primary auditory cortices. Additionally, the posterior section of the superior temporal lobe was activated, but only on the left side (Table 3). This clear asymmetry effect can be seen in Figure 3A, with the CV‐syllables causing larger activation in the left compared to the right hemisphere.
Table III.
Increases in rNC during analysis of CV‐syllables compared to analysis of musical instruments
| Region | Talairach coordinates at peak activation | Cluster level | Voxel level | ||||
|---|---|---|---|---|---|---|---|
| x | y | z | Size (k) | P‐value | Z‐score | P‐value | |
| Left posterior superior temporal gyrus & | −60 | −34 | 6 | 3636 | <0.001 | 6.55 | <0.001 |
| Left central superior and middle temporal gyri | −60 | −6 | −2 | 6.05 | <0.001 | ||
| Left inferior frontal gyrus | −50 | 22 | −2 | 3.75 | 0.74 | ||
| Left frontal operculum | −56 | 16 | 8 | 3.26 | 1.00 | ||
| Right central superior and middle temporal gyri | 66 | −4 | −2 | 2180 | <0.005 | 6.41 | <0.001 |
| Increases in rNC during analysis of musical instruments compared to analysis of CV‐syllables. | |||||||
| Right cerebellar hemisphere & | 44 | −52 | −18 | 6063 | <0.001 | 4.94 | <0.05 |
| Right posterior insula & | 32 | −42 | 24 | 4.61 | <0.05 | ||
| Right fusiform gyrus & | 28 | −44 | −12 | 3.95 | 0.48 | ||
| Left cerebellar hemisphere & | −22 | −60 | −14 | 3260 | <0.005 | 4.90 | <0.05 |
| Left inferior occipital gyrus | −38 | −90 | 8 | 4.04 | 0.38 | ||
| Left hippocampus | −30 | −38 | 4 | 1417 | <0.05 | 4.03 | 0.39 |
Figure 3.
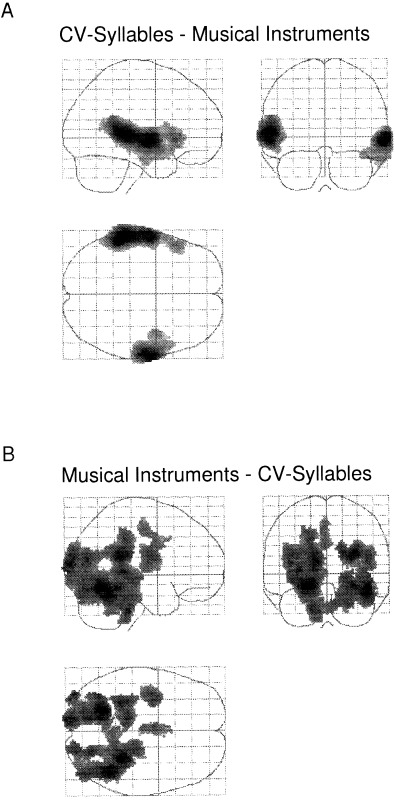
A: Regions activated during the CV‐syllables condition minus the musical instruments condition. B: The lower panel show the reversed subtraction, i.e. the musical instruments condition minus the CV‐syllables condition.
The reversed comparison, (musical instruments minus CV‐syllables) yielded significant activation primarily in the cerebellar hemispheres, left hippocampus and visual association areas (see Table 3 and Fig. 3B). No significant interaction effects were found between factors representing attention (focused or divided) and auditory stimulus character (CV‐syllables or musical instruments).
For the main effect of the direction of attention focusing, the analysis of attending to the left minus right ear stimulus yielded significant activation of the left temporal pole, and in a cluster comprising the right insula, the right inferior frontal gyrus, and the right superior temporal lobe. This is seen in Table IV and Figure 4A.
Table IV.
Increases in rNC during attention to the left ear compared to attention to the right ear
| Region | Talairach coordinates at peak activation | Cluster level | Voxel level | ||||
|---|---|---|---|---|---|---|---|
| x | y | z | Size (k) | P‐value | Z‐score | P‐value | |
| Left temporal pole | −32 | 28 | −30 | 403 | <0.05 | 5.51 | <0.001 |
| Right insula & | 44 | −16 | −6 | 1994 | <0.05 | 4.07 | 0.35 |
| Right inferior frontal gyrus & | 62 | 16 | 4 | 3.88 | 0.56 | ||
| Right superior temporal gyrus | 62 | 0 | 2 | 2.85 | 1.00 | ||
The reversed analysis (attending the right versus left ear) resulted in no significant effects. The main‐effect of stimulus character resulted in activation responses very like what was found in the previous analysis (Table III) but at weaker significance levels. There were no significant interaction effects between the direction of attention to the left or right ear and the stimulus character.
DISCUSSION
The present study has shown that focusing attention to either the left or right ear in a dichotic listening situation also changes patterns of brain activation in areas that previously have been found in studies of attention (Cabeza & Nyberg, 1997 for a review). Activated areas were seen in the right precuneus and in the inferior parietal lobes both as group and simple main effects. Activations were also generally larger over the contralateral parietal lobe, that is, when attention was focused on the left ear activity increased more over the right hemisphere, and vice versa, as seen in the simple main effects.
The present findings are in some respects similar to the findings by Alho, Medvedev, Pakhomov, Roudas, Tervaniemi, Reinikainen et al. (1999) who reported larger leftsided activation when focusing attention to the right ear, and larger rightsided activation when focusing attention to the left ear, in a dichotic tone paradigm. However, while Alho et al. (1999) showed effects of attention mainly in temporal lobe areas, that was not the case in the present study. Other previous studies on the effects of focused attention (O'Leary et al., 1997) to auditory and visual stimuli found increased activation in the auditory areas in a dichotic presentation situation, and widespread activation in the frontal, parietal, and temporal cortices in a visual half‐field presentation situation. O'Leary et al. (1997) also found some evidence for activation of the contralateral hemisphere when focusing attention to the left or right side (see also O'Leary et al., 1996b). In contrast to the present findings, however, O'Leary et al. found effects of attention mainly in the primary sensory areas (cf. Roland, 1982; Alho et al., 1999), while in the presents study activations were also observed in “attention network” areas (cf. Posner & Raichle, 1994) outside of the sensory area. The general design and subtractions were, however, different between the O'Leary et al. (1997) and Roland (1982) studies and the present study. O'Leary et al. (1997) used a “resting baseline” with eyes closed and ears occluded and no condition with divided attention between the ears, while Roland (1982) presented visual and auditory stimuli simultaneously, instructing the subject to focus attention either on the visual or auditory modality. Using a “resting baseline” would enhance the effect of the sensory stimulus also in the focused attention conditions, and shifting attention between sensory modalities requires recruitment of other processing resources than in the present study.
In a series of experiments on visual attention, Corbetta et al. (1990; 1991) found that when subjects selectively attended to certain features of the stimuli (shape, color, etc.), activation increases were found in areas specialized for processing these attended features. The studies by Corbetta et al. illustrate “top‐down” modulation of sensory processing by attention. The present findings extend such “top‐down” modulation also to the auditory modality by showing that selectively monitoring the stimuli in only one ear engages other brain areas than dividing attention between the ears. However, the present results seem to indicate that focused attention also had an “attenuation effect” on brain activation compared with a divided attention situation, particularly in the auditory cortex. Figure 3B illustrates this effect, with no remaining activation in the temporal lobes during focused attention, except for the right posterior middle parts, after subtraction with activity during divided attention.
Attention may actually facilitate processing of the sensory stimulus, with reduced requirements for processing resources when attention is selectively focused on one stimulus. Alternatively, the divided attention situation may be a more difficult task (producing increased activation). The divided attention condition can be regarded as a “dual‐task” situation (Green & Vaid, 1986; Hiscock, 1986) with the left and right ear stimulus input competing for processing resources. Data from behavioral studies of dual‐task performance (e.g. Navon & Goper, 1979) have shown reductions in response efficiency when the subject has to attend to two different stimulus attributes at the same time.
This view is supported by the response accuracy data that showed more accurate responses during the focused attention conditions compared with the divided attention condition. The response accuracy data also revealed significant laterality effects, particularly for the CV‐syllable stimuli (see Fig. 1). A right ear advantage was obtained during the “attend both ears” and “attend right ear” conditions, and a left ear advantage was obtained during the “attend left ear” condition. This basically replicated previous research with the CV‐syllables dichotic listening paradigm (see Hugdahl, 1995 for overview of previous findings). For the musical instrument stimuli, only the left ear advantage during the “attend both ears” condition was significant. The activation data did however not monitor the laterality effects seen in the response accuracy data, with the exception of the comparison of CV‐syllables with musical instruments (Fig. 3A). The CV‐syllables produced larger activation in the left compared with the right temporal lobe, which was also observed in the Hugdahl et al. (1999) study when subtracting activation during simple tone presentation.
Figure 1.
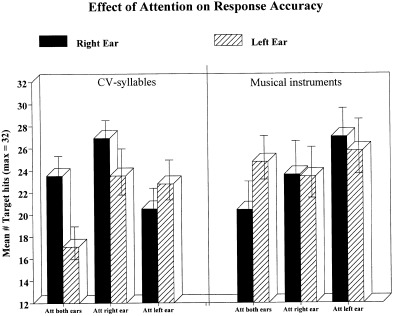
Number of correct target hits during the different stimuli × attention conditions.
In summary, the CV‐syllables caused activation primarily in the superior temporal gyrus and in Broca's area, while the musical stimuli caused a more widespread pattern of activation, primarily in the visual association areas. This latter finding was unexpected and it may have been caused either by increased activation to the musical instrument stimuli or decreased activation to the CV‐syllable stimuli. During the divided attention situation, significant rNC increases were observed bilaterally in the superior temporal gyrus. Focusing attention to the left produced significant activation on the cluster level in the left temporal pole, and in the right insula, right inferior frontal gyrus, and superior gyri areas. There was, however, no corresponding left ear advantage in the accuracy data (see Fig. 1). One reason for this lack of LEA to the musical stimuli in the focussed‐left situation may be that since the “stimulus‐driven” laterality effect is smaller for musical stimuli than for verbal stimuli (Bryden, 1988), this may have caused spontaneous shifts of attention between the ears in this condition. This particular situation may thus have been perceived as confusing for the subjects, forcing shifts of attention between the ears when trying to “solve” the problem. During the focused attention conditions, there were activation tendencies in the inferior parietal cortices, with a tendency towards increased activity in the hemisphere contralateral to the ear where attention was focused. Thus, focusing of attention in the dichotic listening situation significantly decreased activity bilaterally in the temporal lobe compared to the divided attention condition, at the expense of an increased activation in the right superior and inferior parietal lobe. An interpretation of the findings is that attention has a facilitating effect on auditory processing, causing reduced activation in the primary auditory cortex when attention is explicitly recruited.
Footnotes
Two baseline conditions involved listening to binaural presentations of simple tones differing in pitch. The task of the subject was to press a button whenever a tone was heard (no discrimination). These conditions were used as baseline for the dichotic listening conditions reported in the Hugdahl et al. [1999] study (based on the same subjects), and are not reported here, because the focus in the present paper was on comparing focused attention against divided attention.
REFERENCES
- Alho, K. , Medvedev, S.V. , Pakhomov, S.V. , Roudas, M.S. , Tervaniemi, M. , Reinikainen, K. , Zeffiro, T. , & Näätänen, R. 1999. Selective tuning of the left and right auditory corticies during spatially directed attention. Cogn Brain Res 7: 335–341. [DOI] [PubMed] [Google Scholar]
- Asbjørnsen, A. , & Bryden, M.P. 1998. Auditory attentional shifts in reading‐disabled students: quantification of attentional effectiveness by the Attentional Shift Index. Neuropsychologia 36: 143–148. [DOI] [PubMed] [Google Scholar]
- Asbjørnsen, A. , & Hugdahl, K. 1995. Attentional effects in dichotic listening. Brain Lang 49: 189‐201. [DOI] [PubMed] [Google Scholar]
- Brodal A., Ed. 1981. Neurological anatomy in relation to clinical medicine. 3rd edition New York: Oxford University Press. [Google Scholar]
- Bruder, G.E. 1988. Dichotic listening in psychiatric patients In Hugdahl K. (Ed.), Handbook of dichotic listening: Theory, methods, and research. Chichester, UK: Wiley & Sons, p 527–564. [Google Scholar]
- Bryden, M.P. 1988. An overview of the dichotic listening procedure and its relation to cerebral organization In Hugdahl K. (Ed.), Handbook of dichotic listening: Theory, methods, and research. Chichester, UK: Wiley & Sons, p 1–44. [Google Scholar]
- Bryden, M.P. , Munhall, K. , & Allard, F. 1983. Attentional biases and the right‐ear effect in dichotic listening. Brain Lang, 18: 236–248. [DOI] [PubMed] [Google Scholar]
- Cabeza, R. , & Nyberg, L. 1997. Imaging cognition: An empirical review of PET studies with normal subjects. J Cogn Neurosci 9: 1–26. [DOI] [PubMed] [Google Scholar]
- Cohen, R.M. , Semple, W.E. , Gross, M. , King, A.C. , & Nordahl T.E.. 1992. Metabolic brain pattern of sustained auditory discrimination. Exp Brain Res 92: 165–172. [DOI] [PubMed] [Google Scholar]
- Corbetta, M. , Miezin, F.M. , Dobmeyer, S. , Schulman, G.L. , & Pteresen, S. E. 1990. Attentional modulation of neural processing of shape, color, and velocity in humans. Science 248: 1556–1559. [DOI] [PubMed] [Google Scholar]
- Corbetta, M. , Miezin, F.M. , Dobmeyer, S. , Schulman, G.L. , & Pteresen, S. E. 1991. Selective and divided attention during visual discrimination of shape, color, and speed: Functional anatomy by positron emission tomography. J Neurosci 11: 2383–2402. [DOI] [PMC free article] [PubMed] [Google Scholar]
- DeGrado, T.R. , Turkington, T.G. , Williams, J.J. , Stearns, C.W. , Hoffman, J.M. , & Coleman, R.E. 1994. Performance characteristics of a whole‐body PET scanner. J Nucl Med 35: 1398–1406. [PubMed] [Google Scholar]
- Eslinger, P.J. , & Damasio, H. 1988. Anatomical correlates of paradoxic ear extinction In Hugdahl K. (Ed.), Handbook of dichotic listening: Theory, methods, and research. Chichester, UK: Wiley & Sons, p 139–160. [Google Scholar]
- Fox, P.T. , & Mintun, M. 1989. Noninvasive functional brain mapping by change‐distribution analysis of averaged PET images of H2 O‐15 tissue activity. J Nuc Med 30: 141–149. [PubMed] [Google Scholar]
- Friston, K. 1994. Statistical parametric mapping In Thatcher R.W., Hallett M., Zeffiro T., John E. Roy. & Huerta M., Eds. Functional neuroimaging: Technical foundations. San Diego: Academic Press, p 79–93. [Google Scholar]
- Friston, K.J. , Frith, C.D. , Liddle, P.F. , & Frackowiak, R.S.J. 1991. Comparing functional (PET) images: The assessment of significant change. J Cer Meth 11: 690–699. [DOI] [PubMed] [Google Scholar]
- Friston, K.J. , Holmes, A. , Worsley, K.J. , Poline, J. , Frith, C.D. , & Frackowiak, R.S.J. 1995. Statistical parametric maps in functional imaging: A general linear approach. Hum Brain Mapp 2: 189–210. [Google Scholar]
- Green, A. & Vaid, J. 1986. Methodological issues in the use of concurrent activities paradigm. Brain Cogn 5: 465–476. [DOI] [PubMed] [Google Scholar]
- Green, M.F. , Hugdahl, K. , & Mitchell, S. 1994. Dichotic listening during auditory hallucinations in schizophrenia. Am J Psychiat 151: 357–362. [DOI] [PubMed] [Google Scholar]
- Grote, C.L. , Pierre‐Lous, S.J.C. , Smith, M.C. , Roberts, R.R. , & Varney, N.R. 1995. Significance of unilateral ear extinction on the dichotic listening test. Journal of Clinical and Experimental Neuropsychol 17: 1–8. [DOI] [PubMed] [Google Scholar]
- Friston, K. J. , Worsley, K.J. , Frackowiak, R. , Maziotta, J. C. , & Evans, A.C. 1994. Assessing the significance of focal activations using their spatial extent. Hum Brain Mapp 1: 210–220. [DOI] [PubMed] [Google Scholar]
- Hiscock, M. 1986. Lateral eye movements and dual‐task performance In Hannay H.J. (Ed.). Experimental techniques in human neuropsychology, New York: Grune & Stratton, p 264–308. [Google Scholar]
- Hugdahl, K. (1995). Dichotic listening: Probing temporal lobe functional integrity In Davidson R.J. & Hugdahl K. (Eds.), Brain asymmetry. Cambridge MA: MIT Press, p 123–156. [Google Scholar]
- Hugdahl K. Ed. 1988. Handbook of dichotic listening. Theory, Methods, and Research. Chichester, UK: John Wiley & Sons. [Google Scholar]
- Hugdahl, K. , & Andersson, L. 1986. The “forced‐attention paradigm” in dichotic listening to CV‐syllables: A comparison between adults and children. Cortex 22: 417–432. [DOI] [PubMed] [Google Scholar]
- Hugdahl, K. , & Hammar, Ā. 1997. Test‐retest reliability of the consonant‐vowel syllables dichotic listening paradigm. Journal of Clinical and Experimental Neuropsychol 19: 667–675. [DOI] [PubMed] [Google Scholar]
- Hugdahl, K. , & Wester, K. 1992. Dichotic listening studies of brain asymmetry in brain damaged patients. I J Neurosci 63: 17–29. [DOI] [PubMed] [Google Scholar]
- Hugdahl, K. , Brønnick, K. , Kyllingsbæk, S. , Law, I. , Gade, A. , & Paulson, O.B. 1999. Brain activation during dichotic presentations of consonant‐vowel and musical instrument stimuli: a 15O‐PET study. Neuropsychologia 38: 431–440. [DOI] [PubMed] [Google Scholar]
- Hugdahl, K. , Carlsson, G. , Uvebrant, P. , & Lundervold, A.J. 1997. Dichotic listening performance and intracarotid amobarbital injections in children/adolescent: Comparisons pre‐ and post‐operatively. Archives of Neurol 54: 1494–1500. [DOI] [PubMed] [Google Scholar]
- Kimura, D. 1961. Cerebral dominance and the perception of verbal stimuli. C J Psychol 15: 166–171. [Google Scholar]
- Kimura, D. 1967. Functional asymmetry of the brain in dichotic listening. Cortex 3: 163–168. [Google Scholar]
- LaBerge, D. , & Buchsbaum, M.S. 1990. Positron emission tomographic measurements of pulvinar activity during an attention task. J Neurosci 10: 613–619. [DOI] [PMC free article] [PubMed] [Google Scholar]
- Lee, G.P. , Loring, D.W. , Varney, N.R. , Roberts, R.J. , Newell, J.R. , Martin, J.A. , Smith, J.R. , King, D.W. , Meador, K.J. , & Murro, A.M. 1994. Do dichotic word listening asymmetries predict side of temporal lobe seizure onset? Epilepsy Res 19: 153–160. [DOI] [PubMed] [Google Scholar]
- Mondor, T.A. , & Bryden, M.P. 1991. The influence of attention on the dichotic REA. Neuropsychologia 29: 1179–1190. [DOI] [PubMed] [Google Scholar]
- Navon, D. , & Goper, D. 1979. On the economy of the human information‐processing system. Psychol Review 86: 214–255. [Google Scholar]
- Oldfield, R.C. 1971. The assessment and analysis of handedness. The Edinburgh inventory. Neuropsychologia 9: 97–113. [DOI] [PubMed] [Google Scholar]
- O'Leary, D. , Andreasen, N.C. , Hurtig, R.R. , Hichawa, R.D. , Watkins, L. , Boles Ponto, L.L. , Rogers, M. , & Kirchner, P.T. 1996. A positron emission tomography study of binaurally and dichotically presented stimuli: Effects of level of language and directed attention. Brain Lang 50: 20–39. [DOI] [PubMed] [Google Scholar]
- O'Leary, D. , Andreasen, N.C. , Hurtig, R.R. , Kesler, M.L. , Rogers, M. , Arndt, S. , Cizadlo, T. , Watkins, G.L. , Boles Ponto, L.L. , Kirchner, P.T. , & Hichawa, R.D. 1996. Auditory attentional deficits in patients with schizophrenia. Archives Gen Psychiat 53: 633–641. [DOI] [PubMed] [Google Scholar]
- O'Leary, D. , Andreasen, N.C. , Hurtig, R.R. , Torres, I.J. , Flashman, L.A. , Kesler, M.L. , Arndt, S.V. , Cizadlo, T.J. , Ponto, L.L.B. , Watkins, G.L. , & Hichawa, R.D. 1997. Auditory and visual attention assessed with PET. Hum Brain Mapp 5: 422–436. [DOI] [PubMed] [Google Scholar]
- Pardo, J.V. , Fox, P.T. , & Raichle, M.E. 1991. Localization of a human system for sustained attention by positron emission tomography. Nature 349: 61–65. [DOI] [PubMed] [Google Scholar]
- Posner M.I. & Raichle M.E., Eds. 1994. Images of mind. New York: Scientific American Library. [Google Scholar]
- Roland, P.E. 1982. Cortical regulation of selective attention in man. A regional cerebral blood flow study. J Neurophysiol 48: 1959–1078. [DOI] [PubMed] [Google Scholar]
- Schneider W., Rodgers K., Maciejcyk V.K., Zuccolotto A., & St.James J., Eds. 1995. MEL Professional: Users guide. Pittsburgh, PA: Psychology Software Tools Inc. [Google Scholar]
- Sparks, R. , & Geschwind, N. 1968. Dichotic listening in man after section of neocortical commissures. Cortex 4: 3–16. [Google Scholar]
- Talairach J. & Tournoux P. Eds. 1988. Co‐planar stereotaxic atlas of the human brain. 3‐D proportional system: An approach to cerebral imaging. Stuttgart: and New York: Georg Thieme Verlag. [Google Scholar]
- Wada, J. , & Rasmussen, T. 1960. intracarotid injections of sodium amytal for the lateralization of cerebral speech dominance. J Neurosurg 17: 266–282. [DOI] [PubMed] [Google Scholar]
- Wexler, B.E. 1986. Alterations in cerebral laterality during acute psychotic illness. B J Psychiat 149: 202–209. [DOI] [PubMed] [Google Scholar]
- Wexler, B.E. , Giller, E.L. , & Southwick, S. 1991. Cerebral laterality, symptoms, and diagnosis in psychotic patients. Biol Psychiat 29: 103–116. [DOI] [PubMed] [Google Scholar]
- Woods, R.P. , Cherry, S.R. , & Mazziotta, J.C. 1992. Rapid automated algorithm for alligning and resclining PET images. J Comp Ass Tom 16: 620–633. [DOI] [PubMed] [Google Scholar]
- Zatorre, R.J. 1989. Perceptual asymmetry on the dichotic fused words test and cerebral speech lateralization determined by the carotid sodium amytal test. Neuropsychologia 27: 1207–1219. [DOI] [PubMed] [Google Scholar]