

Abstract
Structural or operational synchrony analysis with EEG was conducted in order to detect functional interaction between cortical areas during an enhanced inhibition induced by the GABAergic agonist lorazepam in a double‐blind, randomized, placebo‐controlled, cross‐over study in eight healthy human subjects. Specifically, we investigated whether a neuronal inhibitory system in the brain mediates functional decoupling of cortical areas. Single‐dose lorazepam administration resulted in a widespread increase in the inter‐area functional connectivity and an increase in the strength of functional long‐range and interhemispheric connections. These results suggest that inhibition can be an efficient mechanism for synchronization of large neuronal populations. Hum. Brain Mapping 22:29–41, 2004. © 2004 Wiley‐Liss, Inc.
Keywords: GABA‐inhibition, neuronal populations, structural synchrony, brain operations, temporal binding, EEG segments, lorazepam, integration, epilepsy
INTRODUCTION
The concept of large‐scale cortical networks, wherein elementary operations are localized in discrete cortical and subcortical regions but complex functions involve synchronous processing in a widespread network, is highly promising in modern neuronal theories of cognition [for reviews, see Bressler and Kelso, 2001; Engel et al., 2001; Nunez, 1995, 2000].
Traditionally, approaches explicitly utilizing the temporal binding mechanism [for a review see von der Malsburg, 1999] have been based on the assumption that the binding of neurons within neuronal populations and/or distant neuronal populations into a single composite whole (or spatial‐temporal pattern) is achieved through the combined action of excitatory connections [Acker, 2000; von der Malsburg, 1999]. This is probably motivated by the fact that in many areas of the cortex, there are about four times more excitatory than inhibitory neurons [Braitenberg and Schuz, 1998]. At the same time, it has been suggested that suppression of “unuseful” (activity irrelevant) neuronal populations and/or separate neurons is accomplished by inhibitory connections [Nunez, 2000; von der Malsburg, 1999], thus resulting in a large‐scale asynchrony between relevant and irrelevant neuronal populations [Chen et al., 2000]. This has been supported by modeling studies [Acker, 2000; Burkitt and Clark, 2000; Kudela et al., 1999; Skinner et al., 1994].
Although to date there is no consensus about this issue, such understanding is widely accepted. However, cortical large‐scale functional interactions during inhibition have not been explicitly investigated. Thus, the role of inhibitory connections in the temporal binding of neuronal populations within large‐scale network remains to be assessed experimentally.
In the present EEG study, structural or operational synchrony analysis [Fingelkurts and Fingelkurts, 2001; Kaplan et al., 1997; Kaplan and Shishkin, 2000] (see Materials and Methods) was conducted in order to detect functional interaction between cortical areas during enhanced inhibition induced by single‐dose lorazepam, which is a GABA agonist [Volkow et al., 1993]. High structural synchrony between EEG signals recorded from different sites on the scalp may hint at an increased functional interplay between the underlying neuronal populations [Fingelkurts and Fingelkurts, 2001; Kaplan and Shishkin, 2000]. The effects of lorazepam on EEG are well documented and result particularly in a decrease of alpha and increase of beta activity [Link et al., 1991]. Lorazepam is a benzodiazepine; it facilitates GABAergic neurotransmission by potentiating GABA‐induced chloride flux at the GABAA‐benzodiazepine receptor complex [Villar et al., 1990]. This facilitation results in the inhibition of brain cognitive functions [Di Lazzaro et al., 2000].
Thus, by using lorazepam, one can observe the consequences of inhibition on the EEG structural synchrony between different cortical areas. We investigated whether the inhibitory system would indeed be responsible for functional or operational decoupling between cortical areas, hypothesizing that inhibition would weaken or even impair cortical functional connections. Functional connections/interactions refer, in a general sense, to influences that different elements in the nervous system have on each other. The term “elements” refers to any constituent of the nervous system, either a single neuron or neuronal populations thereof [for a discussion see McIntosh, 1999].
SUBJECTS AND METHODS
Subjects
Eight non‐smoking healthy human subjects (4 males, 4 females, ages from 20 to 29 years, all right‐handed) participated in the study. They gave informed written consent; institutional ethical committee approval was obtained. Before inclusion, the subjects underwent a medical examination and laboratory tests of blood to exclude physical or mental health problems. They were also screened for psychological disorders by SCL‐90 [Derogatis et al., 1973]; their reported alcohol consumption was maximally five drinks/week. The subjects reported having used no medication during the 2 weeks prior to the study. A catheter was placed in the right antecubital vein for drug injection. Subjects underwent either single‐dose lorazepam (Ativan® 4 mg/ml, Wyeth Lederle) 30 μg/kg or placebo (saline) injection in a randomized, double‐blind, cross‐over design study. The EEG recording was started 5 min after the infusion. All experimental sessions were carried out between 08:00 h and noon; successive two sessions (lorazepam or placebo) were separated by one week.
EEG Registration
Subjects underwent EEG registration with eyes closed for 5 min and eyes open for another 5 min, the order of these conditions being counterbalanced across subjects. All recordings were performed in an electrically and magnetically shielded room (Euroshield, Eura, Finland) in the BioMag Laboratory, Helsinki University Central Hospital. Electric spontaneous brain activity was recorded with a 60‐channel EEG data acquisition system (Neuromag Vectorview, Helsinki, Finland) with a frequency band of 0.06 to 86 Hz (sampling rate 300 Hz).
EEG was recorded with an electrode cap according to the extended International 10/20 system; the nose electrode was used as reference. The impedance of the recording electrodes was always below 5 kΩ. Vertical and horizontal electro‐oculograms were recorded. Epochs containing artifacts due to eye blinks, significant muscle activity, or movements were automatically rejected. The presence of an adequate signal was determined by visually checking each raw signal on the computer screen after automatic artifact rejection.
Data Processing
The EEG data were split into 4 distinct groups: lorazepam‐closed‐eyes, lorazepam‐open‐eyes, placebo‐closed‐eyes, and placebo‐open‐eyes. Data were processed separately for each 1‐min portion of the signal from 20 EEG electrodes (F7/8, Fz, F3/4, T3/4, C5/6, Cz, C3/4, T5/6, Pz, P3/4, Oz, O1/2) after the sampling rate had been converted to128 Hz. As in the previous work [Fingelkurts et al., 2003a, b], this conversion was done by means of linear interpolation.
Prior to the nonparametric adaptive segmentation procedure, each EEG signal was bandpass filtered (Butterworth filter of sixth order) in the alpha (7–13 Hz) and beta (15–21 Hz) frequency bands. Phase shifts were eliminated by forward and backward filtering. These frequency bands were chosen because it has been well documented that benzodiazepines significantly increase power in the fast (14–21 Hz) wavebands whilst reduce power in the mid range (7–13 Hz) [see Link et al., 1991; Mandema et al., 1992].
Adaptive Level EEG Segmentation
It has been suggested that an observed nonstationary process like an EEG can be seen as being “glued” from several strictly stationary segments [Brodsky et al., 1999; Fell et al., 2000; Kaplan and Shishkin, 2000]. It is assumed that these segments measured by EEG may be a reflection of the discrete operations of the brain [for a review, see Fingelkurts and Fingelkurts, 2001, 2003]. The aim of the segmentation was to divide the EEG‐signal into stationary segments by estimating such intrinsic points of “gluing.” These instants within short‐time window when EEG amplitude significantly and abruptly changed were identified as rapid transition processes (RTP) [Fingelkurts and Fingelkurts, 2001; Kaplan et al., 1997] (see also Appendix A for details).
The method of RTPs identification (algorithm SECTION1.0® has been suggested by Prof. Kaplan, Human Brain Research Group, Moscow State University) is based on the automatic selection of level‐conditions in accordance with a given level of the probability of “false alerts” and carrying out simultaneous screening of all EEG channels [for a review, see Fingelkurts and Fingelkurts, 2001]. In order to estimate RTPs, comparisons were made between the ongoing EEG amplitude absolute values averaged in the test window (6 points = 39 msec) and the EEG amplitude absolute values averaged in the level window (120 points = 930 msec). These values yielded the best results in revealing segments within the signal [according to previous studies, Borisov, 2002; Fingelkurts, 1998]. The decision to use short time windows was based on the need to track non‐stationary transient cortical processes on a sub‐second time scale. If the absolute maximum of the averaged amplitude values in the test window was less or equal to the averaged amplitude values in the level window, then the hypothesis of EEG homogeneity was accepted. Otherwise, if the absolute maximum of the averaged amplitude values in the test window exceeds the averaged amplitude values in the level window, according to the threshold of the false alerts (the Student criteria, P < 0.05 with coefficient 0.3), its time instant becomes the preliminary estimate of an RTP. Also another condition must be fulfilled in order to eliminate the “false alerts” associated with possible anomalous peaks in the amplitude. The five points of the digitized EEG following this preliminary RTP must have a statistically significant difference between averaged amplitude values in the test and the level windows (the Student criteria, P < 0.05 with coefficient 0.1). If these two criteria are met, then the preliminary RTP are assumed as actual. Then each of the windows shifts on one data‐point from the actual RTP and the procedure is repeated. With this technique, the sequence of RTPs with statistically proven (P < 0.05, Student t‐test) time coordinates has been determined for each EEG channel individually for each 1‐min epoch (Fig. 1). The details of methodology and theoretical concepts are described elsewhere [Fingelkurts and Fingelkurts, 2001; Kaplan and Shishkin, 2000] (see also Appendix A). By varying the parameters of this technique, it is possible to obtain the segments corresponding to a more or less detailed structure of the EEG [Kaplan, 1998]. Therefore, there are prospects for the description of the structural EEG organization as a hierarchy of segmental descriptions on different time scales [Kaplan and Shishkin, 2000].
Figure 1.
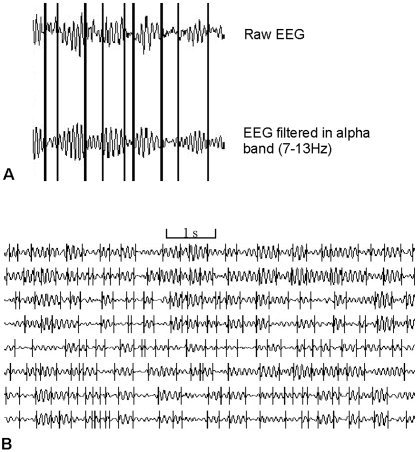
Typical example of EEG channels with automatically detected rapid transitional processes (RTP). Note that the lengths of RTPs are so brief that they appear to have almost zero duration in the figure (shown as vertical lines). A: Raw and alpha band‐filtered data. B: Example of 8 EEG channels filtered in alpha frequency band. It can be seen that some RTPs in different EEG channels appeared temporally close.
Calculation of Structural Synchrony Index
The index of structural synchrony (ISS) was estimated through synchronization of rapid transition processes (RTP) between different EEG channels. This measure (algorithm JUMPSYN1.0® has been suggested by Prof. Kaplan, Human Brain Research Group, Moscow State University) reveals functional (operational) interrelationships between cortical sites different from those measured by correlation, coherence, and phase analysis [Kaplan and Shishkin, 2000] (see also Appendix B). Each RTP in the reference EEG channel (the channel with the minimal number of RTPs from any pair of EEG channels) was surrounded by a “window” (from −3 to +4 digitizing points on each side of the RTP point) of 55 msec. It was taken that any RTP from another (test) channel coincided if it fell within this window. The window of 55 msec provides 70–80% of all RTP synchronizations [Borisov, 2002; Fingelkurts, 1998]. The index of structural synchrony (ISS) for pairs of EEG channels was estimated using this procedure. The ISS was computed as follows:
sn w—total number of RTPs in all windows (window for synchronization, 55 ms each) in the test channel;
sl w—total length of EEG recording (in data points) inside all windows in the test channel;
sn r—total number of RTPs outside the windows (window for synchronization, 55 ms each) in the test channel;
sl r—total length of EEG recording (in data points) outside the windows in the test channel.
However, it is obvious that even in the absence of any functional cortical interregional cooperation there should be a certain stochastic level of RTPs coupling, which would reflect merely occasional combinations. The values of such stochastic inter‐area relations should be uniform and substantially lower than in the actual presence of functional interrelation between areas of EEG channels. Thus, to arrive at a direct estimation of a 5% level of statistical significance of the ISS (P < 0.05), computer simulation of RTPs synchronization was undertaken based on random shuffling of time segments marked by RTPs (500 independent trials). These share the properties of the experimental data (number of RTPs in each EEG channel of analyzed pair, number of segments, and number of windows of synchronization), but the time coordinates of RTPs were altered randomly in each trial so as to destroy the natural temporal structure of the data. Generally, repeated random reshuffling of the observed data may lead to a whitening phenomenon [Bullmore et al., 2001]. However, in the present case this is unlikely due to the following facts. The correlation between consecutive time segments marked by RTPs in the raw time series is generally small even if the EEG signal itself is highly autocorrelated in time. Moreover, validation of the stochastic level of RTPs coupling was done on so‐called “surrogate” EEGs in which a mixing of actual EEG channels was done in such a way that each channel was recorded in a different time, so that the natural time relations between channels in such multichannel EEG were completely destroyed. However, the number and the sequence of segments within each channel remained the same as in the actual EEG. The values for stochastic level of RTPs coupling were almost the same in both procedures and were equal to zero. Thus, the approach we used is justified. However, other approaches are also possible [see for example Bullmore et al., 2001].
As a result of 500 times repeated random reshuffling of the time segments marked by RTPs, the stochastic level of RTPs coupling (ISSstoh), and the upper and lower thresholds of ISSstoh significance (5%) were calculated. These values represent an estimation of the maximum (by module) possible stochastic rate of RTPs coupling (confidence levels). Thus, only those values of ISS that exceeded the upper (active coupling) and lower (active decoupling) thresholds of ISSstoh have been assumed to be statistically valid (P < 0.05). Thus, the ISS tends towards zero where there is no synchronization between the EEG segments and has positive or negative values where such synchronization exists. Positive values indicate “active” coupling of EEG segments (synchronization of EEG segments were observed significantly more often than expected by chance), whereas negative values mark “active” decoupling of segments (synchronization of EEG segments were observed significantly less than expected by chance; see Fig. 2). From a qualitative perspective, the (de)coupling of EEG segments corresponds to the phenomenon of synchronization of brain operations or Operational Synchrony (OS) [Fingelkurts and Fingelkurts, 2003].
Figure 2.
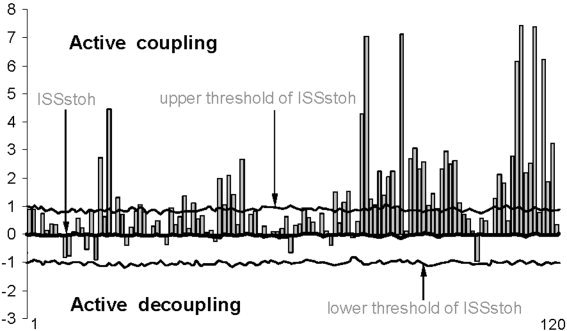
Schematic illustration of index of structural synchrony (ISS) and its stochastic levels. As an example, the calculations of ISS are shown for 16 EEG channels. The y‐axis displays the ISS values found in the experiment (illustrated as gray bars). The x‐axis displays the 120 possible pair combinations of 16 EEG channels (1 = O1–O2, 2 = O1‐–P3, 3 = O1–P4, 4 = O1–T5, … 115 = F4–Fz, 116 = F4–F7, 117 = F4–F8, 118 = Fz–F7, 119 = Fz–F8, 120 = F7–F8).
The differences in the number of structurally synchronized (SS) EEG patterns between lorazepam and placebo conditions were assessed using the paired Wilcoxon t‐test as in the majority of coherence studies [for an overview, see Rappelsberger, 1998; Weiss and Rappelsberger, 2000]. All SS pair EEG patterns were divided into nine categories (shortleft/right, shortanterior/posterior, longleft/right, longanterior/posterior, longinterhemispheric) separately for alpha and beta frequency bands. Pairs of EEG electrodes that have one or more electrodes between the “members” of the pair were classified as long‐range connections [according to Weiss and Rappelsberger, 2000]. Since the absolute number of possible SS EEG pairs within each category was different, the percentage of the number of SS EEG pairs was calculated.
Although it is sometimes claimed that EEG is a distorted copy of the cortical potential distribution due to the poor conductivity of the skull, we have shown through modeling experiments that the values of the ISS are sensitive to the morpho‐functional organization of a cortex rather than to the volume conduction [Fingelkurts, 1998; Kaplan et al., 2000] (see also Appendix B). In fact, all techniques for EEG transformation have their particular merits and limitations, and no agreement on a preferred solution is established at present [Hagemann et al., 2001]. However, the ISS measure can accurately reflect local and global cortical functioning, and may change even though the average power within the filtered EEG remains approximately constant [Fingelkurts et al., 2003b; Kaplan and Shishkin, 2000].
RESULTS
The Number of Structurally Synchronized EEG Pairs
The number of structurally synchronized (SS) EEGs registered from different cortical areas (estimated by an index of structural synchrony, ISS) during single dose lorazepam and placebo conditions is presented in Figure 3.
Figure 3.
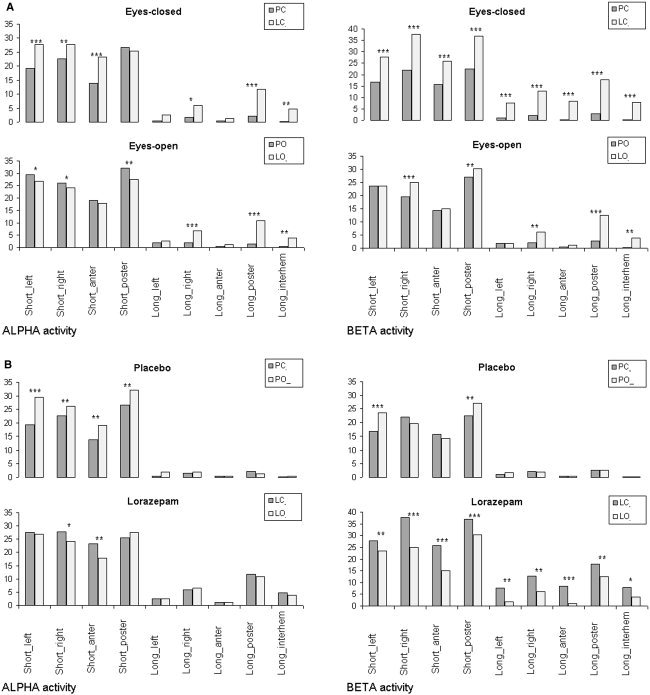
a: The number of structurally synchronized (SS) EEG pairs (indexed by the index of structural synchrony) during lorazepam and placebo for eyes‐closed (top row) and eyes‐open (bottom row) conditions separately for alpha and beta frequency bands. The x‐axis displays the labels of the categories for EEG pair connections. The y‐axis displays the percentage from the maximum number of the EEG pair connections within each category. *P < 0.05, **P < 0.01, ***P < 0.001. PC, placebo–eyes closed; LC, lorazepam–eyes closed; PO, placebo–eyes open; LO, lorazepam–eyes open. b: The number of structurally synchronized (SS) EEG pairs (indexed by the index of structural synchrony) during eyes‐open and eyes‐closed conditions for placebo (top row) and lorazepam (bottom row) separately for alpha and beta frequency bands. Construction of b is the same as for a.
Figure 3a illustrates that the number of SS EEG pairs was significantly larger (P < 0.05–0.001 for different categories) during lorazepam than during placebo administration in the eyes‐closed condition. This was the case for almost all SS EEG pair categories. The largest number of SS pairs during lorazepam (P < 0.001) was observed for the beta frequency band (Fig. 3a). The eyes‐open condition was also characterized by an increased number of SS EEG pairs during lorazepam when compared with placebo; however, it was significant mostly for long‐range SS pairs (P < 0.05–0.001 for different categories). It is worth noting that in the eyes‐open condition for the alpha frequency band, the number of SS for short EEG pairs was significantly higher (P < 0.05–0.01) in the placebo than in the lorazepam associated data (Fig. 3a).
When we consider lorazepam and placebo separately and focus on the functional shift from the eyes‐closed to the eyes‐open state, then the opening of the eyes resulted in different influences on the number of SS EEG pairs during lorazepam and placebo (Fig. 3b). Thus, opening of the eyes during the placebo leads to an increase of the number of SS EEG pairs in all short categories (P < 0.01–0.001) for the alpha frequency band and in shortleft and shortposterior categories (P < 0.01–0.001) for the beta frequency band (Fig. 3b).
Lorazepam, in contrast to placebo, decreased the number of SS EEG pairs (P < 0.05–0.001) during the eyes‐open condition when compared with the eyes‐closed condition. This process was observed mostly in the beta frequency band (Fig. 3b).
The Strength of the Structurally Synchronized EEG Pairs
The strength of the structurally synchronized EEG pairs can be estimated by the values of the index of structural synchrony (ISS): the higher this value, the lager the strength. Figure 4 illustrates the average values of ISS for the nine SS EEG pair categories (see previous section) in lorazepam and placebo conditions separately for alpha and beta EEG frequency bands.
Figure 4.
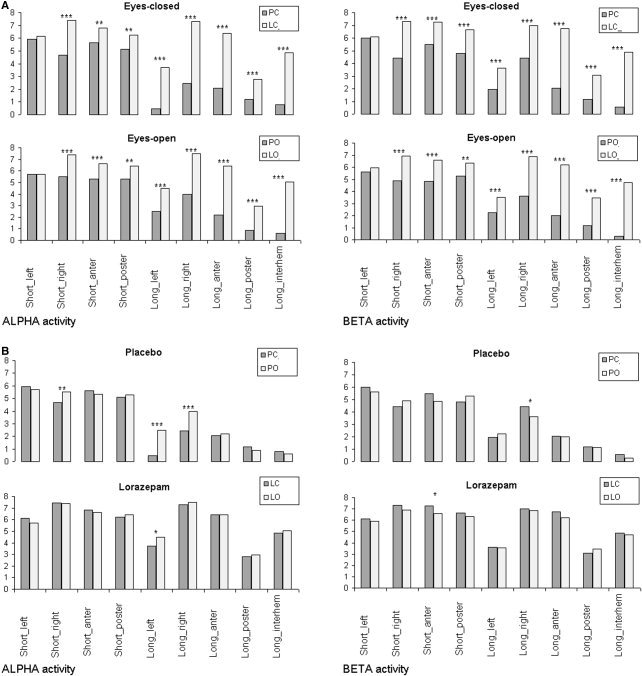
a: The strength of EEG structural synchrony (indexed by the index of structural synchrony ‐ ISS) for each of the nine categories for lorazepam and placebo for eyes‐closed (top row) and eyes‐open (bottom row) conditions separately for alpha and beta frequency bands. The x‐axis displays the labels of the categories for EEG pair connections. The y‐axis displays the average values of ISS for EEG pair connections within each category. *P < 0.05, **P < 0.01, ***P < 0.001. PC, placebo‐eyes‐closed; LC, lorazepam‐eyes‐closed; PO, placebo‐eyes‐open; LO, lorazepam‐eyes‐open. b: The strength of EEG structural synchrony (indexed by the index of structural synchrony) for each of the nine categories for open and closed eyes for placebo (top row) and lorazepam (bottom row) separately for alpha and beta frequency bands. Construction of b is the same as for a.
The ISS values were significantly higher during lorazepam than during placebo intake for all categories (P < 0.01–0.001) except shortleft category. This dependence was observed for both frequency bands both in the eyes‐open and in the eyes‐closed conditions (Fig. 4a). However, the opening of the eyes resulted in inconsistent and in most cases insignificant influences during placebo and lorazepam conditions (Fig. 4b).
During placebo eyes‐open condition, the ISS values were significantly higher than during eyes‐closed condition for shortright (P < 0.01) and longleft/right (P < 0.001) categories within the alpha frequency band. Changes in the beta band were not systematic. Lorazepam was characterized by a decreasing tendency of the ISS values; however, a significant decrease of the ISS value (P < 0.05) was observed only for shortanterior category and only for the beta frequency band (Fig. 4b).
DISCUSSION
We expected to find a decreased number of structurally synchronized (SS) EEG pairs or even negative values of the index of structural synchrony (ISS) under the inhibition by lorazepam, since inhibition is considered to be a rigid service system that does not take part in functional network coupling [von der Malsburg, 1998]. Earlier negative ISS values between some cortical areas were found systematically when subjects failed to perform cognitive tasks [Fingelkurts, 1998] or in the subjects who are in a state that suggests a lack of the multi‐sensory integration processes [Fingelkurts et al., 2003a]. However, in the present study we have provided evidence that single‐dose lorazepam administration results in a widespread significant increase in the inter‐area functional connectivity and also in a significant increase in the strength of such functional long‐range and inter‐hemispheric connections. These findings are not so unusual if one considers the behavioral consequences of lorazepam, which induces sedation, sleepiness, and significantly affects cognitive performance [Volkow et al., 1995]. Most likely, both specific synaptic and diffuse extrasynaptic GABAA receptors mediate these processes. Typically, extrasynaptic receptors have comparatively high affinity for GABA and can simultaneously change the activity of the many neuronal populations [Semyanov, 2003]. Notably, results of coherence analysis on different models are in accordance with the present data. It has been shown that states of minimal cognitive processing often exhibit widespread spatially coherent EEG [Nunez, 2000] that is most likely associated with a dominating cortex global dynamics [Nunez, 1995]. Correspondingly, an increase of coherence values has been observed also during non‐REM sleep and drowsiness [Bullock et al., 1995], during the sub‐anesthetic concentrations of halothane [Nunez, 1995] and during meditation, which was accompanied by anxiety decrease [Aftanas and Golocheikine, 2001]. However, total increase in the inter‐area EEG SS obtained in the present study differs in one fundamental respect from increase of the inter‐area EEG SS, which has been observed together with cognitive loading in previous works [Fingelkurts and Fingelkurts, 2001; Fingelkurts et al., 2003b; Kaplan and Shishkin, 2000]. During different cognitive tasks, the EEG SS process is expressed in gradual increase in functional binding between specific cortical areas, rather than in the whole cortex [see also Fingelkurts et al., 2000, 2003b; Kaplan et al., 1997].
Also in the present study, we showed that all SS EEG pairs had positive ISS values, indicating the active temporal binding process. This suggests that inhibition can be efficient in synchronizing large neuronal populations. This process may probably be governed by voltage‐dependent mechanisms in the neuronal somas and the strategic location of inhibitory synapses on the somas [Lytton and Sejnowski, 1991; Semyanov, 2003]. At least single‐neuron studies have shown that cortical interneurons display various modes of synchronous and rhythmic activity; both chemical and electrical synapses have been proposed to be mediators of their synchrony [Gibson et al., 1999; but see Beierlein et al., 2000]. One possible interpretation may be as follows: Drive to the inhibitory cells inhibits activity in the excitatory cells, thereby removing the drive to the inhibitory cells and resulting in the period of low activity of both excitatory and inhibitory cells. When the inhibition wears off and the excitatory cells spike again, they are closer to synchrony than before [for the possible mechanism see Börgers and Kopell, 2003]. The spiking of the excitatory cells in its turn causes the next spiking of the inhibitory cells closer to synchrony, and the cycle repeats [but see Whittington et al., 2000]. However, this mechanism is operational when inhibitory cells spike only in response to the excitatory cells. In the framework of the present study, this condition is violated since the drive to the inhibitory cells was external and too strong (injection of GABA‐agonist lorazepam). Nevertheless, if we consider synaptic connections also between inhibitory cells, then the above‐mentioned condition may be restored. Here the role of inhibitory‐inhibitory synapses is to synchronize the inhibitory cells, replacing nearly constant inhibition by phasic inhibition, which allows the excitatory cells to fire also synchronously [Börgers and Kopell, 2003]. The extrasynaptic diffuse GABAA receptors [Semyanov, 2003], which are highly distributed in the brain [Kullmann et al., 2003], mediate large‐scale synchrony involving coordination between localized networks. Hippocampus [Semyanov et al., 2003] and thalamic [Destexhe, 2000] structures are also involved in this process.
Yet another interpretation is possible. GABA may have excitatory actions on several brain systems [Gulledge and Stuart, 2003], including the cortex, hippocampus, hypothalamus, retina, lateral geniculate nucleus, and superior colliculus, showing that, like acetylcholine and norepinephrine, GABA is not a “single‐action” neurotransmitter [for review, see Freeman, 1993; Köhling, 2002; but see Ben‐Ari, 2002]. Therefore, enhancement of the EEG SS process between distant neuronal populations obtained in the present study may be the result of GABA excitatory actions. At the risk of further theoretical speculation, we offer the hypothesis that, probably, strong enhancement of GABAergic function “restores” the conditions of immature brain, where excitatory actions of GABA provide most of the initial activity, a primitive signal with poor information content that propagates to all brain structures [Ben‐Ari, 2002]. Thus, our data may explain why, on occasion, GABAergic antiepileptic drugs can be also proconvulsant [Köhling, 2002]. In any case, our results are in line with recent ideas that inhibitory interactions guide the activity (operations) of neuronal populations and typically mark the transition points from one operation to another, coincident with the next step in a sequence of actions or state changes [Constantinidis et al., 2002]. In the framework of this interpretation, the synchronization of segments obtained from EEGs (which were registered from different cortical areas) corresponds to the synchronization of brain operations, which is qualitatively referred to as an Operational Synchrony (OS) [for a discussion see Fingelkurts and Fingelkurts, 2003]. It was suggested that stabilized activity of several cortical areas through the process of OS reflects the metastable brain microstates [Kaplan, 1998; for reviews see Fingelkurts and Fingelkurts, 2001; Kaplan and Shishkin, 2000]. This is consistent with a previously proposed idea on metastability [Kelso, 1991], which plays an important role in brain dynamics [Bressler and Kelso, 2001; Freeman, 2003; Friston, 1997; 2001].
CONCLUSION
In conclusion, these data indicate that the temporal synchronization of segments in the EEGs registered from different cortical sites under single‐dose lorazepam suggests that inhibition or, more precisely, GABA‐signalling may be an efficient mechanism for synchronizing large populations of neurons, rather than the mechanism for switching off of irrelevant functional connections. The total increase in the number of operationally synchronized cortical areas and the strengthening of the functional connections appear to be the specific “signature” of the influence of lorazepam on the cortex and may be of interest for drug design. Further studies will be necessary to test how this increased synchronicity relates to seizure activity.
Acknowledgements
We thank Victor Ermolaev, Dipl. Med. Eng., and Carlos Neves, M.S. for software development and technical support. We further thank Dr. Alexey Semyanov for his valuable discussion and comments. Special thanks to Simon Johnson for skilful text editing.
APPENDIX A.
Methodological Aspects of the Adaptive Level EEG Segmentation
It is well known that EEG signal is extremely nonstationary [for reviews, see Kaplan, 1998; Kaplan and Shishkin, 2000]. The understanding of the nonstationary structure of EEG signal is of intrinsic scientific importance because without understanding the character of the processes under consideration, the use of many methods often gives false results. For example, invariants, such as the mean spectrum, average ERP and ERD/ERS, coherency, fractal dimensions, Lyapunov exponents, and others, have a sense only for stationary dynamics [Landa et al., 2000]. Further, the nonstationarity of the EEG process usually does not allow constructing a global dynamical model for the whole observable [Skinner and Molnar, 2000]. Thus, regardless of how powerful or statistically significant the different estimations of averaged EEG phenomena may be, there might be difficulties in the meaningful interpretation of these if they are not matched to their piecewise stationary structure [Effern et al., 2000; Fingelkurts et al., 2002; Laskaris and Ioannides, 2001]. That is why the algorithms based on a nonstationary model of the EEG signal are of particular importance. However, the conventional parametric (and some other) segmentation procedures [Barlow, 1985; Bodenstein and Praetorius, 1977; Jansen and Cheng, 1988] contain internal controversies and thus have limitations. The main one is in the following: segmentation into stationary fragments is impossible without construction of an adequate mathematical model, but such a model cannot be built without previous segmentation [for detailed discussion and review, see Kaplan and Shishkin, 2000; see also Brodsky et al., 1999; Fell et al., 2000]. To overcome such disadvantages, the original technology of the adaptive nonparametric EEG segmentation was developed.
It is assumed that the EEG signal is “glued” from several segments of random stationary processes with different probabilistic characteristics [for review, see Fell et al., 2000]. In this case, it is possible to consider one quasi‐stationary segment as the single event in EEG‐phenomenology. Within the duration of one segment, the neuronal population that generates the oscillations is in the steady stationary state [Brodsky et al., 1999]. The transition from one segment to another reflects the changes of the generator system state or changes in the activity of the two or more systems [Barlow, 1985; Bodenstein and Praetorius, 1977; Jansen and Cheng, 1988]. These transitions (rapid transitional processes, RTP) in the EEG amplitude occurred abruptly and are the boundaries between EEG segments (or brain operations at the functional level) [for discussion, see Fingelkurts and Fingelkurts, 2003]. RTP is supposed to be of minor length compared to the quasi‐stationary segments, and, therefore, can be treated as a point or near‐point [Fingelkurts and Fingelkurts, 2001; see also Kaplan and Shishkin, 2000]. An example of EEG signal with detected PTPs is presented in Figure 1.
APPENDIX B.
Methodological Aspects of the Index of EEG Structural Synchrony as a Measure of Brain Functional Connectivity
Traditionally, coherence and correlation have been the main methods to assess the degree of functional connectivity between brain areas [Thatcher et al., 1986]. It is interesting that the initial idea, advocating the correlation approaches as an attempt to quantitatively describe the relationship in the activity of cortical areas, has gradually transformed into the postulation of the presence of an “interrelation” between different sections of the brain only in the case of a high significance of cross‐correlation and coherency [Shaw, 1984]. However, in a strict sense, the coherence value indicates only the linear statistical link between EEG curves in a frequency band [Bullock et al., 1995]. Meanwhile, it is obvious that, in general, the absence of similar types of statistical interrelation between two processes does not mean the absence of any interaction between them at all [for a critical discussion, see Kaplan et al., 1997; see also Bullock et al., 1995; Kaplan and Shishkin, 2000]. Shaw and Simpson [1996– 1997] also stressed that one must be careful about interpreting coherence (and partial coherence) as an indicator of functional connectivity and pointed out that EEG signals show a finite correlation even when recorded from separate subjects [Shaw, 1984].
Recently, several new methods for detecting functional connectivity between cortical areas have been published: partial directed coherence [Baccala and Sameshima, 2001], dynamic imaging of coherent sources [Gross et al., 2001], and phase synchrony based on wavelet [Lachaux et al., 1999] or Hilbert [Tass, 1999] transforms. However, all these methods have some limitations. The drawback is that these approaches have one or several of the following: they do not take into consideration the nonstationary nature of the data, require long time epochs of analysis, use averaging and smoothing procedures and linear models, which for the brain is not typically the case [Landa et al., 2000]. For the phase concept to be utilized, the frequencies of the signal should be locked, otherwise multiple harmonics of these frequencies may overlap and lead to ambiguous phase information [Chen and Nitz, 2003]. Further, the concept of phase synchronization can be applied only to a homogeneous medium [Davidson and Kapral, 2002], which is an unrealistic assumption for the brain. The situation is complicated also by a nonstationary process in the nonlinear phase (de)synchronization measure [Breakspear, 2002].
To overcome such disadvantages, the original technology for estimation of functional brain connectivity through the index of EEG structural synchrony (ISS) was developed. This structural (or operational) synchrony measure utilizes explicitly the definition of the interarea functional connectivity [Fingelkurts and Fingelkurts, 2001, 2003; Kaplan et al., 1997], which has been agreed upon in the neuroimaging community. According to this agreement [Horwitz, 2003], functional connectivity is defined as the temporal correlation between spatially remote neurophysiological events [Friston, 1994]. Consistently with this the ISS reflects estimated periods of the mutual temporal stabilization of quasi‐stationary segments (spatially remote events) in the multichannel EEG [Kaplan and Shishkin, 2000]. This implies that, although different cortical regions may have different anatomical features and superficially appear to have quite different sets of firing states [Ingber, 1991], they may indeed share, encode, or decode the same information using their own specific anatomy and physiology to develop their own sets of microstates [Lehmann et al., 1987], related to each other by simultaneous rapid transformations [Fingelkurts and Fingelkurts, 2001, 2003]. The main principle lies in the moment‐by‐moment metastable synchronization of the ongoing changes of brain activity between different cortical areas of the large‐scale networks [for reviews, see Bressler and Kelso, 2001; Fingelkurts and Fingelkurts, 2001; Kaplan and Shishkin, 2000]. Thus, the ISS index reflects systematic temporal relationship between the activities in different cortical areas, synchronization of brain operations (events), which is the essence of functional connectivity [for a review, see Fingelkurts and Fingelkurts, 2003]. This method is very simple conceptually and can be used for any time‐series in which we can define events. In principle, when dealing with signals of different character, the events could be defined differently in each time series, since their common cause might manifest itself differently in each time‐series [for similar ideas, see Quian Quiroga et al., 2002].
The above description of EEG structural synchrony measure and its relation to functional connectivity and underlying neural substrate satisfies the main requirements of Horwitz (2003) for usage of functional connectivity concept. Even though generally the measure of functional connectivity does not require any model [Lee et al., 2003], we believe that to go further in the interpretation of experimental data, computer modeling of ISS has to be assessed in the future.
Functional significance of ISS measure was tested in the number of modeling experiments [Borisov, 2002; Fingelkurts, 1998; Kaplan et al., 2000] where the ISS topological variability was studied in the pairs of EEG channels recorded from longitudinal and transversal electrode arrays (in straight and backward directions). The relationship of the ISS vs. interelectrode distance was analyzed. Also data from actual EEG were compared with so‐called “surrogate” EEG in which a mixing of actual EEG channels was done in such a way that each channel was recorded in a different time. Thus, the natural time relations between channels in such EEG were completely destroyed. However, the number and the sequence of segments within each channel remained the same as in the actual EEG. Thus, the ISS values obtained from the “surrogate” EEG indicate the relative rate of stochastic alternations (confidence levels) of ISS in the actual EEG [Fingelkurts, 1998]. Taken together, the findings obtained in these studies suggest that ISS has notable topological peculiarities along the neocortex, and, thus, is sensitive to its morphological and functional organization [Kaplan et al., 2000]. It has been also shown that although ISS values are slightly dependent on the interelectrode distance, the highest values of ISS were obtained for cortical areas, which are homological (with maximal interelectrode distance) and, thus, most likely participating in the same functional acts [Fingelkurts, 1998; Kaplan et al., 2000]. In addition and contrary to other EEG measures of functional connectivity, the ISS measure is reference‐independent [Borisov, 2002; Fingelkurts, 1998] and no implicit or explicit source model is needed for the interpretation of the results [Fingelkurts and Fingelkurts, 2001].
The application of the EEG structural synchrony (SS) and segmentation approaches in neurophysiological studies demonstrated their sufficiently high sensitivity in estimation of the functional connectivity dynamics related to different functional states of subjects [Fingelkurts, 1998; Kaplan et al., 1997], sleep stages [Kaplan et al., 2001], cognitive and memory processing [Fingelkurts et al., 2003b; Kaplan and Shishkin, 2000], multisensory integration [Fingelkurts et al., 2003a], and consciousness levels [Fingelkurts and Fingelkurts, 2001, 2003]. Moreover, the ISS appeared to be sensitive to the subjects' individual level of anxiety [Shishkin et al., 1998], large ontogeny shifts (differences between children and adults) [Borisov, 2002], and changes in the functional state of brain during schizoid and schizotipal diseases [Kaplan and Borisov, 2002].
In order to compare the results of the EEG structural synchrony (SS) approach with some conventional methods, the Pearson coefficients of correlation were calculated for the same data [Kaplan et al., 2000]. Although the results of cross‐correlation analysis and analogous data for ISS were similar, the SS description of interrelations between cortical areas was significantly more contrasted and pronounced. The same rule was found when the interelectrode distance was taken into consideration [Fingelkurts, 1998; Kaplan et al., 2000]. The similarity between the dynamics of ISS and the cross‐correlation values was observed only for the rest conditions. However, in the cases of a more complex structure of the electrical field architectonics (during cognitive tasks or pathological states), the dynamic characteristics of ISS and cross‐correlation indices may be substantially different [Borisov, 2002]. It was also shown that the temporal consistency of EEG segmental structure initially underlies and determines high values of cross‐correlation and coherence [Kaplan et al., 2000].
REFERENCES
- Acker CD (2000): Synchronization of strongly coupled excitatory neurons: relating biophysics to network behavior. Doctoral dissertation. Boston: Boston University. pp 144.
- Aftanas LI, Golocheikine SA (2001): Human anterior and frontal midline theta and lower alpha reflect emotionally positive state and internalized attention: high‐resolution EEG investigation of meditation. Neurosci Lett 310: 57–60. [DOI] [PubMed] [Google Scholar]
- Baccala LA, Sameshima K (2001): Partial directed coherence: a new concept in neural structure determination. Biol Cybern 84: 463–474. [DOI] [PubMed] [Google Scholar]
- Barlow JS. 1985. Methods of analysis of nonstationary EEGs, with empahasis on segmentation techniques: a comparative review. J Clin Neurophysiol 2: 267–304. [DOI] [PubMed] [Google Scholar]
- Beierlein M, Gibson JR, Connors BW (2000): A network of electrically coupled interneurons drives synchronized inhibition in neocortex. Nat Neurosci 3: 904–910. [DOI] [PubMed] [Google Scholar]
- Ben‐Ari Y (2002): Excitatory actions of GABA during development: the nature of the nurture. Nat Rev Neurosci 3: 728–739. [DOI] [PubMed] [Google Scholar]
- Bodenstein G, Praetorius HM (1977): Feature extraction from the electroencephalogram by adaptive segmentation. Proc IEEE 65: 642–652. [Google Scholar]
- Börgers C, Kopell N (2003): Synchronization in networks of excitatory and inhibitory neurons with sparse, random connectivity. Neural Comput 15: 509–538. [DOI] [PubMed] [Google Scholar]
- Borisov SV (2002): Studying the phasic structure of alpha activity of human EEG. Ph.D. Dissertation. Moscow: Moscow State University. pp 213 (in Russian).
- Braitenberg V, Schuz A (1998): Cortex: statistics and geometry of neuronal connectivity, 2nd ed. New York: Springer‐Verlag. [Google Scholar]
- Breakspear M (2002): Nonlinear phase desynchronization in human electroencephalographic data. Hum Brain Mapp 15: 175–198. [DOI] [PMC free article] [PubMed] [Google Scholar]
- Bressler SL, Kelso JAS (2001): Cortical coordination dynamics and cognition. Trends Cognit Sci 5: 26–36. [DOI] [PubMed] [Google Scholar]
- Brodsky BE, Darkhovsky BS, Kaplan AYA, Shishkin SL (1999): A nonparametric method for the segmentation of the EEG. Comput Methods Programs Biomed 60: 93–106. [DOI] [PubMed] [Google Scholar]
- Bullock TH, McClune MC, Achimowicz JZ, Iragui‐Madoz VJ, Duckrow RB, Spencer SS (1995): EEG coherence has structure in the millimeter domain: subdural and hippocampal recordings from epileptic patients. Electroencephalogr Clin Neurophysiol 95: 161–177. [DOI] [PubMed] [Google Scholar]
- Bullmore E, Long C, Suckling J, Fadili J, Calvert G, Zelaya F, Carpenter TA, Brammer M (2001): Colored noise and computational inference in neurophysiological (fMRI) time series analysis: resampling methods in time and wavelet domains. Hum Brain Mapp 12: 61–78. [DOI] [PMC free article] [PubMed] [Google Scholar]
- Burkitt AN, Clark GM (2000): Calculation of interspike intervals for integrate‐and‐fire neurons with Poisson distribution of synaptic inputs. Neural Comput 12: 1789–1820. [DOI] [PubMed] [Google Scholar]
- Chen Y, Nitz DA (2003): Use of “relative‐phase” analysis to assess correlation between neuronal spike trains. Biol Cybern 88: 177–182. [DOI] [PubMed] [Google Scholar]
- Chen Y, Huang YS, Wu J (2000): Desynchronization of large scale delayed neural networks. Proc Am Math Soc 128: 2365–2371. [Google Scholar]
- Constantinidis C, Williams GV, Goldman‐Rakic PS (2002): A role for inhibition in shaping the temporal flow of information in prefrontal cortex. Nat Neurosci 5: 175–180. [DOI] [PubMed] [Google Scholar]
- Davidson J, Kapral R (2002): Phase synchronization and topological defects in inhomogeneous media. Phys Rev E66: 055202(R). [DOI] [PubMed] [Google Scholar]
- Derogatis LR, Lipman RS, Covi L. 1973. SCL‐90: An outpatient psychiatric rating scale: preliminary report. Psychopharmacology 9: 13–28. [PubMed] [Google Scholar]
- Destexhe A (2000): Modelling corticothalamic feedback and the gating of the thalamus by the cerebral cortex. J Physiol (Paris) 94: 391–410. [DOI] [PubMed] [Google Scholar]
- Di Lazzaro V, Oliviero A, Meglio M, Cioni B, Tamburrini G, Tonali P, Rothwell JC (2000): Direct demonstration of the effect of lorazepam on the excitability of the human motor cortex. Clin Neurophysiol 111: 794–799. [DOI] [PubMed] [Google Scholar]
- Effern A, Lehnertz K, Fernandez G, Grunwald T, David P, Elger CE (2000): Single trial analysis of event related potentials: non‐linear de‐noising with wavelets. Clin Neurophysiol 111: 2255–2263. [DOI] [PubMed] [Google Scholar]
- Engel AK, Fries P, Singer W (2001): Dynamic predictions: oscillations and synchrony in top‐down processing. Nat Rev Neurosci 2: 704–716. [DOI] [PubMed] [Google Scholar]
- Fell J, Kaplan A, Darkhovsky B, Röschke J (2000): EEG analysis with nonlinear deterministic and stochastic methods: a combined strategy. Acta Neurobiol Exp 60: 87–108. [DOI] [PubMed] [Google Scholar]
- Fingelkurts An A (1998): Time‐spatial organization of human EEG segment's structure [Russian language]. PhD Dissertation. Moscow: Moscow State University. pp 275.
- Fingelkurts An A, Fingelkurts Al A (2001): Operational architectonics of the human brain biopotential field: towards solving the mind‐brain problem. Brain Mind 2: 261–296. [Google Scholar]
- Fingelkurts An A, Fingelkurts Al A (2003): Operational architectonics of perception and cognition: a principle of self‐organized metastable brain states. VI Parmenides Workshop, Institute of Medical Psychology. April 5–10, Elba, Italy. Online at http://www.bm-science.com/team/art24.pdf
- Fingelkurts An A, Fingelkurts Al A, Borisov SV, Ivashko RM, Kaplan AYa (2000): Spatial structures of human multichannel EEG quasi‐stationary segments during memory task. Vestnik Moskovskogo Universiteta (Bull Moscow University) 3: 3–10 (in Russian). [Google Scholar]
- Fingelkurts Al A, Fingelkurts An A, Krause CM, Sams M (2002): Probability interrelations between pre‐/post‐stimulus intervals and ERD/ERS during a memory task. Clin Neurophysiol 113: 826–843. [DOI] [PubMed] [Google Scholar]
- Fingelkurts ANA, Fingelkurts Al A, Krause CM, Möttönen R, Sams M (2003a): Cortical operational synchrony during audio‐visual speech integration. Brain Lang 85: 297–312. [DOI] [PubMed] [Google Scholar]
- Fingelkurts ANA, Fingelkurts Al A, Krause CM, Kaplan AYa, Borisov SV, Sams M (2003b): Structural (operational) synchrony of EEG alpha activity during an auditory memory task. Neuroimage 20: 529–542. [DOI] [PubMed] [Google Scholar]
- Freeman WJ. 1993. Valium, histamine, and neural networks. Biol Psychiatry 34: 1–2. [DOI] [PubMed] [Google Scholar]
- Freeman WJ (2003): Evidence from human scalp electroencephalograms of global chaotic itinerancy. Chaos 13: 1067–1077. [DOI] [PubMed] [Google Scholar]
- Friston KJ (1994): Functional and effective connectivity in neuroimageing: a synthesis. Hum Brain Mapp 2: 56–78. [Google Scholar]
- Friston KJ (1997): Transients, metastability and neural dynamics. Neuroimage 5: 164–171. [DOI] [PubMed] [Google Scholar]
- Friston K (2001): The labile brain. I. Neuronal transients and nonlinear coupling. Phil Trans R. Soc Lond B 355: 215–236. [DOI] [PMC free article] [PubMed] [Google Scholar]
- Gibson JR, Beierlein M, Connors BW (1999): Two networks of electrically coupled inhibitory neurons in neocortex. Nature 402: 75–79. [DOI] [PubMed] [Google Scholar]
- Gross J, Kujala M, Hämäläinen M, Timmermann L, Schnitzler A, Salmelin R (2001): Dynamic imaging of coherent sources: studying neural interactions in the human brain. Proc Natl Acad Sci USA 98: 694–699. [DOI] [PMC free article] [PubMed] [Google Scholar]
- Gulledge AT, Stuart GJ (2003): Excitatory actions of GABA in the cortex. Neuron 37: 299–309. [DOI] [PubMed] [Google Scholar]
- Hagemann D, Naumann E, Thayer JF (2001): The quest for the EEG reference revisited: a glance from brain asymmetry research. Psychophysiology 38: 847–857. [PubMed] [Google Scholar]
- Horwitz B (2003): The elusive concept of brain connectivity. Neuroimage 19: 466–470. [DOI] [PubMed] [Google Scholar]
- Ingber L (1991): Statistical mechanics of neocortical interactions: a scaling paradigm applied to electroencephalography. Physical Rev A 44: 4017–4060. [DOI] [PubMed] [Google Scholar]
- Jansen BH, Cheng WK (1988): Structural EEG analysis: an explorative study. Int J Biomed Comput 23: 221–237. [DOI] [PubMed] [Google Scholar]
- Kaplan AIa (1998): The nonstability of the EEG: a methodological and experimental analysis [Russian language]. Usp Fiziol Nauk (Success in Physiological Sciences) 29: 35–55. [PubMed] [Google Scholar]
- Kaplan AIa, Shishkin SL (2000): Application of the change‐point analysis to the investigation of the brain's electrical activity In: Brodsky BE, Darkhovsky BS, editors. Nonparametric statistical diagnosis: problems and methods. Dordrecht, The Netherlands: Kluwer Academic Publishers; p 333–388. [Google Scholar]
- Kaplan AYa, Borisov SV (2002): The differences in structural synchrony of the brain electrical field in alpha range between normal control and schizophrenic adolescents. Human Brain Mapping Meeting, Sendai, Japan. June 2–6, 2002. Poster no. 10472. Neuroimage 329.
- Kaplan AIa, Fingelkurts Al A, Fingelkurts An A, Darkhovsky BS (1997): Topological mapping of sharp reorganization synchrony in multichannel EEG. Am J End Technol 37: 265–275. [Google Scholar]
- Kaplan AIa, Fingelkurts An A, Fingelkurts Al A, Shishkin SL, Ivashko RM (2000): Spatial synchrony of human EEG segmental structure [Russian language]. Zh Vyssh Nerv Deiat Im IP Pavlova (Journal of Higher Nerve Activity) 50: 624–637. [PubMed] [Google Scholar]
- Kaplan A, Röschke J, Darkhovsky B, Fell J (2001): Macrosructural EEG characterization based on nonparametric change‐point segmentation: application to sleep analysis. J Neurosci Methods 106: 81–90. [DOI] [PubMed] [Google Scholar]
- Kelso JAS (1991): Behavioral and neural pattern generation: the concept of Neurobehavioral Dynamical System (NBDS) In: Koepchen HP, editor. Cardiorespiratory and motor coordination. Berlin: Springer‐Verlag. [Google Scholar]
- Köhling R (2002): GABA becomes exciting. Science 298: 1350–1351. [DOI] [PubMed] [Google Scholar]
- Kudela P, Franaszczuk PJ, Bergey GK (1999): Decreasing inhibition increases synchronization and burst duration simulated neural networks. Epilepsia 40: 12.10446745 [Google Scholar]
- Kullmann DM, Semyanov A, Walker MC (2003): Glutamate and GABA spillover onto ionotropic and metabotropic receptors. Third FEPS Congress Proceedings 171–175.
- Lachaux JP, Rodriguez E, Martinerie J, Varela FJ (1999): Measuring phase synchrony in brain signals. Hum Brain Mapp 8: 194–208. [DOI] [PMC free article] [PubMed] [Google Scholar]
- Landa P, Gribkov D, Kaplan A (2000): Oscillatory processes in biological systems In: Malik SK, Chandrashekaran MK, Pradhan N, editors. Nonlinear phenomena in biological and physical sciences. New Delhi: Indian National Science Academy; p 123–152. [Google Scholar]
- Laskaris NA, Ioannides AA (2001): Exploratory data analysis of evoked response single trials based on minimal spanning tree. Clin Neurophysiol 112: 698–712. [DOI] [PubMed] [Google Scholar]
- Lee L, Harrison LM, Mechelli A (2003): A report of the functional connectivity workshop, Dusseldorf 2002. Neuroimage 19: 457–465. [DOI] [PubMed] [Google Scholar]
- Lehmann D, Ozaki H, Pal I (1987): EEG alpha map series: brain microstates by space‐oriented adaptive segmentation. Electroencephalogr Clin Neurophysiol 67: 271–288. [DOI] [PubMed] [Google Scholar]
- Link CG, Leigh TJ, Fell GL. 1991. Effects of granisetron and lorazepam, alone and in combination, on the EEG of human volunteers. Br J Clin Pharmacol 31: 93–97. [DOI] [PMC free article] [PubMed] [Google Scholar]
- Lytton WW, Sejnowski TJ. 1991. Simulations of cortical pyramidal neurons synchronized by inhibitory interneurons. J Neurophysiol 66: 1059–1079. [DOI] [PubMed] [Google Scholar]
- Mandema JW, Kuck MT, Danhof M. 1992. Differences in intrinsic efficacy of benzodiazepines are reflected in their concentration‐EEG effect relationship. Br J Pharmacol 105: 162–170. [DOI] [PMC free article] [PubMed] [Google Scholar]
- McIntosh AR (1999): Mapping cognition to the brain through neural interactions. Memory 7: 523–548. [DOI] [PubMed] [Google Scholar]
- Nunez PL (1995): Neocortical dynamics and human EEG rhythms. New York: Oxford University Press. [Google Scholar]
- Nunez PL (2000): Toward a quantitative description of large‐scale neocortical dynamic function and EEG. Behav Brain Sci 23: 371‐437. [DOI] [PubMed] [Google Scholar]
- Quian Quiroga R, Kreuz T, Grassberger P (2002): Event synchronization: a simple and fast method to measure synchronicity and time delay patterns. Phys Rev E Stat Nonlin Soft Matter Phys 66: 041904. [DOI] [PubMed] [Google Scholar]
- Rappelsberger P (1998): Probability mapping of power and coherence: technical aspects In: Petsche H, Etlinger S, editors. EEG and thinking. Vienna: Österreichische Akademie der Wissenschaften; p 63–78. [Google Scholar]
- Semyanov A (2003): Cell type specificity of GABAA receptor mediated signaling in the hippocampus. Curr Drug Target CNS Neurol Disord 2: 240–248. [DOI] [PubMed] [Google Scholar]
- Semyanov A, Walker MC, Kullmann DM (2003): GABA uptake regulates cortical excitability via cell type‐specific tonic inhibition. Nat Neurosci 6: 484–490. [DOI] [PubMed] [Google Scholar]
- Shaw JC (1984): Correlation and coherence analysis of the EEG: a selective totorial review. Int J Psychophysiol 1: 255–266. [DOI] [PubMed] [Google Scholar]
- Shaw JC, Simpson D (1996–1997): EEG coherence: caution and cognition. Br Psychophysiol Soc Q 30–31: 7–9. [Google Scholar]
- Shishkin SL, Darkhovsky BS, Fingelkurts Al A, Fingelkurts ANA, Kaplan AYA (1998): Interhemisphere synchrony of short‐term variations in human EEG alpha power correlates with self‐estimates of functional state. Proc 9th World Congress of Psychophysiology, Tvaormin, Sicily, Italy. p 133.
- Skinner JE, Molnar M (2000): “Response Cooperativity”: a sign of a nonlinear neocortical mechanism for stimulus‐binding during classical conditioning in the act In: Malik SK, Chandrashekaran MK, Pradhan N, editors. Nonlinear phenomena in biological and physical sciences. New Delhi: Indian National Science Academy; p 223–248. [Google Scholar]
- Skinner F, Kopell N, Marder E (1994): Mechanisms for oscillation and frequency control in networks of mutually inhibitory relaxation oscillators. J Comput Neurosci 1: 69–87. [DOI] [PubMed] [Google Scholar]
- Tass PA (1999): Phase resetting in medicine and biology. Berlin: Springer; p 247–248. [Google Scholar]
- Thatcher RW, Krause PJ, Hrybyk M (1986): Cortico‐cortical associations and EEG coherence: a two‐compartmental model. Electroencephalogr Clin Neurophysiol 64: 123–143. [DOI] [PubMed] [Google Scholar]
- Villar HO, Davies MF, Loew GH, Maguire PA (1990): Molecular models for recognition and activation at the benzodiazepine receptor: a review. Life Sci 48: 593–602. [DOI] [PubMed] [Google Scholar]
- Volkow ND, Wang GJ, Hitzemann R, Fowler JS, Wolf AP, Pappas N, Biegon A, Dewey SL (1993): Decreased cerebral response to inhibitory neurotransmission in alcoholics. Am J Psychiatry 150: 417–422. [DOI] [PubMed] [Google Scholar]
- Volkow ND, Wang GJ, Hitzemann R, Fowler JS, Pappas N, Lowrimore P, Burr G, Pascani K, Overall J, Wolf AP (1995): Depression of thalamic metabolism by lorazepam is associated with sleepiness. Neuropsychopharmacology 12: 123–132. [DOI] [PubMed] [Google Scholar]
- von der Malsburg C (1998): Self‐organization and the brain In: Arbib MA, editor. The handbook of brain theory and neural networks. Cambridge, MA: MIT Press, p 840–843. [Google Scholar]
- von der Malsburg C (1999): The what and why of binding: the modeler's perspective. Neuron 24: 95–104. [DOI] [PubMed] [Google Scholar]
- Weiss S, Rappelsberger P (2000): Long‐range EEG synchronization during word encoding correlates with successful memory performance. Cogn Brain Res 9: 299–312. [DOI] [PubMed] [Google Scholar]
- Whittington MA, Traub RD, Kopell N, Ermentrout B, Buhl EH (2000): Inhibition‐based rhythms: experimental and mathematical observations on network dynamics. Int J Psychophysiol 38: 315–336. [DOI] [PubMed] [Google Scholar]