Abstract
Humans take a long time to respond to the slow visual motion of an object. It is not known what neural mechanism causes this delay. We measured magnetoencephalographic neural responses to light spot motion onset within a wide speed range (0.4–500°/sec) and compared these with human reaction times (RTs). The mean response latency was inversely related to the speed of motion up to 100°/sec, whereas the amplitude increased with the speed. The response property at the speed of 500°/sec was different from that at the other speeds. The speed‐related latency change was observed when the motion duration was 10 msec or longer in the speed range between 5 and 500°/sec, indicating that the response is directly related to the speed itself. The source of the response was estimated to be around the human MT+ and was validated by functional magnetic imaging study using the same stimuli. The results indicate that the speed of motion is encoded in the neural activity of MT+ and that it can be detected within 10 msec of motion observation. RT to the same motion onset was also inversely related to the speed of motion but the delay could not be explained by the magnetic response latency change. Instead, the reciprocal of RT was linearly related to the reciprocal of the magnetic response latency, suggesting that the visual process interacts with other neural processes for decision and motor preparation. Hum. Brain Mapping 16:104–118, 2002. © 2002 Wiley‐Liss, Inc.
Keywords: extrastriate cortex, human brain, magnetoencephalography, reaction time, visual motion, functional magnetic resonance imaging, speed detection
Introduction
Visual detection of motion seems to be one of the most important features for animals because no species have been shown to lack this mechanism even though a number of animals lack other features, such as color and depth perception [Nakayama, 1985]. Indeed, local velocity is now widely known as a cardinal signal for the detection of the three‐dimensional shape of an object and self‐motion, and for the control of eye movement. It is therefore important to determine the precise neural mechanism underlying visual motion detection.
One of the fundamental questions in the study on the motion detection mechanism is which part of the brain is involved in this neural process. Many animal experiments have addressed this question and the detailed functional architecture of the monkey cortex has been revealed [Allman and Kass, 1971; Felleman and Van Essen, 1991; Zeki, 1978]. The human visual motion system has been investigated recently using positron emission tomography (PET) [Zeki et al., 1991] and functional magnetic resonance imaging (fMRI) [Tootell et al., 1995]. Although these methods have been successful in revealing the anatomical and physiological features of the human visual system, they are not applicable to the investigation of the temporal structure of neural activities because their measurements are based on metabolic or hemodynamic changes in an activated region. Thus, psychophysical studies have mainly been carried out to address other fundamental questions such as how fast humans can detect motion and how long humans need to see a moving object for the detection of its speed. A behavioral human response, however, requires execution of neural processes other than the visual process, such as the higher cognitive process and motor execution. It is therefore possible that such a reaction time (RT) does not correspond to the time required for the detection of visual information [Ejima and Ohtani, 1989; McCarthy and Donchin, 1981]. Thus, direct measurement of the process time in the human visual system is necessary.
Electroencephalography had been the only method used for measuring human brain activities noninvasively and in real time until magnetoencephalography (MEG) was developed to eliminate electrical signal interference by tissues surrounding the brain, such as cerebrospinal fluid [Hamalainen et al., 1993; Hughes, 1983]. MEG has been used to locate cortical regions involved in visual motion detection and to investigate temporal activity patterns [Ahlfors et al., 1999; Anderson et al., 1996; Bundo et al., 2000; Ffytche et al., 1995; Kaneoke et al., 1997; Lam et al., 2000; Patzwahl et al., 1996; Uusitalo et al., 1997; Vanni et al., 1997; Watanabe et al., 2001].
In this study, we measured the latency of the MEG response to real motion in a wide speed range and compared it with human behavioral RT. We addressed the following questions: 1) is the human RT linearly related to the process time in the visual motion detection system? 2) how long do humans need to observe an object's motion to evaluate its speed? and 3) is the motion speed itself encoded in the neural activity of the human brain as found in animals [Mandl, 1993; Perrone and Thiele, 2001]? Furthermore, we investigated the sources of the MEG responses by means of the single equivalent current dipole (ECD) model and compared the results with the distribution of the cortical activation to the same visual motion stimuli revealed by fMRI study. The results will be useful in the assessment of the validity of the ECD model.
Materials and Methods
Subjects
Eight healthy colleagues (S1 ∼ S8; three women and five men) with normal or corrected‐to‐normal visual acuity (mean age, 35 years; range 26–41 years) gave their informed consent before participation in the MEG study. All of them were right‐handed. Seven subjects (S1 ∼ S7) participated in most of the experimental sessions but the assessment of the effect of the stimulus duration on MEG response was carried out with subjects S2 ∼ S8. Five subjects (S2–S5, S7) also participated in the fMRI study.
Visual Stimuli
We developed a device for presenting precise real motion of an object with a wide range of speed from 0.4–500°/sec, instead of using a conventional CRT monitor. An optical galvanometer scanner (G120DT, General Scanning) was used to move a spot of red light (710 cd/m2 and ϕ 4 mm on the screen) from a laser beam (wavelength: 670 nm) under the control of PC (Fig. 1). The spot started to move within 0.1 msec after the command signal and the lag time to reach a desired speed was less than 0.1 msec. Systems similar to ours have been used in human and monkey experiments [Galletti et al., 1990; Huk and Heeger, 2000; Orban et al., 1984].
Figure 1.
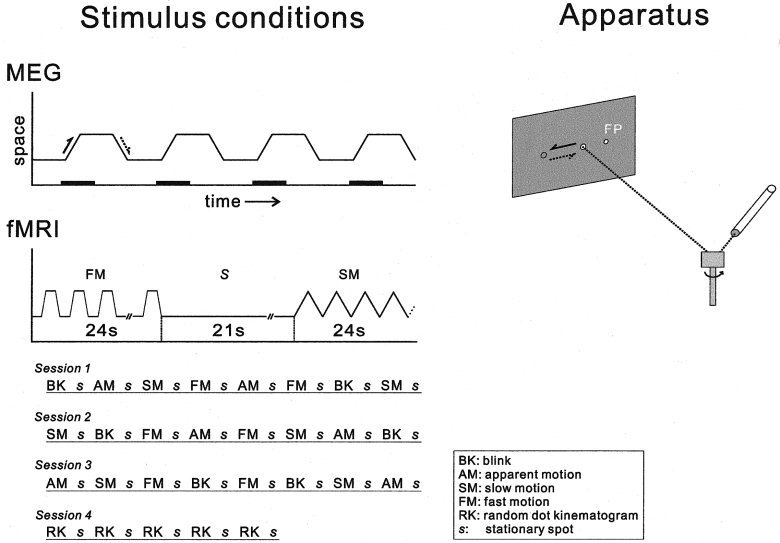
Schematic illustration of the stimulus apparatus (right side) and the stimulus conditions for MEG and fMRI studies. The position of the light spot from the laser beam moved with the mirror on the galvanometer scanner. The fixation point (FP) was also presented by the light spot. For each MEG recording session, the same stimulus was repeated 120 times and MEG signals acquisition started 50 msec before the motion onset and ended 500 msec after the onset (shown by the thick line). Each response was then averaged to increase signal to noise ratio. The directions of the spot motion shown by the two arrows correspond to the same arrows (indicated by the solid and the broken lines) on the apparatus figure. The block design stimulus presentation was used in the fMRI study. During the stimulus, the light spot moved from right to left at the distance of 1° for 24 sec. Each stimulus was followed by the control stimulus (the stationary spot presented for 21 sec). Actual order of the stimulus presentation is shown. At Session 4, incoherent motion created by the random dot kinematogram was presented similarly.
For MEG experiment, the spot was presented on a white board in a magnetically shielded room through a small window from the outside. For each experimental session, the spot moved leftward from the initial location (1° offset from the fixation point in the left visual field) at a determined distance and duration, and remained at this position for 2–3 sec. The spot moved back to the initial position with the same duration (speed) and remained at this position 2–3 sec until it started to move again. The same stimulus condition (direction, distance, and speed of the spot) was repeated 120 times to acquire a MEG response for each session (see Fig. 1).
For fMRI experiment, the subject looked at the fixation point on the screen at a distance of 142 cm through the mirror. Using the same stimulus apparatus as that for MEG experiments, four different stimuli were presented on the left visual field, which were referred to as blink, apparent motion, slow motion, and fast motion in this study. The experiments with the slow and the fast motion stimuli were directly related to this study and the blink and apparent motion stimuli were used for the other study but were also effective to reduce the subjects' adaptation to the motion stimuli. For the blink stimulus, the light was turned on and off every 1 sec at the same location 1° offset from the fixation point. The apparent motion of the light was induced by the alternating presentation of the light at two locations (1 and 2° offset from the fixation point) every 1 sec with an interstimulus interval of 10 msec. The speeds of the slow and the fast motion stimuli were 1°/sec and 20°/sec, respectively. For these stimuli, the light spot moved every 1 sec between the two locations at a distance of 1°. The nearest location was always 1° offset from the fixation point. Each type of stimulus (presented for 24 sec) followed by the control stimulus (the stationary light spot presented for 21 sec at 1° offset from the fixation point) was presented six times in random order in three sessions (see Fig. 1).
At the fourth session, we presented another visual motion stimuli. Incoherent motion (random walk) of dots produced by a random dot kinematogram (RDK) [Lam et al., 2000; Scase et al., 1996] at a speed of 3.2°/sec, followed by stationary dots (for 21 sec), was presented for 24 sec, and was repeated five times. This stimulus was chosen because it has been used in many visual motion studies and was also used to measure the activity in the human putative MT/V5 [McCarthy et al., 1995]. The subject gazed at the center of the stimulus (subtended 17.8 × 8.8°). The dot size was 0.16° and the density was 10%. The mean luminance was 21 cd/m2 for both conditions (the incoherent motion and the stationary dots).
MEG Response Recording
A 37‐channel neuromagnetometer (Magnes; BTi, San Diego, CA) was used to record magnetic responses [Pantev et al., 1991]. All the participants were experienced subjects of MEG experiments. They could fixate their heads during the acquisition (about 15 min) and practiced eye fixation and the timing of the blink.
The subject lay on his/her right side on a bed in a magnetically shielded room (6 cd/m2) and was instructed to focus on the fixation point (58 cd/m2, ϕ 3 mm) at a viewing distance of 2 m. The center of the MEG sensors was aimed at the right lateral occipital scalp. After the subject's head was placed and fixed with the surgical tape on the sensors, three points on the head (nasion, bilateral tips of tragi) were digitized using a sensor position indicator to register the spatial relationship between the head and the sensors. More than 100 responses beginning 50 msec before and ending 500 msec after the onset of the target motion for each direction of the motion were collected at a sampling rate of 2083.3 Hz and a frequency range between 0.1–800 Hz. MEG responses were then averaged separately for each direction of the motion and band‐pass‐filtered at 1.0–50 Hz by FFT. In off‐line averaging, MEG responses with a drift of more than ±1,500 fT were discarded. The baseline of each channel's data was corrected with respect to the mean value for 50 msec before the trigger. MEG recordings were performed under randomized stimulus conditions among the subjects.
Assessment of the global magnetic field strength at each time (t) and the peak latency of the first response was carried out based on the root mean square (RMS) values across the 37 channels of the averaged MEG data: RMS(t) = (Σx(i,t)2/37)0.5, where Σx(i,t)2/37 is the square mean of the 37 channels' magnetic field strength (x(i,t), i = 1–37) at time t. The single equivalent current dipole (ECD) model [Sarvas, 1987] was used to estimate the location of the cortical activities that produced the magnetic fields recorded under each stimulus condition with the analysis program provided by BTi (MSI version WHS 1.2.5). Two criteria were used in the application of the ECD model to a magnetic response as previously reported [Kaneoke et al., 1997]. First, during the period of the response, the source estimated by the model must remain stationary (within 5 mm of each coordinate). Second, the correlation between the recorded magnetic fields and those expected from the estimated dipoles must be >0.95. The coordinates of the dipole location in a component of the response were obtained by averaging the period (10–20 msec) that satisfied the above criteria. The distance between the mean and each measured dipole location for each subject was calculated to obtain the 95% confidence distance (mean + 1.96 SD of the distance) of the dipole location as previously described [Kaneoke et al., 1997]. To compare the results of fMRI studies, MR images with the dipole locations for each subject were converted to the Analyze format using AnalyzePC (Mayo Biomedical Imaging Resource, Rochester, MN). The images were then coregistered with the fMRI images to compare the dipole location with the fMRI results.
Functional Magnetic Resonance Imaging
Functional images were acquired with three Tesla scanners (Signa, GE; Milwaukee, WI) using a single‐shot gradient echo (GE) sequence to get BOLD signals [Ogawa and Lee, 1990]. The parameters were TR: 3 sec; TE: 30 msec; FA: 90°; field of view (FOV): 22 cm; matrix size: 64 × 64 in 34 axial planes of 2.7 mm thickness with a gap of 0.3 mm. For the anatomical coregistration of the functional images, two types of images were acquired using the T2‐weighted fast spin echo sequence (TR: 6 sec; TE: 70 msec; FOV: 22 cm; matrix size: 256 × 256): One had the same slice size as the functional images and the other type had 112 axial planes with a slice size of 1.5 mm.
SPM99 from the Wellcome Department of Cognitive Neurology (London, UK) was used for fMRI data analysis and statistical evaluation [Friston et al., 1995]. The stimulus conditions (block design) used in the fMRI study are shown in Figure 1. The functional images in all the four sessions for each subject were realigned with the last images and were spatially smoothed with an isotropic Gaussian kernel (FWHM: 6 mm). A statistical parametric map of the t statistic was then constructed for each stimulus condition and the values of the map were normalized and thresholded at P = 0.001 (uncorrected). The significance of the resulting regional value was then assessed to determine whether the spatial extent of the region or the peak height could have occurred by chance (i.e., P ≥ 0.05) using distributional approximations from the theory of Gaussian fields.
Reaction Time Measurement
This experiment was done after the MEG acquisition using the same stimulus apparatus. The subjects in the magnetically shielded room were instructed to push the button as soon as they perceived motion of the light spot, which moved leftward from the initial point (1° offset from the fixation point in the left visual field) as in the MEG study. The speed of motion was randomized in each trial and the motion occurred 3–5 sec after the previous motion onset to maintain the subjects' attention. They performed three sessions, each of which consisted of 70 trials. RTs below 100 msec and above 1,000 msec (which occurred less than three times for each subject) were excluded from the analyses.
Statistical Analyses
A three‐way analysis of variance (ANOVA) was performed to statistically analyze MEG latencies and amplitudes (subject × motion duration × motion speed). Pearson's correlation was used to determine the relationship between RMS peak latencies and amplitudes. A P‐value of <0.05 was considered significant.
Results
Changes in MEG Latency and Amplitude with Motion Speed
We measured MEG responses to the onset of motion of the light spot in the right posterior head of the subject. The illustrative averaged MEG waveforms and their root mean square (RMS) values for seven different speeds from a single subject are shown in Figure 2.) All the data are plotted from the motion onset, and the direction of the motion is away from the fixation point for all responses. Motion durations (shown as bars under the waveforms) were longer than the first deflections of the responses for all speeds except 500°/sec.
Figure 2.
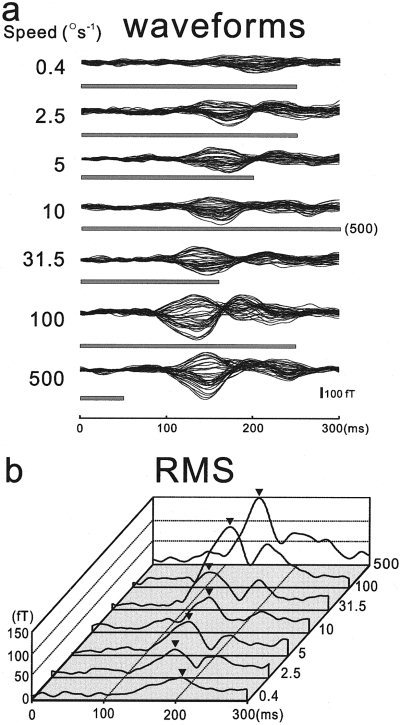
Time courses of waveforms (a) and RMS values (b) of MEG responses to visual motion (started at time 0) at varying speeds. The 37‐channel data are overlaid after each channel's zero level is corrected. Gray bars under the waveforms show the motion presentation times. Note that all responses except that for 500°/sec were before the offset of the motion stimuli. As shown by the arrowheads, RMS peak latencies are inversely related to the speed of motion.
As clearly shown in Figure 2, the response latency of the first component is inversely related to the motion speed up to 100°/sec, whereas the amplitude is directly related to it. Although the onset latency of the first component is also related to the motion speed, we systematically analyzed the peak latency and the peak amplitude of the RMS data because they were easier to detect (see Fig. 2b). The mean (±SEM) peak latency and amplitude changes across the seven subjects are shown in Figure 3.) Although the amplitude is nearly linearly related to the logarithmic value of the speed (Fig. 3b), the latency change is not linear (Fig. 3a). We found a linear relationship between the reciprocal of the latency (which we refer to as the response rate in this study) and the amplitude in the speed range up to 100°/sec (r = 0.992 and P < 0.001, Pearson correlation), but data for 500°/sec did not follow this relationship (Fig. 3c).
Figure 3.
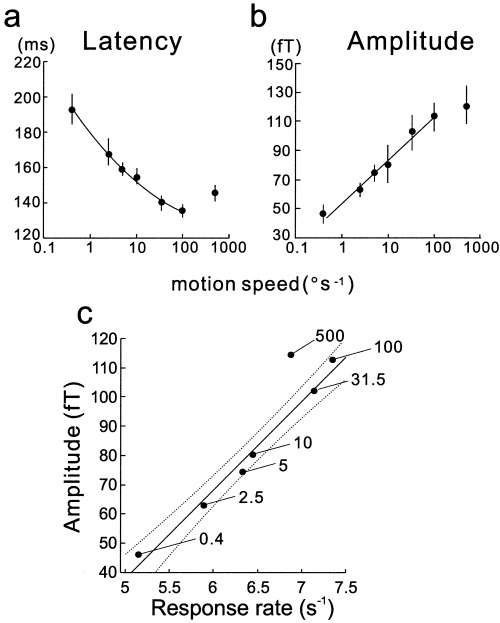
Changes in the peak latency and the amplitude of the MEG response to varying speeds of motion. The latency is inversely related to the speed of motion up to 100°/sec (a), whereas the amplitude increases with the speed monotonically up to 100°/sec (b). Both data represent the mean (±SEM) values across all data from seven subjects. The relationship between latency and amplitude is not linear because the latency change with the logarithmic value of the speed is not linear although the amplitude change is. In contrast, a clear linear relationship is found between response rate (reciprocal of the latency) and amplitude except for the data for 500°/sec (c). Dashed lines show 95% confidence area.
Effect of Motion Presentation Time on Magnetic Response
Although we found that the peak latency and the amplitude of the magnetic response to the light spot motion changed with the speed of motion (see Figs. 2 and 3), it remains uncertain whether the change is due to the speed itself or to other stimulus properties such as distance and duration of the motion stimulus. To answer this question, we measured the magnetic responses to the motion with much shorter stimulus durations and compared them with those to the motion with the same speed but longer durations.
Surprisingly, motions of 10‐msec duration evoked responses with the same latency change as those for long durations for speeds ranging from 5 to 500°/sec (P > 0.05, by three‐way ANOVA) (Fig. 4a,c). Although the amplitudes were also related to the speed, the values were significantly smaller than the responses for long durations (P < 0.05, by three‐way ANOVA) (Fig. 4b).
Figure 4.
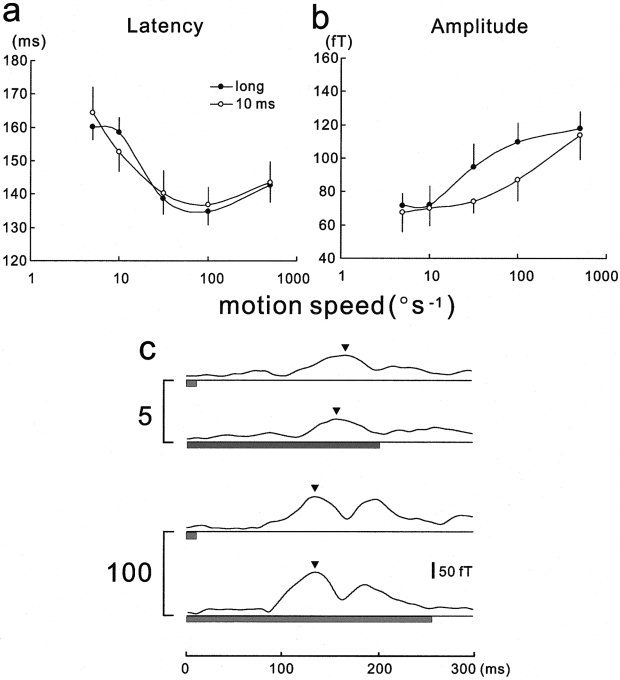
Effect of duration of the motion stimulus on MEG response latency and amplitude. The mean (±SEM) latencies for a duration of 10 msec did not differ significantly from the values for durations longer than the peak latencies (long) when the speed was between 5 and 500°/sec (P > 0.05, three‐way ANOVA) (a). In contrast, the mean (±SEM) amplitudes for a 10‐msec duration were significantly smaller than those for long durations (P < 0.05, three‐way ANOVA) (b). Illustrative waveforms of the responses to various durations at speed values between 5 and 100°/sec are shown (c). Waveforms are plotted as in Figure 2 and arrowheads indicate the peak of the RMS values.
Estimated Source of MEG Response
All the responses for the long duration stimuli at seven speeds in Subjects S1–S3 and S5 could be used to estimate their sources using the single ECD model (see Materials and Methods). The sources of four, one, and two responses for Subjects S4, S6, and S7 did not satisfy the criteria for the estimation, probably due to the low signal‐to‐noise ratio. Figure 5 shows the response waveforms, together with the time courses of the coordinate values for the estimated locations, and the correlation between measured and calculated magnetic fields using the estimated dipole locations. Stable coordinate values for almost the entire duration of the first response component suggest that the response was evoked by neural activities in the localized cortical area and that the area did not change during the response but the magnitude did. Furthermore, the estimated locations for both responses are similar even though there are marked differences in the amplitudes and the latencies. For all the subjects, the estimated sources were within small regions in the occipitotemporal area (the confidence distance was comprised between 0.9 and 2.5 cm).
Figure 5.
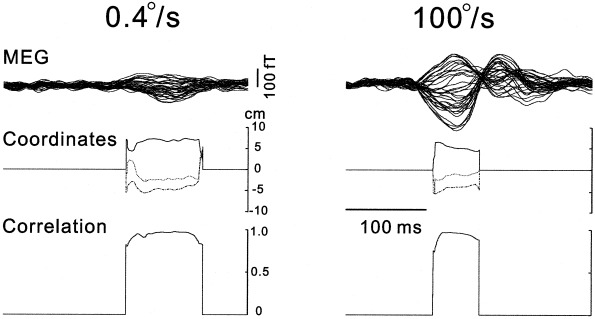
MEG waveforms of the responses to the motion (0.4 and 100°/sec) (top), time course of coordinates of the estimated response sources (middle), and the correlations between measured and calculated magnetic fields using the estimated dipole locations (bottom) during the period of responses. Waveforms are shown as in Figure 2. Note that the locations estimated are stable and the correlations are close to 1.0 for nearly the entire duration of the first response components.
Regional Hemodynamic Change Induced by Visual Motion
In this study, we analyzed regional cortical activations by the slow motion, the fast motion, and the incoherent motion. Figure 6 shows the cortical areas whose BOLD signals were significantly (P < 0.05, corrected) increased by the slow motion compared to the signals during the control stimuli for each subject. The main signal increase was found in the occipitotemporal areas (around the upper limb of the inferior temporal sulcus) corresponding to the human homologue of the middle temporal area and the adjacent areas (MT+) and no significant increase was found in the primary visual cortex (V1) for all the subjects. The same results were seen for the other two stimuli. The spatial extents inside the brain are shown in Figure 7a for Subject S5. Note that the similar regions in the right occipitotemporal area are activated by all the stimuli. In Figure 7b, the mean estimated source (dipole location) of the magnetic responses for this subject is shown on the T1‐weighted MRI with the activated regions revealed by fMRI. The estimated dipole location is deep in the cortex but is not different from the region of the BOLD signal increase in the anteroposterior and ventrocaudal directions. Figure 8 shows the mean estimated source of the magnetic responses and the locations in the occipitotemporal region where the BOLD signal increased mostly for each subject. The mean (±SD) distance between the dipole location and the peak location in the functional image was 21 ± 10 mm, whereas the dipole location was within 10 mm of the mean peak locations in the Y (anteroposterior) axis (mean ± SD: 5 ± 4 mm).
Figure 6.
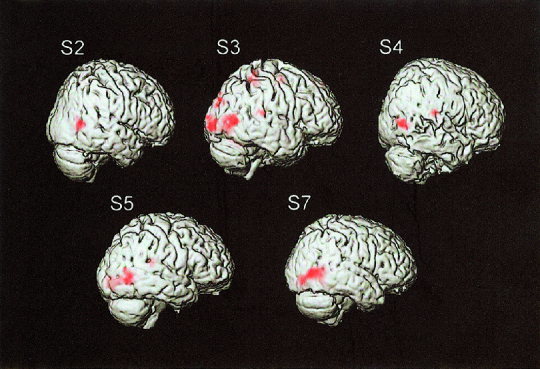
Cortical regions that revealed significant BOLD signal increase by the light spot motion at 1°/sec. The main signal increase was found in the occipitotemporal area for each subject. Note that no significant signal increase is found in the primary visual cortex for all the subjects.
Figure 7.
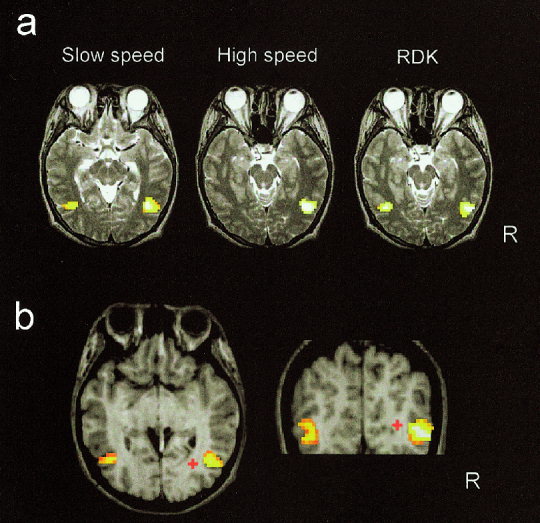
Spatial extents of the cortical regions (Subject S5) activated by visual motion shown on 2‐D MRIs (a). The peak signal increase in the right occipitotemporal region for each stimulus condition was on the slice shown. The mean estimated source (red cross) of the magnetic responses to the light spot motions with the cortical regions activated by the slow motion shown on the 2‐D MRI for Subject S5 (b). The magnetic response source is estimated to be deep (medial) in the cortex but there are not much differences between the ventrocaudal and the anteroposterior direction.
Figure 8.
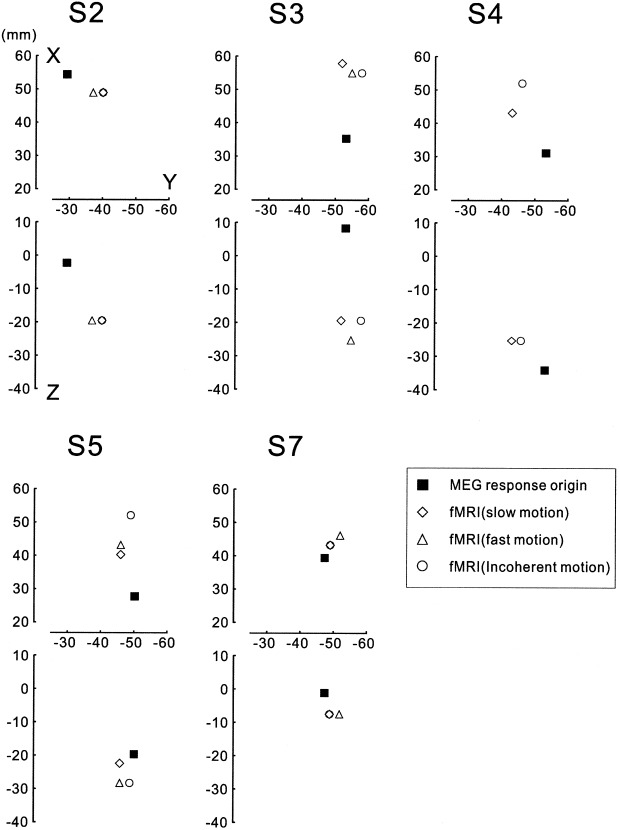
Estimated magnetic response source (mean dipole location) and peak locations of the BOLD signal increase in the right occipitotemporal region for each subject shown on the coordinate system similar to the Talairach coordinate. Note that the locations are relative and differ among the subjects because the analysis was performed on individual brain and the images were not normalized. The peak locations of the BOLD signal increase were within the same region for each subject because the spatial extent of the region was more than 20 mm in diameter. The dipole locations on the Y (anteroposterior) axis were similar to those for BOLD peaks for all the subjects compared to the differences on the X (mediolateral) and Z (ventrodorsal) axes.
Human Reaction Time to Motion Onset
We measured the RT to the onset of the motion using the stimuli same as that for the MEG study for two reasons. One is to validate our motion stimulus by comparing RT data with those of previous studies carried out using different motion stimuli. The other is to investigate the relationship between RT and MEG response latency (Tm) to assess the neural process underlying the perception of the visually presented motion.
Consistent with the previously reported RT dependency with the speed of the motion using a narrower speed of range than ours [Ball and Sekuler, 1980; Dzhafarov et al., 1993; Hohnsbein and Mateeff, 1992], RTs for our motion stimuli were inversely related to the speed of motion up to 100°/sec. Figure 9a shows the change in mean (±SEM) RT across seven subjects with the mean MEG latency change (Tm). The relationship between RT and the speed (V) of motion has often been described by equation (1): RT = α + β × V−γ, where α, β, and γ are positive constants. The exponential value of γ for this study at speeds between 0.4 and 100°/sec is estimated to be 0.513 (r 2 = 0.999), which corresponds to the values reported previously [Dzhafarov et al., 1993; Hohnsbein and Mateeff, 1992] even though their motion stimuli (random dots) were different from ours. The MEG response latency (Tm) is also described well by this equation (r 2 = 0.989) but the value of γ is 0.168, which is much smaller than that for RT (Fig. 9a).
Figure 9.
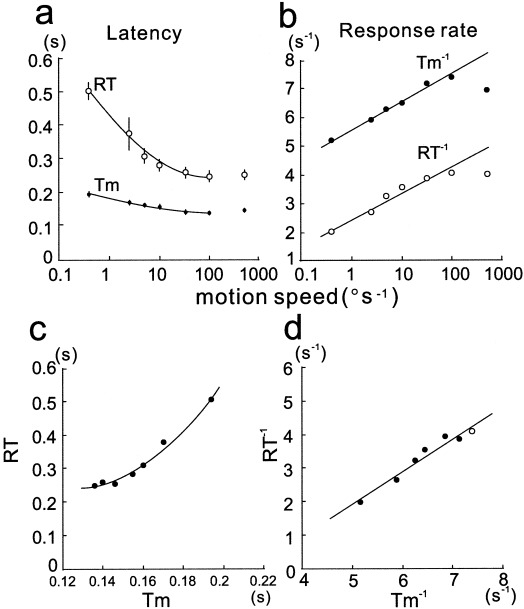
Comparison of human behavioral reaction time (RT) with MEG latency (Tm). Although both values are inversely related to the speed of motion (a), the relationship between them is not linear (c). Both response rates (reciprocals of RT and Tm) are linearly related to the speed of motion with the same slope except for the values for 500°/sec (b). Their relationship is expressed by a linear function (d). Note that the data for 500°/sec also follow this relationship (open symbols).
In contrast to the latency data, the reciprocals of the latencies for speeds between 0.4 and 100°/sec were linearly related to the logarithmic values of the speeds for both RT and Tm with the same slope (r = 0.971 and P = 0. 0003 for RT−1, r = 0.991 and < 0. 0001 for Tm−1) (Fig. 9b). Thus, the relationship between RT−1 and Tm−1 is linear (Fig. 9d), although RT is not a linear function of Tm (Fig. 9c).
Discussion
MEG Response to Visual Motion
One may question which properties in our visual motion stimuli evoked the MEG responses. Although we found clear response latency and amplitude changes with the speed of the light spot motion, the changes may be due to other properties that vary with the speed of motion, such as duration, distance, and the change in the spot's location in the visual field.
All the above possibilities were negated when we found that the motion of 10‐ms duration evoked the same latency responses (see Fig. 4). This is because the response latency changed with the speed even when the duration was the same (10 msec) and because the same latency responses were evoked by the same speed motions even when the distances and the locations of the stimulation in the visual field were much different from each other (Fig. 4c). Thus, the response latency was determined by the speed of motion at least in the examined range between 5 and 500°/sec. Because the response peak occurred before the offset of the stimulus presentation for the long duration stimuli, the response cannot be related to the offset response. Although the response for the 10‐msec duration could be due to both onset and offset of the motion, the peak latency same as that for the long duration and the lower amplitude suggests that the response for the 10‐msec is also mainly related to the motion onset.
Furthermore, the response was not evoked by the linear system [Carpenter, 1988; DeAngelis et al., 1993; Glantz, 1994] because the stimulus duration did not affect the peak latency. If the response were a simple output of the linear system, the peak latency for longer durations should be longer than that for shorter stimulus durations. We consider that the MEG responses reflect the intracortical neural process for the detection of the object's motion speed, and the perceived speed of the light spot's motion is encoded by the neural activity that evoked the magnetic fields that we measured as MEG responses.
A similar response latency change was observed in a recent study on evoked potentials [Korth et al., 2000]. Recent physiological studies also showed that the response latencies of neurons in MT/V5 and MST of monkeys are inversely related to the speed of visual motion stimuli [Kawano et al., 1994; Lisberger and Movshon, 1999], which corresponds to our results. Although Raiguel et al. [1999] suggested that such a latency change is related to how closely the stimulus matches the preference of each neuron, the MEG response latency change does not need to correspond to each single neuron's activity. This is because MEG measures the spatiotemporal summation of intracellular currents produced by excitatory postsynaptic potentials for more than one million cortical pyramidal neurons [Hamalainen et al., 1993; Okada et al., 1997]. Thus, MEG response represents synchronized inputs to a localized area rather than each neuron's spiking output. This is probably the reason why the MEG response latency is dependent on the stimulus condition (motion speed) even though the response latencies of the MT neurons are widely distributed [Raiguel et al., 1989; Schmolesky et al., 1998]. This is another reason why we consider that the magnetic response reflects the intracortical processing of a region.
The peak RMS amplitude of the MEG response was also related to the speed of motion up to 100°/sec. This cannot be due to the distance or area of the stimulated retina, because the amplitude of the response at a speed of 100°/sec with a duration of 10 msec is much larger than that at a speed of 5°/sec with a duration of 200 msec even though both stimuli cover the same distance (1°). Amplitude change may be related to the size of the neural population responding to each speed. In the monkey MT, the number of speed‐tuned neurons increases for speeds up to 32°/sec [Maunsell and Van Essen, 1983]. Our data may indicate that the peak of such neuronal distribution in the human MT+ is obtained at approximately 100°/sec. Although a recent fMRI study contradicts this view [Chawla et al., 1998], the regional blood volume change may not correspond to the size of the neural population. Another possibility is that the MEG response originates from a wider area including higher speed related areas such as VIP (ventral intraparietal area) in monkeys, because these areas have more neurons that respond to higher speeds [Colby et al., 1993]. This may not be the case, however, because the estimated sources of the magnetic responses corresponded to the human MT+ as determined by the fMRI study (see below and Figs. 7 and 8).
Although the amplitude is nearly linearly related to the logarithmic speed of motion, the latency change is not. Thus, the relationship between them is not linear. We found that the amplitude was linearly related to the reciprocal of the latency (Fig. 3c). This linear relationship clearly indicates that the response at the speed of 500°/sec has a property different from that at other speeds. This may be related to the finding that the human speed discrimination threshold suddenly increases when the speed exceeds 100°/sec [De Bruyn and Orban, 1988]. Although the data for 500°/sec were measured with a much shorter stimulus duration than that of the response latency, this cannot explain the specific property of the data because the duration of 10 msec also evoked the same response at this speed (see Fig. 4b). This shows that the response is determined within 10 msec after motion onset and does not change even with longer durations.
Source of Magnetic Response
Most of the MEG response sources could be estimated using the single ECD model and the locations were always around the occipitotemporal area, as found in our previous studies [Bundo et al., 2000; Kaneoke et al., 1997]. In the present fMRI study using the same visual stimuli, we found the activation in the occipitotemporal area similar to the estimated MEG response sources (see Figs. 6 and 7). We consider that the region corresponds to the human MT+ for each subject for the following reasons: First, the region was near the ascending limb of the inferior temporal sulcus, which was proposed to be the anatomical landmark of MT+ [Watson et al., 1993]. Second, the region was also activated by the incoherent motion of the RDK (see Fig. 8). This stimulus was used to identify human MT+ in previous imaging studies [Braddick et al., 2001; Cheng et al., 1995; McCarthy et al., 1995; McKeefry et al., 1997].
Although the estimated magnetic response sources were deep in the brain region whose activation was found in fMRI study, this discrepancy might be due to the well‐known phenomenon that occurs in the application of the single ECD model. That is, a wide cortical region can produce a magnetic field that can be explained by the single dipole located deeper in that region when the cortical pyramidal neurons in the region are oriented parallel to each other in the same direction. This is experimentally confirmed in the case of two dipoles oriented parallel to each other in the same direction [Okada, 1985]. Multiple dipole models may not solve this problem because more than 95% of such a magnetic field can be explained by the single ECD model as shown in this study. Simply, the nearest cortical point to the estimated dipole may indicate the center of activation that is responsible for the magnetic response, as shown in Figures 7 and 8.
The increase in BOLD signals was recently shown to correspond to the local field potential that is considered to reflect synchronized dendro‐somatic inputs [Logothetis et al., 2001]. Because magnetic responses are also considered to reflect synchronized inputs [Hamalainen et al., 1993; Okada et al., 1997], fMRI study will be useful in the estimation of the magnetic responses if the proper stimulus conditions are used. The present fMRI study revealed that widely distributed cortical regions exhibited a significant increase in BOLD signals for all the subjects except S2 (Fig. 6). In contrast, the magnetic responses to our visual motion stimuli must have been induced by a focal cortical region because their magnetic field patterns could be well explained by the single ECD model. This discrepancy may be due to differences in stimulus conditions and in the sensitivity to detect cortical activations. In this study, however, it was not difficult to specify the cortical region responsible for the magnetic responses from the regions observed by fMRI study. First, the cortical region that evoked the magnetic responses to our stimuli must be spatially restricted because widely distributed regions cannot produce a magnetic field that can be explained by the single ECD model. Second, such a localized region responsible for the magnetic response must be located close and lateral to the estimated magnetic response source, as discussed above. Thus, the occipitotemporal area including the human MT+ was considered to be the region responsible for the magnetic responses for all the subjects.
Relation of MEG Response to Human Reaction Time
The human RT to the onset of our visual motion stimulus changed with speed, which is in agreement with the results of previous psychophysical studies [Ball and Sekuler, 1980; Dzhafarov et al., 1993; Hohnsbein and Mateeff, 1992; Mateeff et al., 1995, 1999; Smeets and Brenner, 1994], that is, the marked similarity in the value of γ (about 0.5) of equation (1) (see Results), considering that different visual motion stimuli were used in these studies. Although in two other studies, higher values (approximately 1.0) of γ were reported [Burr et al., 1998; Troscianko and Fahle, 1988], the reason could be due to the use of lower speeds as discussed by the authors [Burr et al., 1998] and of a speed range (0.3–2°/sec) narrower than ours (0.4–500°/sec).
It has been hypothesized that RT can be described by equation (2): RT = Tc + Tv, where Tc is the time independent of visual stimuli (presumably related to motor preparation and execution) and Tv is the time that varies with visual stimulus conditions [Burr et al., 1998; Dzhafarov et al., 1993; Ejima and Ohtani, 1989; Mateeff et al., 1999; van den Berg and van de Grind, 1989]. According to this equation, Tv represents the time required by the visual system to detect motion in our study and is independent of other processes such as cognitive and motor execution processes. Thus, this leads to the idea that the visual system provides results of the neural process for the detection of motion, which can be accessed by other distinct neural systems, as shown by the simple block diagram in the upper part of Figure 10.) Our MEG measurements of the responses in the extrastriate area, however, suggest other possibilities because RT is not a linear function of the MEG response latency (Tm) (see Fig. 9c). The Tv value in equation (2) should be related to Tm in this study because the speed of motion must be detected by this time, otherwise speed‐related latency change does not occur. The present study indicates that RT is dependent on Tm, but instead of equation (2) the relationship is well described by equation (3): RT−1 = Tm−1 + C, where C is a constant (see Fig. 9d). This relationship seems to be robust because this relationship also applies even for 500°/sec.
Figure 10.
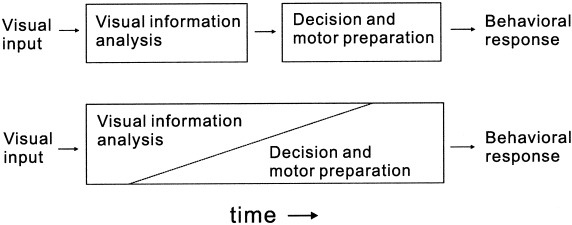
Two distinct simplified models for the brain process in behavioral response to visual stimulus. The top model shows existence of the neural process independent of visual information analysis. The bottom model also allows the existence of such neural processes independent of each other but the neural process for visual information analysis affects and interacts with the other processes. The results of the present studies agree with the bottom model.
What does equation (3) mean? We consider that the reciprocal of the latency denotes the speed of the neural process; thus, the speed of the reaction (including both visual motion detection and action processes) is linearly related to the speed of the visual motion processing. This indicates that the neural process in the behavioral reaction is not independent of that in the visual system; instead, they share common neural circuits (see Fig. 10) as suggested by a recent physiological study [Gold and Shadlen, 2000].
Conclusion
We measured magnetic responses from the human extrastriate cortex using light spot motion at various speeds (0.4 to 500°/sec). The source of the responses was estimated to be around the human MT+ and was validated by the fMRI study conducted with the same visual stimulus. Clear response latency and amplitude changes with the speed of motion were observed when the motion presentation time was 10 msec or longer, indicating that the motion speed is encoded in the neural activity of the extrastriate area and the critical motion observation time to detect motion speed is less than 10 msec for our subjects. The behavioral response time to the same visual motion onset was inversely related to the speed as the magnetic response latency but the relationship was not linear. This suggests that the visual information process affects the other processes such as decision and motor preparation though further studies to measure MEG response and the human reaction time in the same experimental session are necessary to confirm it.
Acknowledgements
We thank Dr. Y. Okada of the University of New Mexico School of Medicine, VA Medical Center for his valuable comments, Mr. O. Nagata and Mr. Y. Takeshima for their technical support, and Ms. Y. Nonaka and Ms. A. Fukuda for their secretarial assistance. The visual stimulus apparatus used in this study is available from TimeFlex (Toyota, Japan).
REFERENCES
- Ahlfors SP, Simpson GV, Dale AM, Belliveau JW, Liu AK, Korvenoja A, Virtanen J, Huotilainen M, Tootell RBH, Aronen HJ, Ilmoniemi RJ (1999): Spatiotemporal activity of a cortical network for processing visual motion revealed by MEG and fMRI. J Neurophysiol 82: 2545–2555. [DOI] [PubMed] [Google Scholar]
- Allman JM, Kass JH (1971): A representation of the visual field in the caudal third of the middle temporal gyrus of the owl monkey (Aotus trivirgatus). Brain Res 31: 85–105. [DOI] [PubMed] [Google Scholar]
- Anderson SJ, Holliday IE, Singh KD, Harding GFA (1996): Localization and functional analysis of human cortical area V5 using magneto‐encephalography. Proc R Soc Lond B Biol Sci 263: 423–431. [DOI] [PubMed] [Google Scholar]
- Ball K, Sekuler R (1980): Models of stimulus uncertainty in motion perception. Psychol Rev 87: 435–469. [PubMed] [Google Scholar]
- Braddick OJ, O'Brien JMD, Wattam Bell J, Atkinson J, Hartley T (2001): Brain areas sensitive to coherent visual motion. Perception 30: 61–72. [DOI] [PubMed] [Google Scholar]
- Bundo M, Kaneoke Y, Inao S, Yoshida J, Nakamura A, Kakigi R (2000): Human visual motion areas determined individually by magnetoencephalography and 3D magnetic resonance imaging. Hum Brain Mapp 11: 33–45. [DOI] [PMC free article] [PubMed] [Google Scholar]
- Burr DC, Fiorentini A, Morrone C (1998): Reaction time to motion onset of luminance and chromatic gratings is determined by perceived speed. Vision Res 38: 3681–3690. [DOI] [PubMed] [Google Scholar]
- Carpenter RHS (1988): Movements of the eyes. London: Pion Limited; 593 p. [Google Scholar]
- Chawla D, Phillips J, Buechel C, Edwards R, Friston KJ (1998): Speed‐dependent motion‐sensitive responses in V5: an fMRI study. Neuroimage 7: 86–96. [DOI] [PubMed] [Google Scholar]
- Cheng K, Fujita H, Kanno I, Miura S, Tanaka K (1995): Human cortical regions activated by wide‐field visual motion: an H2(15)O PET study. J Neurophysiol 74: 413–427. [DOI] [PubMed] [Google Scholar]
- Colby CL, Duhamel JR, Goldberg ME (1993): Ventral intraparietal area of the macaque: anatomic location and visual response properties. J Neurophysiol 69: 902–914. [DOI] [PubMed] [Google Scholar]
- De Bruyn B, Orban GA (1988): Human velocity and direction discrimination measured with random dot patterns. Vision Res 28: 1323–1335. [DOI] [PubMed] [Google Scholar]
- DeAngelis GC, Ohzawa I, Freeman RD (1993): Spatiotemporal organization of simple‐cell receptive fields in the cat's striate cortex. II. Linearity of temporal and spatial summation. J Neurophysiol 69: 1118–1135. [DOI] [PubMed] [Google Scholar]
- Dzhafarov EN, Sekuler R, Allik J (1993): Detection of changes in speed and direction of motion: reaction time analysis. Percept Psychophys 54: 733–750. [DOI] [PubMed] [Google Scholar]
- Ejima Y, Ohtani Y (1989): Analysis of simple reaction time to a sinusoidal grating by means of a linear filter model of the detection process. Percept Psychophys 46: 119–126. [DOI] [PubMed] [Google Scholar]
- Felleman DJ, Van Essen DC (1991): Distributed hierarchical processing in the primate cerebral cortex. Cereb Cortex 1: 1–47. [DOI] [PubMed] [Google Scholar]
- Ffytche DH, Guy CN, Zeki S (1995): The parallel visual motion inputs into areas V1 and V5 of human cerebral cortex. Brain 118: 1375–1394. [DOI] [PubMed] [Google Scholar]
- Friston KJ, Holmes AP, Worsley KJ, Poline JB, Frith CD, Frackowiak RSJ (1995): ) Statistical parametric maps in functional imaging: a general approach. Hum Brain Mapp 2: 189–210. [Google Scholar]
- Galletti C, Battaglini PP, Fattori P (1990): ‘Real‐motion’ cells in area V3A of macaque visual cortex. Exp Brain Res 82: 67–76. [DOI] [PubMed] [Google Scholar]
- Glantz RM (1994): Directional selectivity in a nonspiking interneuron of the crayfish optic lobe: evaluation of a linear model. J Neurophysiol 72: 180–193. [DOI] [PubMed] [Google Scholar]
- Gold JI, Shadlen MN (2000): Representation of a perceptual decision in developing oculomotor commands. Nature 404: 390–394. [DOI] [PubMed] [Google Scholar]
- Hamalainen M, Hari R, Ilmoniemi RJ, Knuutila J, Lounasmaa OV (1993): Magnetoencephalography: theory, instrumentation, and applications to noninvasive studies of the working human brain. Rev Mod Phys 65: 413–497. [Google Scholar]
- Hohnsbein J, Mateeff S (1992): The relation between the velocity of visual motion and the reaction time to motion onset and offset. Vision Res 32: 1789–1791. [DOI] [PubMed] [Google Scholar]
- Hughes JR (1983): Magnetoencephalography‐update and future hopes. Am J EEG Technol 23: 179–189. [Google Scholar]
- Huk AC, Heeger DJ (2000): Task‐related modulation of visual cortex. J Neurophysiol 83: 3525–3536. [DOI] [PubMed] [Google Scholar]
- Kaneoke Y, Bundou M, Koyama S, Suzuki H, Kakigi R (1997): Human cortical area responding to stimuli in apparent motion. Neuroreport 8: 677–682. [DOI] [PubMed] [Google Scholar]
- Kawano K, Shidara M, Watanabe Y, Yamane S (1994): Neural activity in cortical area MST of alert monkey during ocular following responses. J Neurophysiol 71: 2305–2324. [DOI] [PubMed] [Google Scholar]
- Korth M, Rix R, Sembritzki O (2000): The sequential processing of visual motion in the human electroretinogram and visual evoked potential. Vis Neurosci 17: 631–646. [DOI] [PubMed] [Google Scholar]
- Lam K, Kaneoke Y, Gunji A, Yamasaki H, Matsumoto E, Naito T, Kakigi R (2000): Magnetic response of human extrastriate cortex in the detection of coherent and incoherent motion. Neuroscience 97: 1–10. [DOI] [PubMed] [Google Scholar]
- Lisberger SG, Movshon JA (1999): Visual motion analysis for pursuit eye movements in area MT of macaque monkeys. J Neurosci 19: 2224–2246. [DOI] [PMC free article] [PubMed] [Google Scholar]
- Logothetis NK, Augath M, Trinath T, Oeltermann A (2001): Neurophysiological investigation of the basis of the fMRI signal. Nature 412: 150–157. [DOI] [PubMed] [Google Scholar]
- Mandl G (1993): Coding for stimulus velocity by temporal patterning of spike discharges in visual cells of cat superior colliculus. Vision Res 33: 1451–1475. [DOI] [PubMed] [Google Scholar]
- Mateeff S, Dimitrov G, Hohnsbein J (1995): Temporal thresholds and reaction time to changes in velocity of visual motion. Vision Res 35: 355–363. [DOI] [PubMed] [Google Scholar]
- Mateeff S, Genova B, Hohnsbein J (1999): The simple reaction time to changes in direction of visual motion. Exp Brain Res 124: 391–394. [DOI] [PubMed] [Google Scholar]
- Maunsell JHR, Van Essen DC (1983): Functional properties of neurons in middle temporal visual area of the macaque monkey. I. Selectivity for stimulus direction, speed, and orientation. J Neurophysiol 49: 1127–1147. [DOI] [PubMed] [Google Scholar]
- McCarthy G, Donchin E (1981): A metric of thought: a comparison of P300 latency and reaction time. Science 211: 77–80. [DOI] [PubMed] [Google Scholar]
- McCarthy G, Spicer M, Adrignolo A, Luby M, Gore J, Allison T (1995): Brain activation associated with visual motion studied by functional magnetic resonance imaging in humans. Hum Brain Mapp 2: 234–243. [Google Scholar]
- McKeefry DJ, Watson JDG, Frackowiak RS, Fong K, Zeki S (1997): The activity in human areas V1/V2, V3, and V5 during the perception of coherent and incoherent motion. Neuroimage 5: 1–12. [DOI] [PubMed] [Google Scholar]
- Nakayama K (1985): Biological image motion processing: a review. Vision Res 25: 625–660. [DOI] [PubMed] [Google Scholar]
- Ogawa S, Lee TM (1990): Magnetic resonance imaging of blood vessels at high fields: in vivo and in vitro measurements and image simulation. Magn Reson Med 16: 9–18. [DOI] [PubMed] [Google Scholar]
- Okada Y (1985): Discrimination of localized and distributed current dipole sources and localized single and multiple sources In: Weinberg H, Stroink G, Katila T, editors. Biomagnetism: application and theory. Oxford, England: Pergamon Press; p 266–272. [Google Scholar]
- Okada YC, Wu J, Kyuhou S (1997): Genesis of MEG signals in a mammalian CNS structure. Electroencephalogr Clin Neurophysiol 103: 474–485. [DOI] [PubMed] [Google Scholar]
- Orban GA, de Worf J, Maes H (1984): Factors influencing velocity coding in the human visual system. Vision Res 24: 33–39. [DOI] [PubMed] [Google Scholar]
- Pantev C, Gallen C, Hampson S, Buchanan S, Sobel D (1991): Reproducibility and validity of neuromagnetic source localization using a large array biomagnetometer. Am J EEG Technol 31: 83–101. [Google Scholar]
- Patzwahl DR, Elbert T, Zanker JM, Altenmuller EO (1996): The cortical representation of object motion in man is interindividually variable. Neuroreport 7: 469–472. [DOI] [PubMed] [Google Scholar]
- Perrone JA, Thiele A. 2001. Speed skills: measuring the visual speed analyzing properties of primate MT neurons. Nat Neurosci 4: 526–532. [DOI] [PubMed] [Google Scholar]
- Raiguel SE, Lagae L, Gulyas B, Orban GA (1989): Response latencies of visual cells in macaque areas V1, V2 and V5. Brain Res 493: 155–159. [DOI] [PubMed] [Google Scholar]
- Raiguel SE, Xiao DK, Marcar VL, Orban GA (1999): Response latency of macaque area MT/V5 neurons and its relationship to stimulus parameters. J Neurophysiol 82: 1944–1956. [DOI] [PubMed] [Google Scholar]
- Sarvas J (1987): Basic mathematical and electromagnetic concepts of the biomagnetic inverse problem. Physiol Med Biol 32: 11–22. [DOI] [PubMed] [Google Scholar]
- Scase MO, Braddick OJ, Raymond JE (1996): What is noise for the motion system? Vision Res 36: 2579–2586. [DOI] [PubMed] [Google Scholar]
- Schmolesky MT, Wang Y, Hanes DP, Thompson KG, Leutgeb S, Schall D, Leventhal AG (1998): Signal timing across the macaque visual system. J Neurophysiol 79: 3272–3278. [DOI] [PubMed] [Google Scholar]
- Smeets JB, Brenner E (1994): The difference between the perception of absolute and relative motion: a reaction time study. Vision Res 34: 191–195. [DOI] [PubMed] [Google Scholar]
- Tootell RB, Reppas JB, Kwong KK, Malach R, Born RT, Brady TJ, Rosen BR, Belliveau JW (1995): Functional analysis of human MT and related visual cortical areas using magnetic resonance imaging. J Neurosci 15: 3215–3230. [DOI] [PMC free article] [PubMed] [Google Scholar]
- Troscianko T, Fahle M (1988): Why do isoluminant stimuli appear slower? J Opt Soc Am A 5: 871–880. [DOI] [PubMed] [Google Scholar]
- Uusitalo MA, Jousmaki V, Hari R (1997): Activation trace lifetime of human cortical responses evoked by apparent visual motion. Neurosci Lett 224: 45–48. [DOI] [PubMed] [Google Scholar]
- van den Berg AV, van de Grind WA (1989): Reaction times to motion onset and motion detection thresholds reflect the properties of bilocal motion detectors. Vision Res 29: 1261–1266. [DOI] [PubMed] [Google Scholar]
- Vanni S, Uusitalo MA, Kiesila P, Hari R (1997): Visual motion activates V5 in dyslexics. Neuroreport 8: 1939–1942. [DOI] [PubMed] [Google Scholar]
- Watanabe S, Kakigi R, Puce A (2001): Occipitotemporal activity elicited by viewing eye movements: a magnetoencephalographic study. Neuroimage 13: 351–363. [DOI] [PubMed] [Google Scholar]
- Watson JD, Myers R, Frackowiak RS, Hajnal JV, Woods RP, Mazziotta JC, Shipp S, Zeki S (1993): Area V5 of the human brain: evidence from a combined study using positron emission tomography and magnetic resonance imaging. Cereb Cortex 3: 79–94. [DOI] [PubMed] [Google Scholar]
- Zeki S, Watson JDG, Lueck CJ, Friston KJ, Kennard C, Frackowiak RSJ (1991): A direct demonstration of functional specialization in human visual cortex. J Neurosci 11: 641–649. [DOI] [PMC free article] [PubMed] [Google Scholar]
- Zeki SM (1978): Functional specialization in the visual cortex of the rhesus monkey. Nature 274: 423–428. [DOI] [PubMed] [Google Scholar]


