

Abstract
Determining the reliability and reproducibility of the hemodynamic response is important for the interpretation and understanding of the results of functional magnetic resonance imaging (fMRI) experiments. We describe a whole brain fMRI study designed to examine the reproducibility of the event‐related hemodynamic response elicited by low‐probability task‐relevant target stimuli and low‐probability task‐irrelevant novel stimuli assessed 6 weeks apart. Reliable activation was observed during test and retest for processing of target stimuli in multiple frontal, temporal, parietal, cerebellar, and subcortical sites. Novel stimuli elicited reliable activation during test and retest in lateral frontal cortex, inferior parietal lobule, and lateral temporal cortex, though there was evidence of habituation at some cortical sites. The patterns of activation associated with target detection and novelty processing are consistent with the intracranial distribution of the neural sources generated during similar tasks and replicate the results of previous event‐related fMRI studies. The observed pattern of results supports the hypothesis that the hemodynamic response to target and novel stimuli is highly reproducible over the 6‐week test–retest period. Hum. Brain Mapping 18:42–52, 2003. © 2002 Wiley‐Liss, Inc.
Keywords: fMRI, test–retest, hemodynamic response
INTRODUCTION
Functional magnetic resonance imaging (fMRI) is a rapidly proliferating technique in psychophysiology. Compared to other imaging technologies, such as positron emission tomography (PET) and single‐photon emission computed tomography (SPECT), fMRI is more widely available, less expensive, provides superior temporal and spatial resolution and, importantly, is less invasive. This latter aspect of fMRI facilitates types of experiments that can be difficult to implement in PET or SPECT. In particular, the noninvasiveness of fMRI allows researchers to assess reproducibility of the hemodynamic response over time in the same sample of participants.
Early fMRI studies have examined the reproducibility of the hemodynamic response associated with simple motor or sensory paradigms [Aguirre et al., 1998; Baumgartner et al., 1997; Moser et al., 1996; Noll et al., 1997; Ramsey et al., 1996; Rombouts et al., 1997, 1998; Wexler et al., 1997; Yetkin et al., 1996]. In general, these studies have observed modest reproducibility in the patterns of activation within subjects over short periods of time (typically less than a week). In the first study to assess reproducibility of the hemodynamic response during a cognitive task, Noll et al. [1997] found modest agreement between test and retest in the pattern of activation associated with performance of a working memory paradigm in healthy participants assessed 10 days apart [Noll et al., 1997]. McGonigle et al. [2000] assessed intersession differences during performance of motor, visual and a simple cognitive task in a single subject scanned 33 times over a 2‐month period. In general, McGonigle et al. [2000] observed relatively consistent patterns of activation in regions expected to be activated based on the extant literature.
Another aspect of reproducibility that has begun to be addressed is replicability of the patterns of activation across research institutions. Casey et al. [1998] have shown that the patterns of activation associated with performance of a spatial working memory task were relatively consistent across four U.S. laboratories despite the fact that the groups employed different MR scanners, data acquisition techniques, and analysis strategies.
To date, no studies have examined reproducibility over time of whole brain (i.e., 145‐mm axial extent) event‐related responses during cognitive paradigms. In particular, brain regions such as the cerebellum, ventrolateral frontal and temporal cortex, medial temporal lobe structures, and subcortical sites have not been examined. Here we present an analysis of the hemodynamic response to low‐probability task‐relevant target stimuli and to low‐probability task‐irrelevant novel stimuli in 10 healthy participants tested in two sessions separated by 6 weeks. This cognitive paradigm is commonly referred to as a three‐tone auditory oddball task [Katayama and Polich, 1996]. There is a long history of oddball paradigms in event‐related potential (ERP) studies [Donchin, 1981; Friedman and Bruder, 1992; Johnson, 1988, 1993; Pritchard, 1981; Ritter and Ruchkin, 1992; Sutton et al., 1965]. The most prominent ERP component elicited by oddball stimuli is the P3. Low‐probability task‐irrelevant novel stimuli elicit a P3 (i.e., P3a) with a more fronto‐central distribution than the canonical parietal distributed P3 (or P3b) elicited by target stimuli. A number of studies have shown that the ERPs elicited by target and novel stimuli are fairly reproducible over time in the same participants [Gordon et al., 1986; Maeda et al., 1995; Pollock and Schneider, 1992; Roth et al., 1975; Sinha et al., 1992; Sklare and Lynn, 1984].
Recent event‐related fMRI studies of the hemodynamic response have shown that multiple neural systems are involved in processing low‐probability target stimuli [Casey et al., 2001; Clark et al., 2000; Kiehl et al., 2001a,b; Kiehl and Liddle, 2001; McCarthy et al., 1997; Menon et al., 1997; Stevens et al., 2000]. These systems include bilateral anterior superior temporal gyrus, inferior and middle frontal gyrus, inferior and superior parietal lobules, anterior and posterior cingulate, thalamus, caudate, and the amygdala/hippocampal complex [Kiehl et al., 2001b]. These latter results largely confirm the intracranial distribution of neural generators activated during performance of similar tasks [Baudena et al., 1995; Clarke et al., 1999; Halgren et al., 1995a,b].
An additional relevant aspect is whether the neural response to target and novel stimuli habituates. Studies have reported that, under some conditions, certain ERP components elicited by oddball stimuli show evidence of habituation both within and across sessions [Polich, 1989; Polich and McIsaac, 1994; Romero and Polich, 1996; Roth et al., 1975]. Polich and colleagues have reported that, in some paradigms at some scalp locations, the P3 elicited by target and novel may habituate over time [Polich, 1989; Polich and McIsaac, 1994; Ravden and Polich, 1998; Romero and Polich, 1996]. Friedman and colleagues have shown that, in younger populations, the novelty P3 habituates at frontal sites during active attention tasks [Friedman et al., 1998; Friedman and Simpson, 1994].
In summary, the objectives of the present experiment were 1) to assess reproducibility of the hemodynamic response elicited by low‐probability task‐relevant target stimuli and low‐probability task‐irrelevant novel stimuli assessed 6 weeks apart, and to assess habituation of the hemodynamic response elicited by target and novel stimuli 2) across sessions and 3) within session during the same scanning period.
Our primary hypothesis was that the patterns of neural activation across the 6‐week time period for both target and novel stimuli would be similar. This hypothesis is based on observations that the hemodynamic response to auditory oddball stimuli appears to be robust across samples of participants [Kiehl et al., 2001a,b; Kiehl and Liddle, 2001] and that ERP components elicited by similar stimuli appear to be reproducible over time [Gordon et al., 1986; Maeda et al., 1995; Pollock and Schneider, 1992; Roth et al., 1975; Sinha et al., 1992; Sklare and Lynn, 1984]. In light of the fact that habituation has been observed within and across sessions for ERP components elicited by target and novel stimuli [Friedman et al., 1998; Friedman and Simpson, 1994; Polich, 1989; Polich and McIsaac, 1994; Romero and Polich, 1996; Roth et al., 1975], it was expected that habituation would be observed at some cerebral sites. However, due to the lack of research knowledge about the involvement of specific cerebral sites in habituation of the P3 ERP components, no hypothesis was made regarding the location of habituation of the hemodynamic response.
SUBJECTS AND METHODS
Subjects
Ten right‐handed [Annett, 1970] individuals (8 male, 2 female; mean age 28.3, SD 10.8) with no history of psychotic illness in self or first‐degree relative participated in two recording periods separated by 6 weeks (median 50 days).
Stimuli and Procedure
During test and retest, two sessions (or runs) of 244 auditory stimuli were presented to each participant by a computer‐controlled auditory sound system via insert earphones within 30 dB sound attenuating headphones. Standard, target, and novel stimuli consisted of 1,000 Hz tones, 1,500 Hz tones, and non‐repeating random noises, respectively. The novel stimuli were created using a mixer board and consisted of tone sweeps, whistles, and similar 200‐msec–duration bursts of complex sound. The target and novel stimuli each occurred with a probability of 0.125; the standard stimuli occurred with a probability of 0.75. The stimulus duration was 200 msec with an 1,800‐msec inter‐stimulus interval (ISI). Target and novel stimuli were always preceded by at least three standard stimuli (range 3–5). The intervals between stimuli of interest (i.e., target and novel stimuli) were allocated in a pseudo‐random manner in the range 6–10 sec so as to ensure that these stimuli had equal probability of occurring at 0, 1, and 2 sec after the beginning of a 3‐sec image‐acquisition period. As a result, the hemodynamic response to each type of stimulus of interest was sampled uniformly at 1‐sec intervals [Josephs et al., 1997]. Participants were instructed to press a button with their right index finger as fast and accurately as possible as soon as they heard a target stimulus and were instructed not to respond to a standard or novel stimuli. A commercially available MR compatible fiber‐optic response device was used to collect behavioral responses (Lightwave Medical, Vancouver, BC, Canada). The stimulus paradigm and data acquisition techniques are described more fully in Kiehl et al. [2001b].
Image Collection and Processing
Imaging was performed with a clinical GE 1.5 T scanner fitted with a Horizon Echo‐Speed upgrade. No software or hardware upgrades occurred between the test and retest period. Functional image volumes were collected with a gradient‐echo sequence (TR/TE 3000/40 msec; flip angle 90 degrees; FOV 24 × 24 cm, 64 × 64 matrix; 62.5 kHz bandwidth, 3.75 × 3.75 mm in plane resolution; 5‐mm slice thickness (axial orientation); 29 slices) effectively covering the entire brain (145‐mm axial extent). During each stimulus run, 167 image volumes were acquired. The first four image volumes were collected to allow T1 effects to stabilize, and were not included in subsequent analyses.
Sessional realignment, nonlinear spatial normalization, and spatial smoothing (Gaussian kernel, FWHM = 8 × 8 × 8 mm) were performed with the software Statistical Parametric Mapping 99 (Wellcome Department of Cognitive Neurology, London, UK). Movement estimates from the sessional realignment indicated that there were no gross head movements in any participant during either test or retest periods. For all sessions, rotation and translation estimates were less than 2.0 mm and 2.0 degrees, respectively.
Low‐pass (fourth order digital Butterworth) and high‐pass frequency filters [Holmes et al., 1997] were applied to remove high‐frequency scanner artifacts and low‐frequency confounds, respectively. To compensate for sessional intensity variations, image volume intensities were scaled so that the means of the global intensities of each session were equal. A modified proportional scaling procedure was employed to control for scan‐to‐scan variability in global signal within session [Desjardins et al., 2001].
Hemodynamic responses to the target and novel stimuli were modeled using a synthetic response function composed of two gamma functions, and a term proportional to its derivative [for mathematical model, see Josephs et al., 1997; for illustration, see Friston et al., 1998]. The latter term was included to model small latency variations. Also included in the model was a condition X time interaction term to assess habituation within session. Responses to the frequent standard stimuli were assumed to form a constant baseline and were not modeled explicitly. Previous analyses have shown that similar results are observed whether or not the frequent standard stimuli are explicitly modeled [Kiehl et al., 2001a,b].
In summary, the multi‐subject (all sessions for all participants for test and retest) statistical analysis was constructed using a design matrix that included separate gamma functions and their respective temporal derivatives for both the target and novel stimuli, and condition X time interactions (i.e., within session habituation) for target and novel stimuli. The resulting SPM (F) contained voxels in which the model accounted for a significant proportion of the variance in the observed data. Ten contrasts were then used to create SPM(t)s for our comparisons of interest. The SPM(t)s were then transformed into SPM(Z)s using a probability integral transformation. The comparisons were: activations for the target stimuli relative to the standard baseline for 1) test and 2) retest; activations for the novel stimuli relative to the standard baseline for 3) test and 4) retest; direct comparison of the amplitude of the hemodynamic response for test vs. retest for 5) target and 6) novel stimuli; within‐session habituation of 7) target and 8) novel stimuli at test and retest; and direct comparison of the amplitude of the hemodynamic response from the first session of test and retest with the amplitude of the hemodynamic response from the second session of test and retest for 9) target and 10) novel stimuli. These latter two comparisons were used to assess habituation of the hemodynamic response across sessions (i.e., during the same day) for target and novel stimuli, respectively.
Conjunction analyses were performed on contrasts 1 and 2, and 3 and 4, to assess reproducibility of target and novel stimuli, respectively [Friston et al., 1999]. Conjunction analyses reveal voxels in which there is activation common to all of the contrasts entered into the analysis and thus provide a simple tool for evaluating reproducibility of the hemodynamic response over time in voxel‐based analyses. For all other comparisons, a correction for multiple comparisons based on the theory of Gaussian fields, modified to incorporate spatial and serial autocorrelated data, was employed [Worsley and Friston, 1995; Worsley et al., 1996].
RESULTS
Behavioral Data
Initial test
The mean reaction time for hits was 436.4 msec (SD 57.0). Target stimuli were correctly classified on 99.6% (SD 0.87) of trials. False alarms were relatively rare, occurring on 0.07% (SD 0.17) and 2.50% (SD 2.37) of standard and novel trials, respectively.
Retest
As with the initial testing session, accuracy was quite high, as participants correctly classified all of the target trials. False alarms occurred on 0.13% (SD 0.28) and 1.25% (SD 2.24) of standard and novel trials, respectively. The mean reaction time for hits was 392.8 msec (SD 64.1).
There were no significant differences between test and retest sessions in reaction times for target classification (t(9) = 1.63, P = 0.138), percentage of correct hits (t(9) = −1.5, P = 0.168), percentage of false alarms for standard (t(9) = −0.557, P = 0.591), or for novel stimuli (t(9) = 1.26, P = 0.239).
Imaging Data
The analyses of the hemodynamic response for target and novel stimuli relative to the standard baseline yielded similar results across test and retest periods. The conjunction analyses revealed that during test and retest, target stimuli were associated with activation in bilateral inferior frontal gyrus, anterior superior temporal gyrus, middle temporal gyrus, inferior and superior parietal lobules, thalamus, putamen, amydgala, and anterior and posterior cingulate. These results replicate the patterns of activation associated with target processing reported in Kiehl et al. [2001a,b]. The similarities between the patterns of activation elicited for target during test and retest are illustrated in Figures 1 and 2, respectively. The conjunction analysis between target stimuli at test and target stimuli at retest is illustrated in Figure 3.
Figure 1.

Illustration of the areas of activation for the comparison of the target stimuli vs. the standard baseline condition for the initial test session. Data are presented in the modified Talairach space employed in SPM99 and displayed on a standard reference brain. The view is in neurological convention (e.g., left hemisphere is on the left). The z levels in Talairach space are listed on each slice. Voxels with activation significant at the level P < 0.05, corrected for multiple comparisons, are shown. Note that the range of the scale in the bottom right corner of Figures 1, 2, 4, and 5 is fixed at 4.50 at the low end and 10.0 at the high end. Figures 3 and 4 also display at a P < .05 corrected level, but the scale is based on the t2 statistic [Price and Friston, 1997; Price, et al., 1997].
Figure 2.

Illustration of the areas of activation for the comparison of the target stimuli vs. the standard baseline condition for the retest session. The planes depicted are identical to those in Figure 1. Voxels with activation significant at the level P < 0.05, corrected for multiple comparisons, are shown.
Figure 3.

Illustration of the results of the conjunction analysis for test and retest for target stimuli. The planes depicted are identical to those in Figure 1. Voxels with activation significant at the level P < 0.05, corrected for multiple comparisons, are shown. Note that the scale is based on the t2 statistic (t2 = 2.98, P < .05, corrected for multiple comparisons).
The direct comparison of the amplitude of the hemodynamic response for target stimuli elicited during test with that elicited during retest failed to produce any significant differences between time periods. Comparison of the amplitude of the hemodynamic response for target stimuli from the first session (run 1 at test and run 1 at retest) with the second session (run 2 at test and run 2 at retest) revealed greater activation during the first session than during the second session in motor cortex (−44, −8, 52; Z‐score = 6.17), supplementary motor cortex (−12, −4, 72; Z‐score = 5.18) and bilateral cerebellum (−8 −68 −16; Z‐score 5.15; 28, −52, −36; Z‐score 4.98). Analyses of the condition X time interactions within session failed to reveal any evidence of habituation for the target stimuli. In addition, no significant habituations were observed within any individual run (run one at test, run two at test, run one at retest, run two at retest).
As with the target stimuli, similar reproducibility of the hemodynamic response was observed for the novel stimuli (see Figs. 4 and 5). The conjunction analyses revealed that for both test and retest sessions, novel stimuli elicited activation in bilateral inferior and middle frontal gyrus, inferior, middle and superior temporal gyrus, bilateral inferior parietal lobule, thalamus, and cuneus (Fig. 6). It is noteworthy that there is an apparent attenuation in the response to novel stimuli at retest, relative to that observed at test. This appears to be due to the stringent statistical threshold employed. That is, if a lower threshold is employed at retest, the two time periods show nearly identical results. This effect is highlighted by the results of the conjunction analyses, which revealed a very consistent pattern of activation for novel stimuli as observed in previous studies [Kiehl et al., 2001b; Kiehl and Liddle, 2000].
Figure 4.

Illustration of the areas of activation for the comparison of the novel stimuli versus the standard baseline condition for the initial test session. The planes depicted are identical to those in Figure 1. Voxels with activation significant at the level P < 0.05, corrected for multiple comparisons, are shown.
Figure 5.
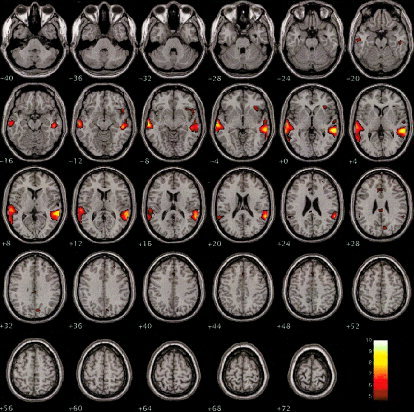
Illustration of the areas of activation for the comparison of the novel stimuli vs. the standard baseline condition for the retest session. The planes depicted are identical to those in Figure 1. Voxels with activation significant at the level P < 0.05, corrected for multiple comparisons, are shown.
Figure 6.

Illustration of the results of the conjunction analysis for test and retest for novel stimuli. The planes depicted are identical to those in Figure 1. Voxels with activation significant at the level P < 0.05, corrected for multiple comparisons, are shown. Note that the scale is based on the t2 statistic (t2 = 2.98, P < .05, corrected for multiple comparisons).
No significant differences were observed between the amplitude of the hemodynamic response elicited by novel stimuli at test and retest. No significant differences were observed for the comparison of the novel stimuli during the first session with that of the second session. However, within session habituation was observed for the novel stimuli in bilateral visual cortex (−24, −88, −24, Z‐score = 6.01; 32, −80, −20; Z‐score = 5.36), and cerebellum (40, −68, −24, Z‐score = 5.44). This latter effect was similar across each individual scanning run (run one at test, run two at test, run one at retest, run two at rest).
DISCUSSION
This study was designed to examine the reproducibility of the event‐related hemodynamic response to auditory low‐probability task‐relevant target stimuli and low‐probability task‐irrelevant novel stimuli assessed 6 weeks apart. The results indicate that the hemodynamic response to target and novel stimuli is reproducible across the 6‐week time period. Indeed, the pattern of activation associated with target detection and novelty processing revealed by the conjunction analyses of the test and retest periods directly replicates the patterns of activation observed for these stimuli in previous studies [Kiehl et al., 2001a,b].
The observed reproducibility occurred despite the potential confounds associated with test–retest studies in fMRI. These confounds include movement artifacts that may differ between test and retest, reliability of slice positioning (test) and repositioning (retest), maintenance of identical stimulus parameters (e.g., fidelity, stimulus durations, etc.), and scanner stability over time. Movement‐related artifacts were alleviated in large part with proper head restraint and with instruction before scanning. Refinement of realignment algorithms also aided in control of confounding movement artifacts [Eddy et al., 1996; Friston et al., 1995, 1996]. In the present experiment, there was no substantial head movement (i.e., greater than 2 mm or 2 degrees) observed in any session for any participant and there were no significant differences in the peak translation or rotation estimates between test and retest.
Slice repositioning is problematic in studies that employ single slice, or even multislice, imaging protocols. However, this issue is largely alleviated in studies that employ whole‐brain measurements. Whole‐brain measurements provide coregistration or spatial normalization algorithms with sufficient information to accurately map images from test and retest into the same space [Friston et al., 1995]. In the present experiment, 145 mm of axial extent was covered. This volume was sufficient to collect the entire brain and cerebellum in all participants. Stimulus presentation limitations can be addressed with proper control over the experimental environment. We employed a custom‐developed visual and auditory presentation package (VAPP, online at http://nilab.psychiatry.ubc.ca/vapp) designed to achieve exact reproducibility. Lastly, scanner stability appears to be most problematic at high fields, while 1.5‐T clinical scanners appear to be fairly stable over time.
Although the hemodynamic response for target detection and novelty processing was reproducible over time, there was some evidence that habituation of the hemodynamic response occurred for both the target and novel stimuli. For the target stimuli, habituation was observed across sessions within each scanning period. This habituation was observed primarily in the motor system, including the postcentral gyrus, medial frontal gyrus, and cerebellum. Habituation in the motor system might reflect an increase in efficiency with practice. For the novel stimuli, habituation was observed within session in visual cortex and cerebellum. It is somewhat surprising that habituation was observed in visual cortex given that the task did not include any visual stimuli. There are a number of potential explanations for this effect. Following the hypothesis put forth by Halgren et al. [1998], Kiehl et al. [2001a,b] interpreted the observed pattern of activation in visual cortex associated with processing of an auditory stimulus as supporting the hypothesis that the brain adopts a strategy of activating all potentially useful brain regions, despite the low probability that these brain regions may be necessary for immediate task performance. The observed pattern of habituation suggests, however, that the visual system may adapt over the course of a session when these brain regions are not needed for task performance. Alternatively, activation in visual brain areas might be related to subtle eye movements or to mental imagery. ERP results from Molholm et al. [2002] suggest that auditory stimuli may activate visual cortex and vice versa, and results from additional studies suggest that significant hemodynamic and electrocortical activity is observed in visual cortex during processing of an auditory stimulus [Benson et al., 2001; Tulving et al., 1994].
Studies of target detection and novelty processing have shown that certain ERP components show evidence of habituation, primarily over prefrontal sites. In the present experiment, there was no strong evidence observed for habituation of the hemodynamic response for target or novel stimuli in prefrontal brain regions. Note that a stringent correction for multiple comparisons was employed to protect against type I errors, which left us with low power to avoid type II errors. Hence, we cannot exclude the possibility of a moderate degree of habituation in prefrontal cortex.
In interpreting the findings, it is necessary to note that this study employed within‐subject analyses to examine repeated measures across time. This is appropriate for determining test–retest reliability and habituation effects, but it should be noted that where significant changes over time were observed (e.g., the habituation effects between or within runs), these changes pertain to the participants in this study. A random‐effects analysis, in which the effects of interest were compared to the variance between subjects, would be required to demonstrate that these specific changes could be generalized to a wider population. However, a random‐effects analysis would have very low power to detect the occurrence of habituation, and hence would face serious risk of a type II error (i.e., a failure to identify a real change). On the other hand, we attempted to minimize the risk of type I error (reporting an effect that arose by chance) by employing a stringent correction for multiple comparisons. The close correspondence between the findings of this study and those of our previous studies [Kiehl et al., 2001a, b] suggests that the level of control over type I and type II errors in detecting sites of activation associated with detection of the stimuli of interest was reasonable. Nonetheless, the use of a stringent correction for multiple comparisons limits the power to detect small amounts of change over time, and the reported sites of significant habituation should be regarded as a conservative estimate of the number of sites at which there was change over time in these participants.
The correlation between predicted hemodynamic responses to targets and novels was −0.6, implying that they shared 36% of their variance. Sharing of variance between the responses to difference stimulus types diminishes the power to discriminate between the brain activity associated with the different types of stimuli. The loss of discriminating power was the same during test and retest, and hence is unlikely to have given rise to spurious systematic differences between the test and retest data. However, in those brain regions where both types of stimulus produced a substantial hemodynamic response, the proportion of the observed hemodynamic response assigned to each stimulus type during the fitting of the linear model would have been prone to random variation due to noise. However, the consistency between test and retest of the fitted hemodynamic response to each type of stimulus in regions where both types of stimuli were associated with significant activation (e.g., lateral frontal cortex and inferior parietal cortex, bilaterally) implies that there was adequate power to provide consistent results in such regions. We cannot exclude the possibility that in regions where a particular stimulus type produced an activation near the limit of detectability, the loss of power due to colinearity between the different stimulus types might have resulted in failure to detect the activation on either one or both scanning days. It is unlikely that the reported habituation effects can be attributed to the effects of colinearity, since these effects were mainly in regions where only one stimulus type produced substantial activation and, furthermore, were consistent at test and retest.
It is also important to note that the present results do not necessarily reflect the neural generators underlying the scalp recorded P3. The time course and nature of the hemodynamic response does not permit inferring that some or all of the regions observed to be activated are related to the generation of the P3. Rather the regions of activation are likely involved in the generation of the entire ERP waveform associated with oddball processing (i.e., N2, P3, and slow wave). It may also be possible that some of the activation is related to hemodynamics per se, and not related to electrical generators.
In summary, the observed pattern of results support the hypothesis that the hemodynamic response to low‐probability target and novel stimuli is reproducible over the 6‐week test–retest period. The patterns of activation associated with target detection and novelty processing observed during test and during retest replicate the patterns of activation observed for these stimuli in previous research [Kiehl et al., 2001a, b]. Furthermore, the spatial locations that we have observed to be activated by target detection and novelty processing are consistent with the intracranial distribution of the neural sources generated during similar tasks [Halgren et al., 1998]. These data support the hypothesis that processing of even simple cognitive tasks is associated with a widespread activation of multiple systems that engage to rapidly evaluate and process stimuli [Halgren et al., 1998].
Acknowledgements
We thank MR technologists Trudy Shaw, Karen Smith, and Sylvia Renneberg for their assistance. K.A.K. was supported by the Michael Smith Graduate Scholarship, Medical Research Council of Canada.
REFERENCES
- Aguirre GK, Zarahn E, D'Esposito M (1998): The variability of human, BOLD hemodynamic responses. Neuroimage 8: 360–369. [DOI] [PubMed] [Google Scholar]
- Annett M (1970): A classification of hand preference by association analysis. Br J Psychol 61: 303–321. [DOI] [PubMed] [Google Scholar]
- Baudena P, Halgren E, Heit G, Clarke JM (1995): Intracerebral potentials to rare target and distractor auditory and visual stimuli. III. Frontal cortex. Electroencephalogr Clin Neurophysiol 94: 251–264. [DOI] [PubMed] [Google Scholar]
- Baumgartner R, Scarth G, Teichtmeister C, Somorjai R, Moser E (1997): Fuzzy clustering of gradient‐echo functional MRI in the human visual cortex. Part I: reproducibility. J Magn Reson Imaging 7: 1094–1101. [DOI] [PubMed] [Google Scholar]
- Benson RR, Whalen DH, Richardson M, Swainson B, Clark VP, Lai S, Liberman AM (2001): Parametrically dissociating speech and nonspeech perception in the brain using fMRI. Brain Language 78: 364–396. [DOI] [PubMed] [Google Scholar]
- Casey BJ, Cohen JD, O'Craven K, Davidson RJ, Irwin W, Nelson CA, Noll DC, Hu X, Lowe MJ, Rosen BR, Truwitt CL, Turski PA (1998): Reproducibility of fMRI results across four institutions using a spatial working memory task. Neuroimage 8: 249–261. [DOI] [PubMed] [Google Scholar]
- Casey BJ, Forman SD, Franzen P, Berkowitz A, Braver TS, Nystrom LE, Thomas KM, Noll DC (2001): Sensitivity of prefrontal cortex to changes in target probability: a functional MRI study. Hum Brain Mapp 13: 26–33. [DOI] [PMC free article] [PubMed] [Google Scholar]
- Clark VP, Fannon S, Lai S, Benson R, Bauer L (2000): Responses to rare visual target and distractor stimuli using event‐related fMRI. J Neurophysiol 83: 3133–3139. [DOI] [PubMed] [Google Scholar]
- Clarke JM, Halgren E, Chauvel P (1999): Intracranial ERPs in humans during a lateralized visual oddball task: II. Temporal, parietal, and frontal recordings. Clin Neurophysiol 110: 1226–1244. [DOI] [PubMed] [Google Scholar]
- Desjardins AE, Kiehl KA, Liddle PF (2001): Removal of confounding effects of global signal in functional magnetic resonance imaging analyses. Neuroimage 13: 751–758. [DOI] [PubMed] [Google Scholar]
- Donchin E (1981): Surprise! … Surprise! Psychophysiology 18: 493–513. [DOI] [PubMed] [Google Scholar]
- Eddy WF, Fitzgerald M, Noll DC (1996): Improved image registration by using Fourier interpolation. Magn Reson Med 36: 923–931. [DOI] [PubMed] [Google Scholar]
- Friedman D, Bruder GE, editors (1992): Psychophysiology and experimental psychopathology: a tribute to Samuel Sutton. New York: New York Academy of Sciences. [PubMed] [Google Scholar]
- Friedman D, Simpson GV (1994): ERP amplitude and scalp distribution to target and novel events: Effects of temporal order in young, middle‐aged and older adults. Cogn Brain Res 2: 49–63. [DOI] [PubMed] [Google Scholar]
- Friedman D, Kazmerski VA, Cycowicz YM (1998): Effects of aging on the novelty P3 during attend and ignore oddball tasks. Psychophysiology 35: 508–520. [DOI] [PubMed] [Google Scholar]
- Friston KJ, Ashburner J, Frith CD, Poline J‐B, Heather JD, Frackowiak RSJ (1995): Spatial registration and normalization of images. Hum Brain Mapp 2: 165–189. [Google Scholar]
- Friston KJ, Williams S, Howard R, Frackowiak RS, Turner R (1996): Movement‐related effects in fMRI time‐series. Magn Reson Med 35: 346–355. [DOI] [PubMed] [Google Scholar]
- Friston KJ, Fletcher P, Josephs O, Holmes A, Rugg MD, Turner R (1998): Event‐related fMRI: characterizing differential responses. Neuroimage 7: 30–40. [DOI] [PubMed] [Google Scholar]
- Friston KJ, Holmes AP, Price CJ, Buchel C, Worsley KJ (1999): Multisubject fMRI studies and conjunction analyses. Neuroimage 10: 385–396. [DOI] [PubMed] [Google Scholar]
- Gordon Eet al, Kraiuhin C, Harris A, Meares RA et al (1986): The differential diagnosis of dementia using P300 latency. Biol Psychiatry 21: 1123–1132. [DOI] [PubMed] [Google Scholar]
- Halgren E, Baudena P, Clarke JM, Heit G, Liégeois C, Chauvel P, Musolino A (1995a): Intracerebral potentials to rare target and distractor auditory and visual stimuli. I. Superior temporal plane and parietal lobe. Clin Neurophysiol 94: 191–220. [DOI] [PubMed] [Google Scholar]
- Halgren E, Baudena P, Clarke JM, Heit G, Marinkovic K, Devaux B, Vignal JP, Biraben A (1995b): Intracerebral potentials to rare target and distractor auditory and visual stimuli. II. Medial, lateral and posterior temporal lobe. Clin Neurophysiol 94: 229–250. [DOI] [PubMed] [Google Scholar]
- Halgren E, Marinkovic K, Chauvel P (1998): Generators of the late cognitive potentials in auditory and visual oddball tasks. Electroencephalogr Clin Neurophysiol 106: 156–164. [DOI] [PubMed] [Google Scholar]
- Holmes AP, Josephs O, Buchel C, Friston KJ (1997): Statistical modelling of low‐frequency confounds in fMRI. Neuroimage 5: s480. [Google Scholar]
- Johnson R, Jr (1988): The amplitude of the P300 component of the event‐related potential: Review and synthesis In Ackles PR, Jennings JR, Coles MGH, editors. Advances in Psychophysiology Greenwich, CT: JAI Press; p 69–138. [Google Scholar]
- Johnson R (1993): On the neural generators of the P300 component of the event‐related potential. Psychophysiology 30: 90–97. [DOI] [PubMed] [Google Scholar]
- Josephs O, Turner R, Friston K (1997): Event‐related fMRI. Hum Brain Mapp 5: 243–248. [DOI] [PubMed] [Google Scholar]
- Katayama J, Polich J (1996): P300 from one‐, two‐, and three‐stimulus auditory paradigms. Int J Psychophysiol 23: 33–40. [DOI] [PubMed] [Google Scholar]
- Kiehl KA, Liddle PF (2000): Effects of task demands on the hemodynamic response to auditory oddball stimuli: An event‐related fMRI study (unpublished data).
- Kiehl KA, Liddle PF (2001): An event‐related fMRI study of an auditory oddball task in schizophrenia. Schizophr Res 2: 159–171. [DOI] [PubMed] [Google Scholar]
- Kiehl KA, Laurens KR, Duty TL, Forster BB, Liddle PF (2001a): An event‐related fMRI study of visual and auditory oddball tasks. J Psychophysiol 21: 221–240. [PubMed] [Google Scholar]
- Kiehl KA, Laurens KR, Duty TL, Forster BB, Liddle PF (2001b): Neural sources involved in auditory target detection and novelty processing: an event‐related fMRI study. Psychophysiology 38: 133–142. [PubMed] [Google Scholar]
- Maeda H, Morita K, Nakamura J, Inoue M, Kinoshita S, Kodama E, Maki S, Nakazawa Y (1995): Reliability of the task‐related component (P3b) of P3 event‐related potentials. Psychiatry Clin Neurosci 49: 281–286. [DOI] [PubMed] [Google Scholar]
- McCarthy G, Luby M, Gore J, Goldman‐Rakic P (1997): Infrequent events transiently activate human prefrontal and parietal cortex as measured by functional MRI. J Neurophysiol 77: 1630–1634. [DOI] [PubMed] [Google Scholar]
- McGonigle DJ, Howserman AM, Athwal BS, Friston KJ, Frackowiak RS, Holmes AP (2000): Variability in fMRI: an examination of intersession differences. Neuroimage 11: 708–734. [DOI] [PubMed] [Google Scholar]
- Menon V, Ford JM, Lim KO, Glover GH, Pfefferbaum A (1997): Combined event‐related fMRI and EEG evidence for temporal‐parietal cortex activation during target detection. Neuroreport 8: 3029–3037. [DOI] [PubMed] [Google Scholar]
- Molholm S, Ritter W, Murray MM, Javitt DC, Schroeder CE, Foxe JJ (2002): Multisensory auditory‐visual interactions during early sensory processing in humans: a high‐density electrical mapping study. Brain Res Cogn Brain Res 14: 115–128. [DOI] [PubMed] [Google Scholar]
- Moser E, Teichtmeister C, Diemling M (1996): Reproducibility and postprocessing of gradient‐echo functional MRI to improve localization of brain activity in the human visual cortex. Magn Reson Imaging 14: 567–579. [DOI] [PubMed] [Google Scholar]
- Noll DC, Genovese CR, Nystrom LE, Vazquez AL, Forman SD, Eddy WF, Cohen JD (1997): Estimating test‐retest reliability in functional MR imaging. II: Application to motor and cognitive activation studies. Magn Reson Med 38: 508–517. [DOI] [PubMed] [Google Scholar]
- Polich J (1989): Habituation of P300 from auditory stimuli. Psychobiology 17: 19–28. [Google Scholar]
- Polich J, McIsaac HK (1994): Comparison of auditory P300 habituation from active and passive conditions. Int J Psychophysiol 17: 25–34. [DOI] [PubMed] [Google Scholar]
- Pollock VE, Schneider LS (1992): Reliability of late positive component activity (P3) in healthy elderly adults. J Gerontol 47: M88–M92. [DOI] [PubMed] [Google Scholar]
- Price CJ, Friston KJ (1997): Cognitive conjunction: A new approach to brain activation experiments. Neuroimage 5: 261–270. [DOI] [PubMed] [Google Scholar]
- Price CJ, Moore CJ, Friston KJ (1997): Subtractions, conjunctions, and interactions in experimental design of activation studies. Hum Brain Mapp 5: 264–272. [DOI] [PubMed] [Google Scholar]
- Pritchard WS (1981): Psychophysiology of P300. Psychol Bull 89: 506–540. [PubMed] [Google Scholar]
- Ramsey NF, Tallent K, Gelderen P, Frank JA, Moonen CT, Weinberger DR (1996): Reproducibility of human 3D fMRI maps acquired during a motor task. Hum Brain Mapp 4: 113–121. [DOI] [PubMed] [Google Scholar]
- Ravden D, Polich J (1998): Habituation of P300 from visual stimuli. Int J Psychophysiol 30: 359–365. [DOI] [PubMed] [Google Scholar]
- Ritter W, Ruchkin DS (1992): A review of event‐related potential components discovered in the context of studying P3 In: David Friedman GEBE, editor. Psychophysiology and experimental psychopathology: a tribute to Samuel Sutton. Annals of the New York Academy of Sciences Vol. 658 New York: NY Academy of Sciences; P 1–32. [DOI] [PubMed] [Google Scholar]
- Rombouts SA, Barkhof F, Hoogenraad FG, Sprenger M, Scheltens P (1998): Within‐subject reproducibility of visual activation patterns with functional magnetic resonance imaging using multislice echo planar imaging. Magn Reson Imag 16: 105–113. [DOI] [PubMed] [Google Scholar]
- Rombouts SARB, Barkhof F, Hoogenraad FGC, Sprenger M, Valk J, Scheltens P (1997): Test‐retest analysis of the activated area in the human visual cortex using functional MR imaging. Am J Neuroradiol 18: 1317–1322. [PMC free article] [PubMed] [Google Scholar]
- Romero R, Polich J (1996): P3(00) habituation from auditory and visual stimuli. Physiol Behavi 59: 517–522. [DOI] [PubMed] [Google Scholar]
- Roth WT, Kopell BS, Tinklenberg JR, Huntsberger GE, Kraemer HC (1975): Reliability of the contingent negative variation and the auditory evoked potential. Electroencephalogr Clini Neurophysiol 38: 45–50. [DOI] [PubMed] [Google Scholar]
- Sinha R, Bemardy N, Parsons OA (1992): Long‐term testetest reliability of event‐related potentials in normals and alcoholics. Biol Psychiatry 32: 992–1003. [DOI] [PubMed] [Google Scholar]
- Sklare DA, Lynn GE (1984): Latency of the P3 event‐related potential: Normative aspects and within‐subject variability. Clin Neurophysiol 59: 420–424. [DOI] [PubMed] [Google Scholar]
- Stevens AA, Skudlarski P, Gatenby JC, Gore JC (2000): Event‐related fMRI of auditory and visual oddball tasks. Magn Reson Imag V 18: 495–502. [DOI] [PubMed] [Google Scholar]
- Sutton S, Baren M, Zubin J, John ER (1965): Evoked potential correlates of stimulus uncertainty. Science 150: 1187–1188. [DOI] [PubMed] [Google Scholar]
- Tulving E, Kapur S, Markowitsch HJ, Craik FI, Habib R, Houle S (1994): Neuroanatomical correlates of retrieval in episodic memory: auditory sentence recognition. Proc Natl Acad Sci USA 91: 2012–2015. [DOI] [PMC free article] [PubMed] [Google Scholar]
- Wexler BE, Fulbright RK, Lacadie CM, Skudlarski P, Kelz MB, Constable RT, Core JC (1997): An fMRI study of the human cortical motor system response to increasing functional demands. Magn Reson Imag 15: 385–396. [DOI] [PubMed] [Google Scholar]
- Worsley KJ, Friston KJ (1995): Analysis of fMRI time‐series revisited: again. Neuroimage 2: 173–181. [DOI] [PubMed] [Google Scholar]
- Worsley KJ, Marrett S, Neelin P, Vandal AC, Friston KJ, Evans AC (1996): A unified statistical approach for determining significant signals in images of cerebral activation. Hum Brain Mapp 4: 58–73. [DOI] [PubMed] [Google Scholar]
- Yetkin FZ, McAuliffe TL, Cox R, Haughton VM (1996): Test‐retest precision of functional MR in sensory and motor task activation. Am J Neuroradiol 17: 95–98. [PMC free article] [PubMed] [Google Scholar]