

Abstract
To address the question of the relationship between the two visual pathways, a ventral stream for object and form vision and a dorsal stream for spatial and motion vision, we measured the spatiotemporal activation patterns in the two pathways responding to an integrated visuospatial task to which form discrimination and spatial location were assigned simultaneously. The two cognitive components of form discrimination and spatial location were interwoven in the task; however, the fMRI data demonstrated that such a task still activated both ventral GTi/GF (the inferior temporal gyrus/the fusiform gyrus) and dorsal Ga/PCu (the angular gyrus/Precuneus), which are supposed to mediate form discrimination and spatial location, respectively. In addition, the source waveforms of the fMRI foci based on the source analysis of the fMRI‐seeded dipole modeling and the moving dipole modeling indicated that in responding to the task combining simultaneously form perception and spatial location, the activity in Ga/PCu begins earlier than that in GTi/GF, but it peaks later and lasts longer. Hum. Brain Mapping 18:79–89, 2003. © 2002 Wiley‐Liss, Inc.
Keywords: visual cortex, ventral stream, dorsal stream, functional MRI, ERP, dipole model, integration of fMRI and ERP, form discrimination, spatial location
INTRODUCTION
Studies of neuroscience, neuropsychology, and, particularly, recent neuroimaging, provide a rich body of literature supporting the hypothesis that visual cortical areas of monkeys as well as humans may be organized into two hierarchically arranged and functionally specialized processing pathways: a ventral stream responsible for form and object perception and a dorsal stream responsible for spatial and motion perception [for a review, see, e.g., Tootell et al., 1996; Ungerleider and Haxby, 1994; Van Essen and DeYoe, 1995]. The ventral stream is also called the occipitotemporal cortical pathway, as it organized hierarchically from areas V1, V2, V4, and further stations in inferior temporal areas; in contrast, the dorsal stream, the occipitoparietal pathway, as it organized hierarchically from areas V1, V2, V3, MT/V5, and further stations in posterior parietal areas. Tremendous research efforts have been made to characterize the dichotomy between the anatomically distinct pathways in terms of functional specialization: for example, the occipitotemporal pathway functions for perceiving form features and object identification, such as shapes, whereas the occipitoparietal pathway functions for perceiving spatial aspects of stimuli, such as spatial location. However, so far there is not very much in the literature concerning the relationship between the two visual pathways, particularly about the causal relationship and time dependence of the activation of the areas in the two pathways. Nevertheless, unless the regulation of interactions between the two visual pathways is well established, the theory of the two visual pathways is far from final or complete.
To address the question of what is the relationship between the two visual pathways, we designed stimulus tasks to which are simultaneously assigned two kinds of attributes, supposed to be mediated by the two separate visual pathways, respectively. For example, our previous study [Wang et al., 1999] designed stimuli of kinetic forms, that is, stimuli of “forms defined by motion,” to which two variables of “form” and “motion” were assigned simultaneously. As commonly accepted, form discrimination and motion detection are mediated by the ventral pathway and the dorsal pathway, respectively. These stimulus tasks raised a stimulating and pertinent question for investigating relations between the two visual pathways: supposing shape and motion are processed separately in the two visual pathways, how do respective cortex areas located in the two separate pathways respond to the stimuli of “forms defined by motion”?
The present study, following the same paradigm, designed a new kind of visuospatial task involving another pair of attributes, that is, shape and location, which are also commonly supposed to be mediated by the two visual pathways, respectively: shape discrimination will be performed by the occipitotemporal pathway, and in contrast, spatial location, by the occipitoparietal pathway. In this task, subjects were required to make shape discrimination and spatial location simultaneously; for example, to determine the spatial location of a shape (e.g., at the left or right side of the visual field) based on discrimination of this shape (e.g., a triangle or a disk). Given that the occipitotemporal pathway functions for form perception and the occipitoparietal pathway functions for spatial location, how do the two separate pathways respond when a task combines simultaneously form perception and spatial location, that is, “locating a shape based on discriminating the shape”? A task that involves both shape discrimination and spatial location would, therefore, provide a good opportunity to investigate the relationship between the two visual pathways, through observing the interaction and dynamic processes between foci activated by the task involving “form discrimination plus spatial location.”
Another source of difficulty in studying the relations between the two pathways may come from a lack of noninvasive neuroimaging technologies, which are powerful enough to investigate functional localization and temporal interaction of brain areas with both high spatial and temporal resolution. Even though current functional magnetic resonance imaging (fMRI), among other neuroimaging methods, has enjoyed the most technical advancement in providing high spatial resolution views of active brain areas [e.g., Belliveau et al., 1991; Kwong et al., 1992], its temporal resolution is limited by the hemodynamic responses to the order of a few hundred milliseconds, and is not satisfactory for recording the temporal aspects of brain activities. In contrast, event‐related potential (ERP) recording has typically capitalized on its high temporal resolutions of milliseconds, and, therefore, is suitable for characterizing temporal sequencing and dynamic mechanisms underlying cognitive processes, but to increase its simultaneous recording sites even to as many as 128 channels can improve its spatial resolution of source localization up to only the order of centimeters. It is interesting to see that although no two neuroimaging methods available now reflect identical physiological processes or physical parameters, replications of functionally specific brain maps by different methods indicate sufficient common ground for integrating different neuroimaging technologies [e.g., Ahlfors et al., 1999; Ball et al., 1999; Dale et al., 2000; Fox et al., 1994; McCarthy, 1999; Menon et al., 1997; Simpson et al., 1995], which each possess advantages of either high spatial resolution or high temporal resolution. In the present study, fMRI and high‐resolution (128‐channel) ERP were integrated in order to measure the spatiotemporal activation pattern in the two pathways, which responded to the integrated task of “locating a shape based on discriminating the shape” with millisecond timing and subcentimeter spatial localization.
SUBJECTS AND METHODS
Subjects
Seven right‐handed subjects (4 males, 3 females, mean age 24 years, range 28–20 years) were recruited from the Graduate School, University of Science and Technology of China. All subjects had normal or corrected‐to‐normal vision. They all gave informed consents prior to undergoing these experiments.
Stimuli and tasks
Three types of stimulus displays, illustrated in Figure 1, were used: stimulus A, a triangle and a disk each presented at either the left or the right visual fields; stimulus B, two identical figures, triangles or disks, each presented at the left and the right field, respectively; and stimulus C, only a fixation point located at the middle of the display frame. For stimulus A, subjects were asked to report which side of the visual field one of the two figures (either the triangle or the disk) was located at. In contrast, for stimulus B, subjects were asked to report which shape the two identical figures were. In both conditions, the subjects made their responses by pressing one of two buttons. Stimulus C was presented as a base‐line, and subjects were required only to look at the fixation point without making any response except pressing one of the two buttons alternately for each presentation. Since with stimulus A performance of subjects would involve both form discrimination and spatial location, stimulus A was abbreviated as “form plus location.” In the same way, stimulus B, was “form only,” and stimulus C was “fixation only.” Each triangle or disk subtended an angle of 4 × 4 degrees, the distance between the centers of two figures subtended 9 degrees. At the center of the display field of each stimulus, a green cross subtending an angle about 0.5 × 0.5 degrees was presented as the fixation. During each trial, subjects were asked to concentrate their eyes on the fixation. The presentation of each stimulus lasted for 200 msec, and the intervals between two presentations varied randomly between 1,200–1,500 msec. All the stimuli were white on a uniform black background.
Figure 1.
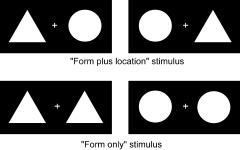
The two types of stimuli displays used.
Using these stimulus displays, three experiments were designed: Experiment 1: “form plus location” vs. “fixation only”; Experiment 2: “form plus location” vs. “form only”; and Experiment 3: “form only” vs. “fixation only”.
Experiment 1 served as a major test to locate activation foci in the two pathways involved in both form discrimination and spatial location. As a control, Experiment 2 further tested, with respect to spatial location, the functional anatomical dichotomy of form discrimination and spatial location found in Experiment 1, and Experiment 3, as one more control, also tested the dichotomy but with respect to form discrimination.
MRI scanning
The subjects were scanned on a 1.5 T GE Signa scanner with a standard GE birdcage‐type RF coil. Vacuum mattresses were used to position and fix the head of each subject to prevent artifacts due to head movements. The visual stimuli were projected on a translucent screen located at the front of the bore of the magnet, and the subjects were able to look at the stimulus displays through a mirror mounted on the head coil. The subjects were instructed to lie as still as possible and to concentrate on viewing the stimuli with fixating on the green cross during scan.
The BOLD‐contrast functional imaging used a single‐shot, T2*‐weighted EPI sequence (TR: 2000 msec, TE: 40 msec, FOV: 25 × 25, Matrix: 64 × 64, Flip angle: 60 degrees) to acquire a set of 15 oblique axial slices (7 mm thk/0.5 mm sp or 5 mm thk/2.5 mm sp, from superior to inferior; AC–PC line is located at the 10th slice). For each subject, 3 runs (65 sec per run) were performed for each stimulus to acquire 48 (16 × 3) images in one slice. The first 2 of 16 images of each run were discarded to eliminate the effects of EPI onset. To balance the order of stimuli, the 9 runs were scanned in random order. Before each run, the subjects were told which stimulus would be presented, and MR scan started after the stimulus had been presented 20 sec to saturate the cerebral blood oxygenation. At least 30‐sec rest intervals were given between two runs. High resolution anatomic images (T1‐weighted, 63 oblique axial slices, 2.0 mm thk/0.5 mm sp, FOV: 25 × 25 cm, Matrix: 256 × 256] were obtained to identify landmarks associated with the neural activity found in the functional images.
Analysis of fMRI data
The raw MR images were rearranged offline according to the three designed experiments and analyzed by cross‐correlating each pixel time course with a boxcar reference waveform by AFNI [Cox, 1996]. For single subject, only pixels with a correlation coefficient larger than 0.4 (P < 0. 0001) were taken as significant activation, which were overlaid on the T1‐weighted image to anatomically illustrate activation sites. To access the consistency of activation, individual data sets were transformed to Talairach coordinates [Talairach and Tournoux, 1988] through manually defined landmarks, followed by co‐averaging across subjects to generate averaged correlation coefficient maps.
Movies furnishing a dynamic view of head motion were run of all raw images per slice. When image head motion was greater than 1 pixel, or when it was not corrected by the reregistration algorithms (2D in‐plane), the images were discarded. Two regions of interest (ROIs), that is, the inferior parietal and posterior parietal areas (Ga/PCu) in the dorsal pathway, and the inferior temporal and occipitotemporal areas (GTi/GF) in the ventral pathway, were selected for each subject. Based on the averaged time courses across activated voxels in each ROI, the MR signal enhancement was calculated by subtracting the averaged baseline from the averaged activation. The MR signal enhancements of each subject were entered into an analysis of variance to determine the task‐related difference.
ERP recording
The ERPs elicited by the two stimuli of “form plus location” and “form only,” which are the same stimuli used in the fMRI scanning, were recorded in a separate session with the same 7 subjects as that scanned in the fMRI studies. Four blocks, each of which consisted of 100 trials, were run for each stimulus. With a 128‐channel EEG system (NeuroScan; Neurosoft, El Paso, TX), electrical potentials (referenced to linked left and right ears, bandpass filter 0.1–40 Hz, sampling rate 250 Hz) were recorded from 120 scalp positions equally distributed over both hemispheres. The horizontal and vertical EOG signals were recorded by the remaining 6 electrodes to reject trails contaminated with blinks or eye movements (exceeding 100 uv) from further analysis. The positions of the three fiducial points (nasion and preauricular points) and all electrodes were measured by 3DSPACE ISOTRACKII digitizer.
ERP source analysis
Source analysis was constrained by seeding with fMRI activation foci with CURRY (Neuroscan; Neurosoft) and EMSE [Greenblatt, 1993]. This method places a proposed set of voltage dipoles in a three‐shell spherical head model, and adjusts the strengths and orientations of the dipoles iteratively to obtain the best possible fit between the observed and computed voltage distributions [Scherg and Berg, 1991]. For each subject, coregistration of the ERP electrode reference frame with the MRI reference frame was accomplished by transformation matrices derived from common fiducial points in the two reference frames. For the grand‐average data, the coregistration was accomplished with the average fiducial points in the ERP frame and the MRI reference frame of one subject. Previous neuroimaging studies consistently demonstrated that cortical areas in ventral GTi/GF mediate shape recognition [e.g., Haxby et al., 1991; Kanwisher et al., 1997], and cortical areas in dorsal Ga/PCu mediate spatial location [e.g., Faillenot et al., 1999; Haxby et al., 1991]. This provided a biological initial guess for the dipole locations, thus alleviating the problem of local minima inherent in non‐linear fitting procedure [e.g., Dale and Halgren, 2001; Liu et al., 1998]. Thus, the two activation foci in GTi/GF and Ga/PCu found in the present fMRI study were chosen to seed the positions of dipoles in the fMRI‐seeded dipole modeling [e.g., Heinze et al., 1994; Mangun et al., 1998; Wang et al., 1999; Woldorff et al., 1997]. Using Curry, the fMRI‐seeded dipole modeling as well as the moving dipole modeling was applied, and their results of RV (residual variance) curves as well as dipole locations were compared to evaluate the validity of fMRI‐constrained source analysis. Using EMSE, the fixed dipole modeling with position and orientation constraints was applied, and the source waveforms were obtained to determine the spatiotemporal activation patterns in the two visual pathways.
RESULTS
Behavioral results
The behavioral responses of seven subjects to the two tasks were also measured in ERP recording. The reaction times for the task of “form plus location” and for the task of “form only” were 315 msec (error rate = 3.8%) and 374 msec (error rate = 5.2%), respectively. There was significant difference between them (P < 0.05).
fMRI results
Experiment 1. “form plus location” vs. “fixation only”
As shown in Figure 2, in responding to the task of Experiment 1, in which both the form discrimination and the spatial location were involved, in addition to activations in the posterior occipital areas (including the primary visual cortex and the lingual gyrus), significant activations were found bilaterally in GTi/GF of the ventral pathway, and bilaterally in Ga/PCu of the dorsal pathway. The activated areas in GTi/GF reported in the present fMRI study were in good agreement with the activated areas reported before for visual shape recognition [e.g., Haxby et al., 1991; Kanwisher et al., 1997]. The Talairach coordinates of the average centers of the activated ventral areas were (x = 17 y = −57 z = −12) in the right hemisphere and (x = −24 y = −58 z = −8) in the left hemisphere (corresponding to BA 19/37). The activated areas in Ga/PCu were in good agreement with the areas reported before for spatial perception [e.g., Faillenot et al., 1999; Haxby et al., 1991]. The Talairach coordinates of the average centers of the activated dorsal areas were (x = 27 y = −60 z = 28) in the right hemisphere and (x = =33 y = =38 z = 26) in the left hemisphere (corresponding to BA 7/31).
Figure 2.

Averaged correlation coefficient maps of fMRI for the three experiments. The functional maps are shown superimposed upon transverse sections of an individual MR‐image that had been Talairach normalized. The axial slices at z = 28 and z = −12 are shown.
These data indicated that the task that integrated two cognitive components of form discrimination and spatial location, indeed, activated both GTi/GF in the ventral stream for object vision and Ga/PCu in the dorsal stream for spatial vision. These two activated areas of GTi/GF and Ga/PCu were, therefore, selected as the regions of interest for calculating their activation levels and further analyzing their task‐related differences. The averaged MR signal enhancements in GTi/GF and in Ga/PCu were 2.46 and 2.12%, respectively (Fig. 3).
Figure 3.
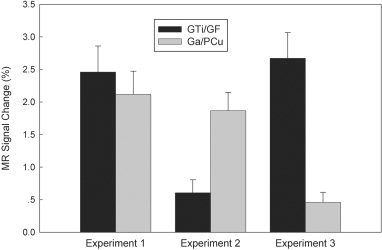
The averaged MR signal enhancements elicited by the three experiments in the two ROIs (GTi/GF and Ga/PCu).
Experiment 2. “form plus location” vs. “form only”
Experiment 2 was designed to measure the activation pattern of cortical areas involved in spatial location perception alone. In addition to activations in the posterior occipital areas, significant activation was found bilaterally in Ga/PCu. The Talairach coordinates of the average centers of these activated dorsal areas are (x = 22 y = −67 z = 28) in the right hemisphere and (x = −18 y = −62 z = 31) in the left hemisphere. However, little activation was found in GTi/GF, where significant activation was found in Experiment 1. Figure 3 shows that the averaged MR signal enhancement in Ga/PCu was 1.87%, whereas the enhancement in GTi/GF was only 0.61%.
Experiment 3. “form only” vs. “fixation only”
As emphasized before, Experiment 3, as a control, was designed to measure activation of cortical areas involved in form discrimination alone. In addition to activations in the posterior occipital areas, significant activation was found bilaterally in GTi/GF. However, little activation was found in Ga/PCu, where significant activation was found in Experiment 1 and 2. The Talairach coordinates of the averaged centers of the activated occipitotemporal areas were (x = 31 y = −68 z = −10) in the right hemisphere and (x = −23 y = −71 z = −8) in the left hemisphere. These activated areas were close to and overlapped the activated ventral areas in GTi/GF reported in Experiment 1. Figure 3 shows that the averaged MR signal enhancement in GTi/GF was 2.67%, whereas the enhancement in Ga/PCu was only 0.46%.
Statistical analysis of fMRI data
To analyze the activation differences between the two tasks, the repeated measures general linear model was used to analyze the activation levels of MR signal enhancements in GTi/GF and Ga/PCu across the two tasks. A two‐way ANOVA with the two factors of ROI (GTi/GF, Ga/PCu) and Task (Task 1: form plus location; Task 2: form only) was undertaken. Significant main effects were found for the both the factors [factor of ROI, F(1, 6) = 19.6, P < 0.005; factor of Task, F(1, 6) = 12.2, P < 0.02]. Significant ROI × Task interaction was also found [F(1, 6) = 23.2, P < 0.005]. The separate analysis (pairwise t‐test) showed that the activation levels in GTi/GF differed significantly between Experiment 1 and Experiment 2 [P < 0.005], and between Experiment 2 and Experiment 3 [P < 0.003], but no significant difference was found between Experiment 1 and Experiment 3 [P > 0.1]. This analysis also showed that the activation levels of Ga/PCu differed significantly between Experiment 1 and Experiment 3 [P < 0.005], and between Experiment 2 and Experiment 3 [P < 0.02], but no significant difference was found between Experiment 1 and Experiment 2 [P > 0.4].
fMRI‐constrained ERP source analysis
The inverse source modelings were applied to the ERP signals in terms of multiple equivalent current dipoles [Hämäläinen et al., 1993; Scherg, 1990) in three subsequent steps improving the accuracy. Firstly, the grand‐average ERPs were used to get the maximal signal‐noise ratios for dipole modeling [Supek and Aine, 1993]. Secondly, the fMRI‐seeded dipole modeling as well as the free‐moving dipole modeling was performed to evaluate the validity of fMRI‐constrained source analysis. Finally, for the purpose of measuring the spatiotemporal activation patterns of the two visual pathways, the fMRI‐constrained fix dipole modeling was applied to obtain source waveforms.
The results from the fMRI‐constrained source analysis of the grand‐average ERPs in responding to the task of “form plus location” were shown in Figure 4. For the fMRI‐seeded dipole modeling, the average fMRI foci in GTi/GF and Ga/PCu reported in Experiment 1 were set as the positions of dipoles whose orientations and strengths were allowed to vary. Three kinds of fMRI‐seeded dipoles were applied: a single pair of dipoles placed at GTi/GF, a single pair of dipoles placed at Ga/PCu, and two pairs of dipoles placed at GTi/GF and Ga/PCu, respectively. As shown by the RV curves in Figure 4a, the pair of seeded dipoles at GTi/GF yielded good fit in the time interval of 136–172 msec (the average RV = 2.02%) and reached the best fit point at 148 msec (RV = 1.43%), and the pair of seeded dipoles at Ga/PCu yielded good fit in the time interval of 280–312 msec (the average RV = 6.24%) and reached the best fit point at 296 msec (RV = 5.74%). The combination of the dipole pairs placed at GTi/GF and Ga/PCu also yielded good fit in these two time intervals (the average RVs are 1.36 and 5.12%, respectively), and reached the two best fit points at the same times as that of the dipoles placed at GTi/GF and at Ga/PCu, respectively (148 msec, RV = 1.11%; 296 msec, RV = 4.98%). For the moving dipole modeling, using a pair of moving dipoles, the RV curve also yielded good fit in the two time intervals of 132–176 msec and 280–312 msec (the average RVs are 1.42 and 5.03%, respectively), and reached two best fit points (152 msec, RV = 1.24%; 312 msec, RV = 4.85%), which are quite close to those obtained by the fMRI‐seeded dipoles, respectively. The RV curve of the moving dipoles in comparison with the RV curve of the two pairs of the fMRI‐seeded dipoles was shown in Figure 4b. In the time intervals of 136–172 msec and 280–312 msec, the positions of the pair of moving dipoles were near the fMRI foci in GTi/GF and Ga/PCu, respectively: the average distances are 13.2 mm for the left GTi/GF, 16.4 mm for the right GTi/GF, 10.2 mm for the left Ga/PCu, and 13.7 mm for the right Ga/PCu (see Tables I and II). Such distances, which fall within the range of spatial resolution for a 128‐channel ERP recording system, were similar to those reported by previous comparisons between high‐resolution EEG and fMRI [e.g., Gerloff et al., 1996; Grimm et al., 1998]. These data consistently suggested that the fMRI activation foci found in Experiment 1 were the major source of the ERPs obtained in the present study and supported the validity of using the fMRI foci to constrain the ERP source analysis.
Figure 4.
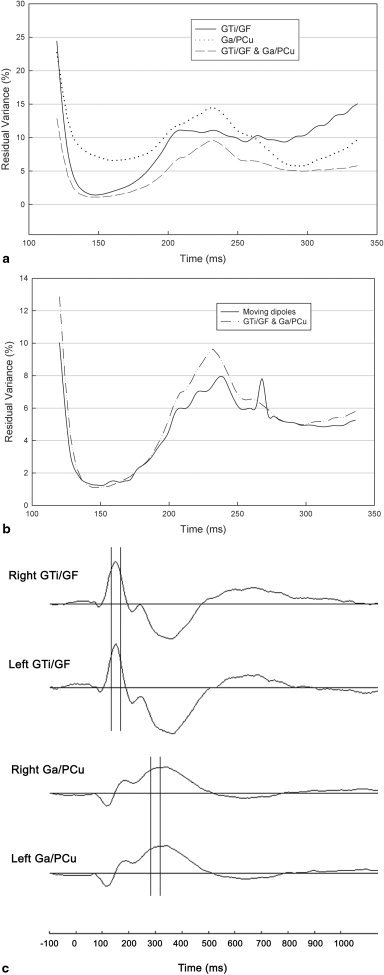
Results from the fMRI‐constrained source analysis of the grand‐average ERPs in response to the task of “form plus location”. a: Curves of residual variance (RV) resulted from the three kinds of fMRI‐seeded dipole modeling. b: Curve of RV of the moving dipoles in comparison with that of the two pairs of the fMRI‐seeded dipoles. c: The source waveforms of the two pairs of the fixed dipoles at GTi/GF and Ga/PCu, respectively.
Table I.
Residual variance values and the distances between the fMRI‐seeded dipoles and the moving dipoles in the time interval of 136–172 msec, in responding to the task of “form plus location”
| Time (msec) | RV (%) | Distance (mm) | |||
|---|---|---|---|---|---|
| GTi/GF | GTi/GF and Ga/PCu | Moving dipoles | Left | Right | |
| 136 | 2.61 | 1.62 | 1.58 | 26.5 | 21.8 |
| 140 | 1.89 | 1.27 | 1.39 | 13.0 | 10.4 |
| 144 | 1.52 | 1.11 | 1.28 | 5.1 | 5.7 |
| 148 | 1.43 | 1.11 | 1.25 | 4.0 | 3.6 |
| 152 | 1.51 | 1.13 | 1.24 | 5.4 | 6.2 |
| 156 | 1.70 | 1.19 | 1.43 | 24.3 | 33.3 |
| 160 | 1.95 | 1.31 | 1.51 | 22.9 | 34.5 |
| 164 | 2.22 | 1.47 | 1.43 | 10.2 | 13.6 |
| 168 | 2.51 | 1.61 | 1.51 | 10.9 | 16.3 |
| 172 | 2.87 | 1.80 | 1.61 | 12.7 | 18.3 |
| Mean | 2.02 | 1.36 | 1.42 | 13.5 | 16.4 |
RV, residual variance; GTi, inferior temporal gyrus; GF, fusiform gyrus
Table II.
Residual variance values and the distances between the fMRI‐seeded dipoles and the moving dipoles in the time interval of 280–312 msec, in responding to the task of “form plus location”
| Time (msec) | RV (%) | Distances (mm) | |||
|---|---|---|---|---|---|
| Ga/PCu | GTi/GF and Ga/PCu | Moving dipoles | Left | Right | |
| 280 | 6.61 | 5.32 | 5.29 | 15.45 | 13.18 |
| 284 | 6.14 | 5.17 | 5.17 | 12.76 | 13.25 |
| 288 | 5.87 | 5.11 | 5.12 | 9.92 | 13.15 |
| 292 | 5.78 | 5.08 | 5.08 | 6.28 | 13.25 |
| 296 | 5.74 | 4.98 | 4.95 | 3.89 | 12.28 |
| 300 | 5.93 | 5.00 | 4.95 | 5.49 | 12.16 |
| 304 | 6.36 | 5.11 | 4.95 | 9.14 | 13.87 |
| 308 | 6.76 | 5.18 | 4.89 | 13.59 | 15.69 |
| 312 | 6.94 | 5.15 | 4.85 | 15.48 | 16.53 |
| Mean | 6.24 | 5.12 | 5.03 | 10.2 | 13.7 |
Ga, angular gyrus; PCu, Precuneus.
For obtaining source waveforms, a pair of fixed dipoles placed at the average fMRI foci in GTi/GF or Ga/PCu was further applied to the grand‐average ERPs. The source waveforms of the fMRI foci were shown in Figure 4c: the ventral GTi/GF activation appeared to start at ∼110 msec but reached a negative peak at ∼160 msec bilaterally, whereas the dorsal Ga/PCu activation appeared to start at ∼90 msec but reached a smaller positive peak at ∼120 msec and a later larger negative peak at ∼330 msec bilaterally. The largest peak latencies of the source waveforms were close to the best‐fit latencies of the seeded and moving dipoles, and the pair of fixed dipoles were able to account more than 95% of the variance in the best‐fit time intervals (GTi/GF, 97.8%, in the time interval of 136–172 msec; Ga/PCu, 96.6%, in the time interval of 280–312 msec).
The above inverse source analyses were also performed on the grand‐average ERPs elicited by the task of “form only.” Figure 5a showed the RV curves resulted from the pair of fMRI‐seeded dipoles at GTi/GF and from the pair of moving dipoles: the pair of seeded dipoles at GTi/GF yielded good fit in the time interval of 140–184 msec (the average RV = 2.30%) and reached the best fit point at 168 msec (RV = 1.90%), and the pair of moving dipoles also yielded good fit in the time interval of 140–184 msec (the average RV = 1.61%) and reached the best fit point at 160 msec (RV = 1.31%). In the time interval of 140–184 msec, the positions of the pair of moving dipoles were near the fMRI foci in GTi/GF: the average distances between them and the fMRI foci are 15.3 mm in the left hemisphere and 7.2 mm in the right hemisphere, respectively (see Table III).
Figure 5.
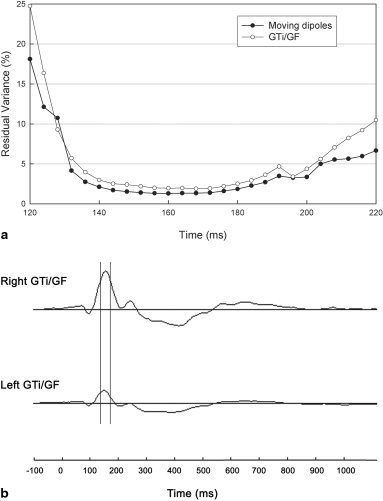
Results from the fMRI‐constrained source analysis of the grand‐average ERPs in response to the task of “form only.” a: Curve of RV resulted from the fMRI‐seeded dipole modeling in comparison with that from the moving dipole modeling. b: The source waveforms of the pair of fixed dipoles at GTi/GF.
Table III.
Residual variance values and the distances between the fMRI‐seeded dipoles and the moving dipoles in the time interval of 140–184 msec, in responding to the task of “form only”
| Time (msec) | RV (%) | Distance (mm) | ||
|---|---|---|---|---|
| GTi/GF | Moving dipoles | Left | Right | |
| 140 | 2.99 | 2.12 | 15.68 | 12.50 |
| 144 | 2.52 | 1.72 | 14.91 | 7.72 |
| 148 | 2.42 | 1.54 | 16.15 | 5.76 |
| 152 | 2.20 | 1.41 | 15.08 | 4.31 |
| 156 | 2.00 | 1.33 | 14.75 | 3.00 |
| 160 | 1.97 | 1.31 | 15.13 | 3.55 |
| 164 | 1.98 | 1.34 | 15.60 | 4.72 |
| 168 | 1.90 | 1.35 | 14.69 | 6.12 |
| 172 | 1.94 | 1.39 | 15.11 | 7.90 |
| 176 | 2.20 | 1.61 | 14.26 | 8.35 |
| 180 | 2.52 | 1.86 | 17.34 | 10.85 |
| 184 | 2.93 | 2.28 | 15.15 | 11.89 |
| Mean | 2.30 | 1.61 | 15.3 | 7.2 |
Figure 5b showed the source waveforms obtained with the pair of fixed dipoles placed at GTi/GF: the ventral GTi/GF activation appeared to start at ∼110 msec and reached a negative peak at ∼150 msec bilaterally. The fixed dipoles at GTi/GF were able to account 96.8% of the variance in the time interval of 140–184 msec. Such temporal activation pattern of ventral GTi/GF in responding to the task of form only, was consistent with the temporal activation pattern of GTi/GF in responding to the task of “form plus location.”
DISCUSSION AND CONCLUSION
The hypothesis of the two visual pathways has been supported by studies with various approaches and paradigms [for a review, see, e.g., Tootell et al., 1996; Ungerleider and Haxby, 1994; Van Essen and DeYoe, 1995). What makes our present fMRI study of the two visual pathways interesting is that it measured the activation pattern of cortical areas in responding to the task that integrated two cognitive components of form discrimination and spatial location. Our fMRI results demonstrated that while the component of form discrimination alone mainly activated ventral GTi/GF, and the component of spatial location alone mainly activated dorsal Ga/PCu, the present task, which involved both form discrimination and spatial location, activated both ventral GTi/GF and dorsal Ga/PCu. It is worth nothing that these fMRI results strengthen the hypothesis of the two visual pathways in the following two senses. First, the results indicate that, with respect to the variables of shape discrimination and spatial location, the hypothesis of the dichotomy was justified not only under the condition of responding to a single variable, as in most previous studies [e.g., Faillenot et al., 1999; Haxby et al., 1991; Kanwisher et al., 1997; Shen et al., 1999], but also under the condition of responding to the two interwoven variables integrated in one task that is more likely to occur in the natural environment. Second, the result obtained from the cognitive subtraction of the form discrimination component from the integrated two components (form discrimination and spatial location) indicates that the dichotomy of the two visual pathways is valid in the sense of “pure insertion” [Sternburg, 1969], that is, the cognitive component of form discrimination can be added to the preexisting cognitive component of spatial location without affecting the expression of spatial location in producing activation patterns in the two visual pathways.
As pointed out by, for example, Liu et al. [1998], although techniques have been proposed for estimating the number of assumed dipoles [Gorodnitsky et al., 1995; Mosher et al., 1992; Supek and Aine, 1993], the actual number of dipoles generally cannot be determined a priori. To deal with this inherent difficulty, we varied the methods of source analysis as widely as we could to maximize the gain from converging operations. Firstly, the prior biological knowledge about the functional anatomy in the two visual pathways was used to provide an objective initial constraint for the dipole locations. Secondly, the fMRI‐seeded dipole modeling was applied. Finally, the moving dipole modeling without fMRI constrains was applied for the comparison. On the basis that the convergent results obtained by these methods supported the validity of using these fMRI foci to constrain the ERP source analysis, we further applied source waveforms to characterize the time processing. In responding to the tasks involving in form discrimination, the source waveforms consistently indicated that the activation in ventral GTi/GF appeared to start at ∼110 msec and peaked at ∼160 msec, and in responding to the task involving both form discrimination and spatial location, the activation in dorsal Ga/PCu appeared to start at ∼90 msec and peaked at ∼330 msec. This result that the dorsal pathway started to activate ∼20 msec prior to the ventral pathway was consistent with the dorsal/ventral latency advantage reported by previous animal studies using a variety of stimulation and recording methods [e.g., Schroeder et al., 1998; for a review, see Nowak and Bullier, 1997]. On the other hand, the results that the peak latencies in the source waveforms were close to the best‐fit latencies in the RV curves in return support the validity of the fMRI‐constrained source analysis used in the present study. Our present results are consistent with the following evaluation that “In some cases, the technique of 'seeded dipoles' can lead to significant conclusions regarding neurocognitive processing mechanisms that cannot be obtained when using either hemodynamic or electromagnetic techniques in isolation” [Dale and Halgren, 2001].
In summary, the main results, found by fMRI and integrating fMRI and ERP recording, are that (1) the dichotomy of the two visual pathways is valid in the sense of “pure insertion” [Sternburg, 1969], namely, that when form and spatial location are the combined features, the expressed activity in the two visual pathways of the cortex is the simple sum of the activities produced by either a form task (in the ventral “what”, or visual form pathway) or a spatial location task (in the dorsal “where”, or visual spatial pathway) alone, (2) in responding to the task combining simultaneously form perception and spatial location, that is, “locating a shape based on discriminating the shape,” the activity in the dorsal “where” pathway begins earlier than that in the ventral “what” pathway, but it peaks later and lasts longer. Such findings strengthened the hypothesis of the two visual pathways in the sense of “pure insertion” as well as both functional anatomic localization and temporal processes.
Acknowledgements
We are grateful to Dr. Jiongjiong Wang and Dr. Shimin Fu for their helpful comments.
REFERENCES
- Ahlfors SP, Simpson GV, Dale AM, Belliveau JW, Liu AK, Korvenoja A, Virtanen J, Huotilainen M, Tootell RB, Aronen HJ, Ilmoniemi RJ. 1999. Spatiotemporal activity of a cortical network for processing visual motion revealed by MEG and fMRI. J Neurophysiol 82: 2545–2555. [DOI] [PubMed] [Google Scholar]
- Ball T, Schreiber A, Feige B, Wagner M, Lücking CH, Feige RK. 1999. The role of high‐order motor areas in voluntary movement as revealed by high‐resolution EEG and fMRI. Neuroimage 10: 682–694. [DOI] [PubMed] [Google Scholar]
- Belliveau JW, Kennedy DN, Mckinstry RC, Buchbinder BR, Weisskoff RM, Cohen MS, Vevea JM, Brady TJ, Rosen BR. 1991. Functional mapping of the human visual cortex by magnetic resonance imaging. Science 254: 716–719. [DOI] [PubMed] [Google Scholar]
- Cox RW. 1996. AFNI: Software for analysis and visualization of functional magnetic resonance neuroimages. Comp Biomed Res 29: 162–173. [DOI] [PubMed] [Google Scholar]
- Dale AM, Halgren E. 2001. Spatiotemporal mapping of brain activity by integration of multiple imaging modalities. Curr Opin Neurobiol 11: 202–208. [DOI] [PubMed] [Google Scholar]
- Dale AM, Liu AK, Fischl BR, Buckner RL, Belliveau JW, Lewine JD, Halgren E. 2000. Dynamic statistical parametric mapping: combining fMRI and MEG for high‐resolution imaging of cortical activity. Neuron 26: 55–67. [DOI] [PubMed] [Google Scholar]
- Faillenot I, Decety J, Jeannerod M. 1999. Human Brain activity related to the perception of spatial features of objects. Neuroimage 10: 114–124. [DOI] [PubMed] [Google Scholar]
- Fox PT, Woldorff MG. 1994. Integrating human brain maps. Curr Opin Neurobiol 4: 151–156. [DOI] [PubMed] [Google Scholar]
- Gerloff Ch, Grodd W, Altenmüller E, Kolb R, Naegele Th, Klose U, Voiget K, Dichgans J. 1996. Corresgistartion of EEG and fMRI in a simple motor task. Hum Brain Mapp 4: 199–209. [DOI] [PubMed] [Google Scholar]
- Grimm C, Schreiber A, Kristeva‐Feige R, Mergner T, Hennig J, Lücking CH. 1998. A comparison between electric source localisation and fMRI during somatosensory stimulation. EEG Clin Neurophysiol 106: 22–29. [DOI] [PubMed] [Google Scholar]
- Gorodnitsky IF, George JS, Rao BD. 1995. Neuromagnetic source imaging with FOCUSS: a recursive weighted minimum norm algorithm. EEG Clin Neurophysiol 95: 231–251. [DOI] [PubMed] [Google Scholar]
- Greenblatt RE. 1993. Probabilistic reconstruction of multiple sources in the bioelectromagnetic inverse problem. Inverse Prob 9: 271–284. [Google Scholar]
- Hämäläinen M, Hari R, Ilmoniemi RJ, Knuutila J, Lounasmaa O. 1993. Magnetoencephalography‐theory, instrumentation, and applications to noninvasive studies of the working human brain. Rev Mod Phys 65: 413–497. [Google Scholar]
- Haxby JV, Grady CL, Horwitz B, Ungerleider LG, Mishkin M, Carson RE, Herscovitch P, Schapiro MB, Rapoport SI. 1991. Dissociation of object and spatial visual processing pathways in human extrastriate cortex. Proc Natl Acad Sci USA 88: 1621–1625. [DOI] [PMC free article] [PubMed] [Google Scholar]
- Heinze HJ, Mangun GR, Burchert W, Hinrichs H, Scholz M, Muente TF, Goes A, Johannes S, Scherg M, Hundeshagen H, Gazzaniga MS, Hillyard SA. 1994. Combined spatial and temporal imaging of spatial selective attention in humans. Nature 392: 543–546. [DOI] [PubMed] [Google Scholar]
- Kanwisher N, Woods RP, Iacoboni M, Mazziotta JC. 1997. A locus in human extrastriate cortex for visual shape analysis. J Cog Neurosci 9: 133–142. [DOI] [PubMed] [Google Scholar]
- Kwong KK, Belliveau JW, Chesier DA, Goldberg IE, Weisskoff RM. 1992. Dynamic magnetic resonance imaging of human brain activity during primary sensory stimulation. Proc Natl Acad Sci U S A 89: 5675–5679. [DOI] [PMC free article] [PubMed] [Google Scholar]
- Liu AK, Belliveau JW, Dale AM. 1998. Spatiotemporal imaging of human brain activity using fMRI constrained MEG data: Monte Carlo simulations. Proc Nat Acad Sci U S A 95: 8945–8950. [DOI] [PMC free article] [PubMed] [Google Scholar]
- Mangun GR, Hopfinger JB, Heinze HJ. 1998. Integrating electrophysiology and neuroimaging in the study of human cognition. Behav Res Methods 30: 118–130. [Google Scholar]
- McCarthy G. 1999. Event‐related potentials and functional MRI: a comparison of localization in sensory, perceptual and cognitive tasks. Electroencephalogr Clin Neurophysiol Suppl 49: 3–12. [PubMed] [Google Scholar]
- Menon V, Ford JM, Lim KO, Glover GH, Pfefferbaum A. 1997. Combined event‐related fMRI and EEG evidence for temporal‐parietal cortex activation during target detection. Neuroreport 8: 3029–3037. [DOI] [PubMed] [Google Scholar]
- Mosher JC, Lewis PS, Leahy RM. 1992. Multiple dipole modeling and localization from spatio‐temporal MEG data. IEEE Trans Biomed Eng 39: 541–547. [DOI] [PubMed] [Google Scholar]
- Nowak LG, Bullier J. 1997. The timing of information transfer in the visual system In: Rockland KS, Kaas J, Peter A, editors. Cerebral cortex vol.12: extrastriate cortex. New York: Plenum Press, p 205–241. [Google Scholar]
- Scherg M. 1990. Fundamentals of dipole source potential analysis In: Grandori F, Hoke M, Romani GL, editors. Auditory evoked magnetic fields. Advances in audiology. Basel: Karger, p 40–69. [Google Scholar]
- Scherg M, Berg P. 1991. Use of prior knowledge in brain electromagnetic source analysis. Brain Topo 4: 143–150. [DOI] [PubMed] [Google Scholar]
- Schroeder CE, Mehta AD, Givre SJ. 1998. A spatiotemporal profile of visual system activation revealed by current source density analysis in the awake macaque. Cereb Cortex 8: 575–592. [DOI] [PubMed] [Google Scholar]
- Shen L, Hu X, Yacoub E, Ugurbil K. 1999. Neural correlates of visual form and visual spatial processing. Hum Brain Mapp 8: 160–71. [DOI] [PMC free article] [PubMed] [Google Scholar]
- Simpson GV, Pflieger ME, Foxe JJ, Ahlifors SP, Vaughan HG, Hrabe J, Ilmoniemi RJ, Lantos G. 1995. Dynamic neuroimaging of brain function. J Clin Neurophysiol 12: 423–449. [DOI] [PubMed] [Google Scholar]
- Sternberg S. 1969. The discovery of processing stages: extension of Donders method. Acta Psychol (Amst) 30: 276–315. [Google Scholar]
- Supek S, Aine CJ. 1993. Simulation studies of multiple dipole neuromagnetic source localization: model order and limits of source resolution. IEEE Trans Biomed Eng 40: 529–540. [DOI] [PubMed] [Google Scholar]
- Talairach J, Tournoux P. 1988. Co‐planar stereotaxic atlas of the human brain. Stuttgart: Georg Thieme. [Google Scholar]
- Tootell RBH, Dale AM, Sereno MI, Malach R. 1996. New images from human visual cortex. Trends Neurosci 19: 481–489. [DOI] [PubMed] [Google Scholar]
- Ungerleider LG, Haxby JV. 1994. “What” and “where” in the human brain. Curr Opin Neurobiol 4: 157–165. [DOI] [PubMed] [Google Scholar]
- Van Essen D, DeYoe E. 1995. Concurrent processing in the primate visual cortex In: Gazzaniga MS, editors. Cognitive neuroscience. Cambridge: MIT Press, p 383–400. [Google Scholar]
- Wang JJ, Zhou TG, Qiu ML, Du AT, Cai K, Wang ZL, Zhou C, Meng M, Zhuo Y, Fan SL, Chen L. 1999. Relationship between ventral stream for object vision and dorsal stream for spatial vision: An fMRI + ERP study. Hum Brain Mapp 8: 170–181. [DOI] [PMC free article] [PubMed] [Google Scholar]
- Woldorff M, Fox P, Matzke M, Lancaster J, Veeraswamy J, Zamarripa F, Seabolt M, Glass T, Gao J, Martin C, Jerabek P. 1997. Retinotopic organization of the early visual spatial attention effects as reveals by PET and ERPs. Hum Brain Mapp 5: 280–286. [DOI] [PubMed] [Google Scholar]