

Abstract
Driving is a complex behavior that recruits multiple cognitive elements. We report on an imaging study of simulated driving that reveals multiple neural systems, each of which have different activation dynamics. The neural correlates of driving behavior are identified with fMRI and their modulation with speed is investigated. We decompose the activation into interpretable pieces using a novel, generally applicable approach, based upon independent component analysis. Some regions turn on or off, others exhibit a gradual decay, and yet others turn on transiently when starting or stopping driving. Signal in the anterior cingulate cortex, an area often associated with error monitoring and inhibition, decreases exponentially with a rate proportional to driving speed, whereas decreases in frontoparietal regions, implicated in vigilance, correlate with speed. Increases in cerebellar and occipital areas, presumably related to complex visuomotor integration, are activated during driving but not associated with driving speed. Hum. Brain Mapping 16:158–167, 2002. © 2002 Wiley‐Liss, Inc.
Keywords: fMRI, driving, brain, independent component analysis
Introduction
Driving is a complex behavior involving interrelated cognitive elements including selected and divided attention, visuospatial interpretation, visuomotor integration, and decision making. Several cognitive models have been proposed for driving [Ranney, 1994], especially for visual processing aspects and driver attributes [Ballard et al., 2000; Groeger, 2000]. Such models, however, are complicated and hard to translate into imaging studies. Many of the cognitive elements expected to be involved in driving have been studied separately using imaging paradigms designed to probe discrete brain systems [Cabeza and Nyberg, 2000]. Recently, imaging studies have used subtractive methods to study the neural correlates of driving [Walter et al., 2001] but have not attempted to study the complex temporal dynamics of driving.
The temporal dynamics of driving are difficult to study with functional magnetic resonance imaging (fMRI) due to the lack of a well‐understood brain‐activation model. Imaging studies utilizing cognitive tasks typically employ subtraction between two types of tasks modified in slight increments [Cabeza and Nyberg, 2000], and provide visualization of brain regions that differ. There is often no attempt to study the temporal dynamics. Event‐related designs can be used to study temporal dynamics, but often rely upon rather rigid modeling assumptions [Friston et al., 1998].
We approach this problem by using a method derived from independent component analysis (ICA), a method that has recently been applied to fMRI data with promising results [Biswal and Ulmer, 1999; Calhoun et al., 2001b; McKeown and Sejnowski 1998; McKeown et al., 1998]. ICA was originally developed to solve problems similar to the “cocktail party” problem [Bell and Sejnowski, 1995]. The ICA algorithm, assuming independence in time (independence of the voices), can separate mixed signals into individual sources (voices). In our application, we assume independence of the hemodynamic source locations from the fMRI data (independence in space) resulting in maps for each of these regions, as well as the time course representing the fMRI hemodynamics. We recently extended ICA to allow for the analysis of multiple subjects [Calhoun et al., 2001a; Woods, 1996]. We applied this method to our driving activation data, analyzing the data from all subjects in a single ICA estimation. This provides a way to extract behavioral correlates without having an a priori hemodynamic model.
Our paradigm consists of three repeating conditions, resembling a standard block design. Although these three conditions provide a way to compare behavior, we do not rely upon simple comparison of the images between different conditions, but rather examine the source locations and the modulation of the temporal dynamics. This approach thus provides a useful way of analyzing complex behaviors not possible using traditional (between‐epoch) fMRI comparisons.
We also investigated whether driving speed would modulate neural correlates differently. Driving at a faster speed was not expected to modulate primary visual regions much because the visual objects seen are no more complicated than for the slower speed. Likewise, a speed change was expected to make little difference in the rate of finger movement or motor activation. Increasing speed, however, may increase activation in regions subserving eye movements or visual attention [Hopfinger et al., 2000] or anxiety. We thus scanned two groups of subjects driving at different rates of speed.
Experiments and Methods
Subjects
Subjects (2 female/10 male; mean age 22.5 years) were approved by the JHU IRB, and were compensated for their participation. Subjects were given additional compensation if they stayed within a pre‐specified speed range. Subjects were screened with a complete physical and neurological examination, urine toxicologic testing, as well as the SCAN interview [Janca et al., 1994], to eliminate participants with Axis I psychiatric disorders. Subjects were divided into two groups (3 subjects were in both groups), one group driving “faster” (N = 8) and the other group driving “slower” (N = 7). Three subjects were included in both groups and thus scanned during both speeds. The “slower” and “faster” driving groups were delineated by changing the speedometer display units from kilometers per hour (KPH) to miles per hour (MPH), resulting in an actual speed range of 100–140 or 160–224 KPH, respectively.
Experimental Design
We obtained fMRI scans of subjects as they twice performed a 10‐minute task consisting of 1‐min epochs of (a) an asterisk fixation task, (b) active simulated driving, and (c) watching a simulated driving scene (while randomly moving fingers over the controller). Epochs (b) and (c) were switched in the second run and the order was counterbalanced across subjects. During the driving epoch, participants were performing simulated driving using a modified game pad controller with buttons for left, right, acceleration and braking. The paradigm is illustrated in Figure 1. Subjects were instructed to remain within a predetermined speed range and were compensated additionally if they successfully achieved this goal.
Figure 1.
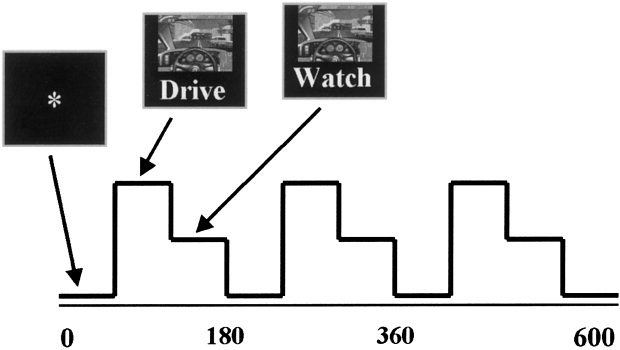
fMRI‐simulated driving paradigm. The paradigm consisted of 10 1‐min epochs of (a) a fixation target, (b) driving the simulator, and (c) watching a simulation while randomly moving fingers over the controller. The paradigm was presented twice changing the order of the (b) and (c) epochs and counterbalancing the first order across subjects.
The simulator used was a commercially available driving game, Need for Speed II™ [Electronic Arts, 1998]. The controller was shielded in copper foil and connected to a computer outside the scanner room though a waveguide in the wall. All ferromagnetic screws were removed and replaced by plastic components. An LCD projector outside the scanner room and behind the scanner projected through another waveguide to a translucent screen, which the subjects saw via a mirror, attached to the head coil of the fMRI scanner. The screen subtended approximately 25 degrees of visual field. The watching epoch was the same for all subjects (a playback of a previously recorded driving session). For the driving epoch, subjects started at the same point on the track with identical conditions (e.g., car type, track, traffic conditions). They were instructed to stay in the right lane except to pass, to avoid collisions, to stay within a speed range of 100–140 (the units were not specified) and to drive normally.
Image Acquisition
Data were acquired at the FM Kirby Research Center for Functional Brain Imaging at Kennedy Krieger Institute on a Philips NT 1.5 Tesla scanner. A sagittal localizer scan was performed first, followed by a T1‐weighted anatomic scan (TR = 500 msec, TE = 30 msec, field of view = 24 cm, matrix = 256 × 256, slice thickness = 5 mm, gap = 0.5 mm) consisting of 18 slices through the entire brain including most of the cerebellum. Next, we acquired the functional scans consisting of an echo‐planar scan (TR = 1 sec, TE = 39 msec, field of view = 24 cm, matrix = 64 × 64, slice thickness = 5 mm, gap = 0.5 mm) obtained consistently over a 10‐min period per run for a total of 600 scans. Ten “dummy” scans were performed at the beginning to allow for longitudinal equilibrium, after which the simulated driving paradigm was begun.
fMRI Data Analysis
The images were first corrected for timing differences between the slices using windowed Fourier interpolation to minimize the dependence upon which reference slice is used [Calhoun et al., 2000; van de Moortele et al., 1997]. Next the data were imported into the Statistical Parametric Mapping software package, SPM99 [Worsley and Friston, 1995]. Data were motion corrected, spatially smoothed with a 8 × 8 × 11 mm Gaussian kernel, and spatially normalized into the standard space of Talairach and Tournoux [1988]. The data were slightly sub‐sampled to 3 × 3 × 4 mm, resulting in 53 × 63 × 28 voxels. For display, slices 2–26 were presented.
Independent Component Analysis
Data from each subject were reduced from 600 to 30 time points using principal component analysis (PCA) (representing greater than 99% of the variance in the data). This “pre‐reduction” (i.e., the incorporation of an initial PCA stage for each subject) is a pragmatic step, and reduces the amount of memory require to perform the ICA estimation, and does not have a significant affect on the results provided the number chosen is not too small [Calhoun et al., 2001a]. To enable group averaging, data from all subjects were then concatenated and this aggregate data set reduced to 25 time points using PCA, followed by group independent component estimation [Calhoun et al., 2001a] using a neural network algorithm that attempts to minimize the mutual information of the network outputs [Bell and Sejnowski, 1995]. Time courses and spatial maps were then reconstructed for each subject and the random effects spatial maps thresholded at P < 0. 00025 (t = 4.5, df = 14) [Calhoun et al., 2001a].
Results
Imaging results are summarized in Figure 2, with different colors coding for each component. The resulting 25 time courses were sorted according to their correlation with the driving paradigm, and then visually inspected for task‐related or transiently task‐related activity. Of the 25 components, only six demonstrated such relationship. The fMRI data are comprised of a linear mixture of each of the six depicted components. That is, if a given voxel has a high value for a given component image, the temporal pattern of the data resembles the temporal pattern depicted for that component. Additionally, some areas consist of more than one temporal pattern. For example, the pink and blue components overlap heavily in the anterior cingulate and medial frontal regions. Selected Talairach coordinates of the volume and maxima of each anatomic region within the maps are presented in Table I.
Figure 2.

Independent components and associated time courses from functional MRI scans. Random effects group fMRI maps are thresholded at P < 0. 00025 (t = 4.5, df = 14). A total of six components are presented. A green component extends on both sides of the parieto‐occipital sulcus including portions of cuneus, precuneus, and the lingual gyrus. A yellow component contains mostly occipital areas. A white component contains bilateral visual association and parietal areas; and a component consisting of cerebellar and motor areas is depicted in red. Orbitofrontal and anterior cingulate areas identified are depicted in pink. Finally, a component including medial frontal, parietal, and posterior cingulate regions is depicted in blue. Group averaged time courses (right) for the fixate‐drive‐watch order are also depicted with similar colors. Standard deviation across the group of 15 scans is indicated for each time course with dotted lines. The epochs are averaged and presented as fixation, drive, and watch.
Table I.
Areas identified by functional imaging
| Component | Area | Brodmann | Volume (cc) | Max t (x, y, z) |
|---|---|---|---|---|
| Pink | L/R Anterior cingulate | 10, 24, 25, 32, 42 | 12.6/11.1 | 18.94(−9, −35, −6)/15.38(3, 43, −6) |
| L/R Medial frontal | 9, 10, 11, 25, 32 | 8.2/11.3 | 16.97(−12, 35, 6)/14.45(6, 40, −6) | |
| L/R Inferior frontal | 11, 25(L), 47 | 5.4/2.2 | 13.20(−9, 40, −15)/9.02(12, −40, −15) | |
| L/R Middle frontal | 10, 11, 47 | 2.7/2.1 | 15.33(−18, 37, −10)/9.34(12, 43, −15) | |
| L/R Superior frontal | 9, 10, 11 | 1.6/3.8 | 11.60(−18, 43, −11)/9.70(18, 50, 16) | |
| Blue | L/R Sup., med. frontal | 6, 8, 9, 10 | 33.4/29.6 | 14.68(−9, 62, 15)/15.83(3, 50, 2) |
| L/R Anterior cingulate | 10, 24, 32, 42 | 5.2/2.5 | 11.44(−3, 49, −2)/14.22(3, 47, 7) | |
| L/R Precuneus(parietal) | 7, 23, 31 | 1.6/3.1 | 8.72(−3, −54, 30)/11.38(6, −54, 30) | |
| L/R Inf. parietal, Sup.marg., angular | 39, 40 | 1.4/2.0 | 7.91(−53, −59, 35)/7.29(53, −68, 31) | |
| L/R Inferior frontal | 11(R), 45(R), 47 | 0.8/3.4 | 6.23(−39, 23, −14)/11.89(48, 26, −10) | |
| L/R Middle frontal | 6, 8 | 0.3/1.2 | 6.94(−18, 34, 44)/7.10(27, 40, 49) | |
| L/R Cingulate/post. cing. | 23, 30, 31, 32 | 1.2/1.7 | 8.59(−3, −54, 26)/11.88(6, −57, 30) | |
| Pink/blue (overlap) | L/R Anterior cingulate | 10, 24, 32, 42 | 4.5/2.4 | 17.52(−9, 38, 3)/15.38(3, 43, −6) |
| L/R Medial frontal | 9, 10, 11, 32 | 4.1/3.8 | 15.79(−6, 38, −6)/15.83(3, 50, 2) | |
| L/R Superior frontal | 9, 10 | 0.2/0.2 | 7.60(−9, 52, −3)/8.43(12, 51, 20) | |
| Red | L/R Precentral | 4(L), 6 | 3.7/0.5 | 5.24(−33, −13, 60)/3.45(24, −11, 65) |
| L/R Thalamus | — | 0.5/0.1 | 7.30(−15, −20, −10)/4.78(9, −14, 5) | |
| L/R Cerebellum | — | 31.7/34.1 | 11.18(−6, −59, −10)/13.86(6, −71, −22) | |
| Yellow | L/R Lingual, cuneus | 17, 18, 19(L) | 18.4/16.6 | 15.1(−9, −96, −9)/18.21(18, −93, 5) |
| L/R Fusiform, mid. occip. | 18, 19 | 7.2/5.9 | 13.07(−9, −95, 14)/11.38(18, −98, 14) | |
| L/R Inferior occipital | 17, 18 | 1.6/1.3 | 8.91(−15, −91, −8)/10.48(21, −88, −8) | |
| Green | L/R Cuneus | 17, 18, 19, 23, 30 | 9.7/7.2 | 22.88(−9, −81, 9)/23.19(6, −78, 9) |
| L/R Lingual | 17, 18, 19 | 4.6/2.7 | 21.98(−6, −78, 4)/16.12(15, −58, −1) | |
| L/R Posterior cingulate | 30, 31 | 0.8/0.6 | 13.06(−12, −64, 8)/12.33(9, −67, 8) | |
| White | L/R Fusiform, inf. occ. | 18, 19, 20, 36(R), 37 | 15.6/12.3 | 9.48(−48, −70, −9)/10.56(42, −74, −17) |
| L/R Cerebellum | — | 13.0/13.5 | 9.36(−33, −50, −19)/12.08(42, −74, −22) | |
| L/R Middle occipital | 18, 29, 37 | 6.9/4.0 | 10.74(−33, −87, 18)/7.11(33, −87, 18) | |
| L/R Lingual, cuneus | 7, 18, 19 | 2.7/1.5 | 8.57(−27, −83, 27)/7.22(24, −92, 23) | |
| L/R Parahippocampal | 19, 36, 37 | 1.7/0.8 | 8.15(−24, −47, −10)/7.16(27, −44, −10) | |
| L/R Superior occipital | 19 | 1.1/0.1 | 12.04(−33, −86, 27)/6.09(33, −86, 23) | |
| L/R Precuneus (parietal) | 7, 19(L) | 0.9/7.7 | 6.91(−27, −77, 36)/7.90(18, −70, 50) | |
| L/R Inferior temporal | 19, 37 | 0.7/0.4 | 6.26(−48, −73, −1)/6.04(48, −71, −1) | |
| L/R Superior parietal | 7 | 0.4/0.5 | 6.38(−18, −67, 54)/6.77(18, −70, 54) |
The group‐averaged time course for the fixation‐drive‐watch paradigm (with the standard deviation across the 15 subjects) for each component is presented on the right side of Figure 2, with color use as in the spatial component maps. The three epoch cycles are averaged together and are presented as ‘fixation’, ‘drive,’ and ‘watch’. Although it is intriguing to try to separate finer temporal correlates within the ICA time courses (such as the time of a crash) we do not have exact timing for individual events in the simulator used and thus limited our exploration to epoch‐based averages. The ordering of the epochs did not significantly change the results. Each of the time courses depicted was modulated by the driving paradigm. Four main patterns are apparent: 1) primary visual (yellow) and higher order visual/cerebellar (white) areas were most active during driving and less active during watching (as compared to fixation) (W,Y); 2) cerebellar/motor (red) and frontoparietal (blue) areas were only in(de)creased during driving; 3) anterior cingulate, medial frontal, and other frontal (pink) areas demonstrated exponential decrements during driving and rebounded during fixation; and 4) visual (green) areas transiently activated when the driving or watching paradigms were changed.
We examined relationships between driving speed and activation. We measured driving speed to verify that the speed was within the range specified (100–140 or 160–224 KPH). These data are summarized for each subject in Table II. Note that the average speed for the “faster” group was slower than the range specified. This was because there were more collisions at the faster speed, thus reducing the average (although it was still significantly higher than the “slower” group). The increase in collisions indicates that subjects are making more “errors” presumably because of a desire to comply with the specified speed range.
Table II.
Behavior results from the driving data
| Subject | Slow | Fast | ||
|---|---|---|---|---|
| Average | Maximum | Average | Maximum | |
| 1 | 106 | 142 | 140 | 248 |
| 2 | 106 | 126 | 125 | 190 |
| 3 | 117 | 138 | 124 | 220 |
| 4 | 113 | 131 | 122 | 206 |
| 5 | 114 | 140 | 151 | 196 |
| 6 | 120 | 140 | 137 | 192 |
| 7 | 98 | 141 | 155 | 246 |
| 8 | 159 | 213 | ||
| Average | 111 | 137 | 139 | 214 |
The frontoparietal (blue) component was decreased during the drive epoch only. Calculating the change in activation for the two speed groups and comparing them with a t‐test revealed significantly (P < 0.02) greater driving‐related changes when subjects are driving faster. This is depicted in Figure 3a and is consistent with an overall change in vigilance while driving at the faster speed. Previous imaging studies have implicated similar frontal and parietal regions in visual awareness [Rees, 2001].
Figure 3.
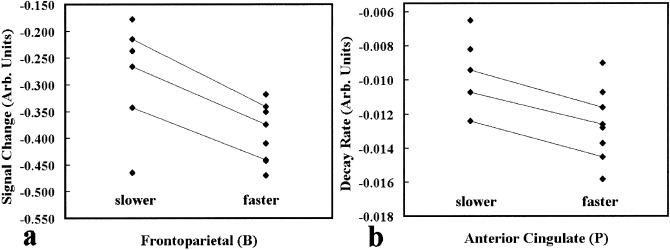
Components demonstrating significant speed‐related modulation. The anterior cingulate/orbitofrontal component decreased more rapidly for the faster drivers. The frontoparietal component demonstrated decreases during the driving epoch and greater decreases for the faster drivers. The lines connect the three subjects who were scanned during both faster and slower driving.
Examination of the orbitofrontal/anterior cingulate (pink) time courses during the driving epoch revealed an exponentially decaying curve, displayed in Figure 2. We extracted the signal decreases during the 180 (3 × 60) time points of driving s(n) and normalized so that the average of the asterisk epoch was 1 and the minimum of the driving epoch was 0 (results were not sensitive to this normalization). Next we transformed the orbitofrontal time course to a linear function through the equation x(n) = ln (s(n) + 1) and fit a line to it such that x(n) = ây(n) + b̂. The resultant fit was very good (average R = 0.9).
Comparing the subjects driving slower with those driving faster using a t‐test reveals a significant difference (P < 0.02) in the rate parameter, â. That is, the rate of decrease in anterior cingulate pink signal is faster in the subjects driving at a faster rate (a more difficult task). This speed‐related rate change is also consistent with the involvement of the orbitofrontal and anterior cingulate involvement in disinhibition (i.e., “taking off the brake”) [Blumer and Benson, 1975; Rauch et al., 1994]. A comparison of the rates is depicted in Figure 3b. No significant correlations were found for any of the other revealed components.
The components identified by our analysis lend themselves naturally to interpretation in terms of well‐known neurophysiological networks. This interpretation is depicted graphically in Figure 4, using colors corresponding to those in the imaging results. Results are divided into six domains containing one or more networks: 1) vigilance; 2) error monitoring and inhibition; 3) motor; 4) visual; 5) higher order visual/motor; and 6) visual monitoring. Components are grouped according to their modulation by driving with the speed‐modulated components indicated as well.
Figure 4.
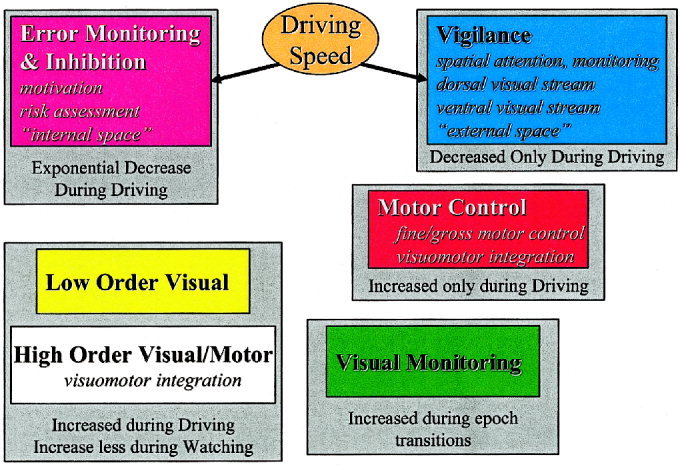
Interpretation of imaging results. The colors correspond to those used in Figure 2. Components are grouped according to the averaged pattern demonstrated by their time courses. The speed modulated components are indicated with arrows.
Discussion
A previous fMRI study involving simulated aviation has found speed‐related changes in frontal areas similar to those that we have observed [Peres et al., 2000]. Attentional modulation may explain the speed‐related changes as these two components (blue, pink) include areas implicated in both the anterior and posterior divisions of the attention system [Posner et al., 1997; Schneider et al., 1994]. Orbitofrontal cortex has been demonstrated to exhibit fMRI signal change during breaches of expectation (i.e., error detection) in a visual task [Nobre et al., 1999]. Our finding of anterior cingulate cortex in the pink component and both anterior and posterior cingulate cortex in the blue component is consistent with recent studies demonstrating functionally distinct anterior and posterior cingulate regions in spatial attention [Mesulam et al., 2001]. The frontal and parietal regions identified in the blue component have also been implicated in attentional tasks involving selected and divided attention [Corbetta et al., 1991, 1998]. The angular gyrus, superior parietal gyrus, and posterior cingulate gyrus were also identified in the simulated aviation task. In our study, these areas were contained within the same component and are thus functionally connected to one another; i.e., they demonstrate similar fMRI signal changes, and in that sense are distinct from areas involved in other components.
It is also informative to consider the components identified in the context of their interactions. The overlapping areas of the blue and pink components, consisting mainly of portions of the anterior cingulate and the medial frontal gyrus, are indicated in Figure 2 and Table I. The anterior cingulate has been divided into rostral ‘affect’ and caudal ‘cognition’ regions [Devinsky et al., 1995], consistent with the division between the pink and blue components. Note that activity in the blue regions decreases rapidly during the driving epoch whereas the pink regions slowly decrease during the driving condition. One interpretation of these results is that a change in vigilance is initiated once the driving condition begins. Error correction and disinhibition are revealed as a gradual decline of this component at a rate determined in part by the vigilance network. During the fast driving condition, the vigilance component changes more; thus the error correction and disinhibition component decreases at a faster rate. An EEG study utilizing the NFS simulation software revealed greater alpha power in the frontal lobes during driving than during replay, and was interpreted as being consistent with a reduction of attention during the replay task [Schier, 2000]. Our results are consistent with this interpretation, as neither error monitoring nor vigilance is presumably prominent during replay (watching).
The inverse correlation between speed and frontal/cingulate activity suggests an alternative interpretation. Driving fast should engage reflex or over‐learned responses more so than critical reasoning resources. As the cingulate gyrus has been claimed to engage in the monitoring of such resources, such a view implies that the cingulate gyrus should be less activated as well. Such interpretations, although consistent with our results, require further investigation. For example, it would be interesting to study the effect of speed at more than two levels, in a parametric manner. In addition, physiologic measures such as galvanic skin conductance could be used to test for correlations with stress levels.
Other activated components we observed were consistent with prior reports. For example, the visual association/cerebellar component (white) demonstrates activation in regions previously found to be involved in orientation [Allen et al., 1997] and complex scene interpretation or memory processing [Menon et al., 2000]. This component also appears to contain areas involved in the modulation of connectivity between primary visual (V2) and motion sensitive visual regions (V5/area MT), such as parietal cortex (Brodmann area 7), along with visual association areas [Friston and Buchel, 2000]. These areas along with the primary visual areas (yellow) have been implicated in sensory acquisition [Bower, 1997] and attention/anticipation [Akshoomoff et al., 1997]. Activation in both the white and yellow components was increased above fixation during watching and further increased during driving. This is in contrast to [Walter et al., 2001], but is consistent with sensory acquisition (present in both driving and watching) combined with the attentional and motor elements of driving (present in the driving epoch). That is, the further increase in these areas during driving appears to be an attentional modulated increase [Gandhi et al., 1999].
The transient visual areas (green) demonstrate an increase at the transitions between epochs. We identified similar areas, also transiently changing between epochs, in a simple visual task [Calhoun et al., 2001a]. Similar areas have been detected in a meta‐analysis of transient activation during block transitions [Konishi et al., 2001] and may be involved in switching tasks in general. The red component was mostly in the cerebellum in areas implicated in motor preparation [Thach et al., 1992]. Primary motor contributions were low in amplitude presumably due to the small amount of motor movement involved in controlling the driving task (0.1/0.9 Hz rate on average for left/right hand, no significant difference with speed). This would also explain why there was little activation during the watching epoch as during this time motor preparation and visuomotor integration are presumably minimal.
A few comments on the particulars of our method are in order. It is important to consider how the preprocessing stages affect the resulting images. The relevant stages performed include timing correction, motion correction, spatial normalization and smoothing. The first three are necessary to attempt to place the image data from all subjects into the same point of reference in both time and space. The smoothing is useful as it both reduces the amount of high‐frequency spatial noise as well as desensitizes the images to errors in the motion correction and normalization. It is straightforward to demonstrate that spatial smoothing will not affect the (spatial) ICA estimate (i.e., the mixing matrix will be the same though the source maps will be smoothed) and thus is a reasonable preprocessing step [Hyvarinen and Oja, 2000].
We also performed a standard subtractive analysis of these data (results not shown) in which the blocked paradigm was entered as three regressors of interest, fixation, driving, and watching. Results revealed some of the same areas revealed by the ICA results, although they were not separated into different maps. For example, the orbitofrontal component, though decreasing in an exponential fashion, is similar enough to our paradigm to be revealed. The fronto‐parietal regions were delineated in the same map (though they very clearly have different dynamics). Finally, the transient visual regions were not shown in the subtractive results because they are quite different from the regressors entered.
The goal of this study was to capture the temporal nature of the neural correlates of the complex behavior of driving. We decomposed the activation due to a complex behavior into interpretable pieces using a novel, generally applicable approach, based upon independent component analysis (see Fig. 4). Several components were identified, each modulated differently by our imaging paradigm. Regions that increased or decreased consistently, increased transiently, or which exhibited gradual signal decay during driving were identified. Additionally, two of the components in regions implicated in vigilance and error monitoring/inhibition processes were significantly associated with driving speed. Imaging results are grouped into cognitive domains based upon the areas recruited and their modulation with our paradigm.
It is clear that driving is a complex task. The ability to study, with imaging, a complex behavior such as driving, in conjunction with paradigms studying more specific aspects of cognition, may enhance our overall understanding of the neural correlates of complex behaviors.
Acknowledgements
The authors would like to thank Drs. S. Courtney, M. Denckla, J. Hart, N. Honeycutt, M. Kraut, T. Moran, C. Ross, and S. Yantis for thoughtful feedback and discussion and R. Burris for assistance with data analysis. This research was funded by an Outpatient Clinical Research Centers grant (M01‐RR00052) to GP and by NIH grant 1P41RR15241‐01.
REFERENCES
- Akshoomoff NA, Courchesne E, Townsend J (1997): Attention coordination and anticipatory control. Int Rev Neurobiol 41: 575–598. [DOI] [PubMed] [Google Scholar]
- Allen G, Buxton RB, Wong EC, Courchesne E (1997): Attentional activation of the cerebellum independent of motor involvement. Science 275: 1940–1943. [DOI] [PubMed] [Google Scholar]
- Ballard DH, Hayhoe MM, Salgian G, Shinoda H (2000): Spatio‐temporal organization of behavior. Spat Vis 13: 321–333. [DOI] [PubMed] [Google Scholar]
- Bell AJ, Sejnowski TJ (1995): An information maximization approach to blind separation and blind deconvolution. Neural Comput 7: 1129–1159. [DOI] [PubMed] [Google Scholar]
- Biswal BB, Ulmer JL (1999): Blind source separation of multiple signal sources of FMRI data sets using independent component analysis. J Comput Assist Tomogr 23: 265–271. [DOI] [PubMed] [Google Scholar]
- Blumer D, Benson DF (1975): Psychiatric aspects of neurologic diseases In: Benson DF, Blumer D, editors. Personality changes with frontal and temporal lobe lesions. New York: Grune and Stratton; p 151–170. [Google Scholar]
- Bower JM (1997): Control of sensory data acquisition. Int Rev Neurobiol 41: 489–513. [DOI] [PubMed] [Google Scholar]
- Cabeza R, Nyberg L (2000): ); Imaging cognition II: an empirical review of 275 PET and FMRI studies. J Cogn Neurosci 12: 1–47. [DOI] [PubMed] [Google Scholar]
- Calhoun V, Adali T, Kraut M, Pearlson G (2000): A weighted‐least squares algorithm for estimation and visualization of relative latencies in event‐related functional MRI. Magn Reson Med 44: 947–954. [DOI] [PubMed] [Google Scholar]
- Calhoun V, Adali T, Pearlson G, Pekar J (2001a): A method for making group inferences from fMRI data using independent component analysis. Hum Brain Mapp 14: 140–151. [DOI] [PMC free article] [PubMed] [Google Scholar]
- Calhoun VD, Adali T, Pearlson GD, Pekar JJ (2001b): Spatial and temporal independent component analysis of functional MRI data containing a pair of task‐related waveforms. Hum Brain Mapp 13: 43–53. [DOI] [PMC free article] [PubMed] [Google Scholar]
- Corbetta M, Akbudak E, Conturo TE, Snyder AZ, Ollinger JM, Drury HA, Linenweber MR, Petersen SE, Raichle ME, Van E, Shulman GL (1998): A common network of functional areas for attention and eye movements. Neuron 21: 761–773. [DOI] [PubMed] [Google Scholar]
- Corbetta M, Miezin FM, Dobmeyer S, Shulman GL, Petersen SE (1991): Selective and divided attention during visual discriminations of shape, color, and speed: functional anatomy by positron emission tomography. J Neurosci 11: 2383–2402. [DOI] [PMC free article] [PubMed] [Google Scholar]
- Devinsky O, Morrell MJ, Vogt BA (1995): Contributions of anterior cingulate cortex to behavior. Brain 118: 279–306. [DOI] [PubMed] [Google Scholar]
- Electronic Arts I (1998): Need for Speed II. Redwood City, California: Electronic Arts. [Google Scholar]
- Friston KJ, Buchel C (2000): Attentional modulation of effective connectivity from V2 to V5/MT in humans. Proc Natl Acad Sci USA 97: 7591–7596. [DOI] [PMC free article] [PubMed] [Google Scholar]
- Friston KJ, Fletcher P, Josephs O, Holmes A, Rugg MD, Turner R (1998): Event‐related FMRI: characterizing differential responses. NeuroImage 7: 30–40. [DOI] [PubMed] [Google Scholar]
- Gandhi SP, Heeger DJ, Boynton GM (1999): Spatial attention affects brain activity in human primary visual cortex. Proc Natl Acad Sci USA 96: 3314–3319. [DOI] [PMC free article] [PubMed] [Google Scholar]
- Groeger J (2000): Understanding driving: applying cognitive psychology to a complex everyday task. New York: Psychology Press. [Google Scholar]
- Hopfinger JB, Buonocore MH, Mangun GR (2000): The neural mechanisms of top‐down attentional control. Nat Neurosci 3: 284–291. [DOI] [PubMed] [Google Scholar]
- Hyvarinen A, Oja E (2000): Independent component analysis: algorithms and applications. Neural Netw 13: 411–430. [DOI] [PubMed] [Google Scholar]
- Janca A, Ustun TB, Sartorius N (1994): New versions of World Health Organization instruments for the assessment of mental disorders. Acta Psychiatr Scand 90: 73–83. [DOI] [PubMed] [Google Scholar]
- Konishi S, Donaldson DI, Buckner RL (2001): Transient activation during block transition. NeuroImage 13: 364–374. [DOI] [PubMed] [Google Scholar]
- McKeown MJ, Makeig S, Brown GG, Jung TP, Kindermann SS, Bell AJ, Sejnowski TJ (1998): Analysis of FMRI data by blind separation into independent spatial components. Hum Brain Mapp 6: 160–188. [DOI] [PMC free article] [PubMed] [Google Scholar]
- McKeown MJ, Sejnowski TJ (1998): . Independent component analysis of FMRI data: examining the assumptions. Hum Brain Mapp 6: 368–372. [DOI] [PMC free article] [PubMed] [Google Scholar]
- Menon V, White CD, Eliez S, Glover GH, Reiss AL (2000): Analysis of a distributed neural system involved in spatial information, novelty, and memory processing. Hum Brain Mapp 11: 117–129. [DOI] [PMC free article] [PubMed] [Google Scholar]
- Mesulam MM, Nobre AC, Kim YH, Parrish TB, Gitelman DR (2001): Heterogeneity of cingulate contributions to spatial attention. NeuroImage 13: 1065–1072. [DOI] [PubMed] [Google Scholar]
- Nobre AC, Coull JT, Frith CD, Mesulam MM (1999): Orbitofrontal cortex is activated during breaches of expectation in tasks of visual attention. Nat Neurosci 2: 11–12. [DOI] [PubMed] [Google Scholar]
- Peres M, van de Moortele PF, Pierard C, Lehericy S, LeBihan D, Guezennez CY (2000): fMRI of mental strategy in a simulated aviation performance task. Aviat Space Environ Med 71: 1218–1231. [PubMed] [Google Scholar]
- Posner MI, DiGirolamo GJ, Fernandez‐Duque D (1997): Brain mechanisms of cognitive skills. Conscious Cogn 6: 267–290. [PubMed] [Google Scholar]
- Ranney TA (1994): Models of driving behavior: a review of their evolution. Accid Anal Prev 26: 733–750. [DOI] [PubMed] [Google Scholar]
- Rauch SL, Jenike MA, Alpert NM, Baer L, Breiter HC, Savage CR, Fischman AJ (1994): Regional cerebral blood flow measured during symptom provocation in obsessive‐compulsive disorder using oxygen 15‐labeled carbon dioxide and PET. Arch Gen Psychiatry 51: 62–70. [DOI] [PubMed] [Google Scholar]
- Rees G (2001): Neuroimaging of visual awareness in patients and normal subjects. Curr Opin Neurobiol 11: 150–156. [DOI] [PubMed] [Google Scholar]
- Schier MA (2000): Changes in EEG alpha power during simulated driving: a demonstration. Int J Psychophysiol 37: 155–162. [DOI] [PubMed] [Google Scholar]
- Schneider W, Pimm‐Smith M, Worden M (1994): Neurobiology of attention and automaticity. Curr Opin Neurobiol 4: 177–182. [DOI] [PubMed] [Google Scholar]
- Talairach J, Tournoux P (1988): A co‐planar stereotaxic atlas of a human brain. Stuttgart: Thieme. [Google Scholar]
- Thach WT, Goodkin HP, Keating JG (1992): The cerebellum and the adaptive coordination of movement. Annu Rev Neurosci 15: 403–442. [DOI] [PubMed] [Google Scholar]
- van de Moortele PF, Cerf B, Lobel E, Paradis AL, Faurion A, Le Bihan D (1997): Latencies in fMRI time‐series: effect of slice acquisition order and perception. NMR Biomed 10: 230–236. [DOI] [PubMed] [Google Scholar]
- Walter H, Vetter SC, Grothe J, Wunderlich AP, Hahn S, Spitzer M (2001): The neural correlates of driving. Neuroreport 12: 1763–1767. [DOI] [PubMed] [Google Scholar]
- Woods RP (1996): Modeling for intergroup comparisons of imaging data. NeuroImage 4: S84–S94. [DOI] [PubMed] [Google Scholar]
- Worsley KJ, Friston KJ (1995): Analysis of FMRI time‐series revisited—again. NeuroImage 2: 173–181. [DOI] [PubMed] [Google Scholar]