

Abstract
Considerable ambiguity exists about the generators of the scalp recorded P300, despite a vast body of research employing a diverse range of methodologies. Previous investigations employing source localization techniques have been limited largely to equivalent current dipole models, with most studies identifying medial temporal and/or hippocampal sources, but providing little information about the contribution of other cortical regions to the generation of the scalp recorded P3. Event‐related potentials (ERPs) were recorded from 5 subjects using a 124‐channel sensor array during the performance of a visuo‐verbal Oddball task. Cortically constrained, MRI‐guided boundary element modeling was used to identify the cortical generators of this target P3 in individual subjects. Cortical generators of the P3 were localized principally to the intraparietal sulcus (IPS) and surrounding superior parietal lobes (SPL) bilaterally in all subjects, though with some variability across subjects. Two subjects also showed activity in the lingual/inferior occipital gyrus and mid‐fusiform gyrus. A group cortical surface was calculated by non‐linear warping of each subject's segmented cortex followed by averaging and creation of a group mesh. Source activity identified across the group reflected the individual subject activations in the IPS and SPL bilaterally and in the lingual/inferior occipital gyrus primarily on the left. Activation of IPS and SPL is interpreted to reflect the role of this region in working memory and related attention processes and visuo‐motor integration. The activity in left lingual/inferior occipital gyrus is taken to reflect activation of regions associated with modality‐specific analysis of visual word forms. Hum. Brain Mapping 18:53–77, 2002. © 2002 Wiley‐Liss, Inc.
Keywords: event‐related potentials, magnetic resonance imaging, P3, P3b, source modeling, cortical generators, cortical current density estimation
INTRODUCTION
The term P3 (also P300, P3b) is used to describe an endogenous, positive polarity component of the human event‐related potential (ERP) that occurs at a latency of 300–500 msec and is maximal over the parieto‐central area of the scalp [Fabiani et al., 1987]. Initially identified as an ERP component related to uncertainty resolution [Sutton et al., 1965], the P3 is typically elicited by the Oddball paradigm and has been argued to reflect a number of related cognitive processes including decision making or the assessment of stimulus relevance [see Andreassi, 1995] and cognitive closure at the completion of processing [Verleger, 1988]. Although there has been considerable controversy over the function of the P3, the weight of evidence favors the view that this component is involved in updating a cognitive model of the environment within working memory stores [Donchin and Coles, 1988]. Although the P3 has generally been elicited during controlled conscious processing of task‐relevant stimuli, it has also been shown that the P3 can be elicited during sleep [Bastuji and García‐Larrea, 1999]. The presence of a P3‐like response to a subject's own name has been found to persist during both Stage II and Paradoxical sleep, suggesting that the sleeping brain is able to analyze some aspects of stimulus significance [Perrin et al., 1999]. Furthermore, patients with severe traumatic brain injury in a vegetative state have been shown to elicit P3‐like responses even though they are not able to respond overtly to even simple commands [Rappaport et al., 1991]. The P3 is generally considered to be modality non‐specific [Halgren et al., 1998a] since it has been observed in auditory, visual, and somatosensory modalities [Yamaguchi and Knight, 1991a], though there is some evidence from intracranial studies for the existence of modality‐dependent P300 generators [Johnson, 1989]. Uncertainty surrounding the functional significance of the P3 is compounded by conflicting evidence regarding the localization of its neural generator(s). The focus of this study is to identify the cortical sources of the scalp recorded P3 component through the use of a distributed source modeling technique. The aim here is to employ a cortically constrained source estimation method that plausibly limits the source solution space and obviates the need for a priori assumptions about the number and locations of sources generating the P3. The introduction will first review the large body of literature concerned with localizing the neural sources of the P3, which has employed a diverse range of methodologies. This is followed by a detailed outline of the approach employed in the current study to estimate the cortical sources of the visuo‐verbal P3.
Efforts to localize these generators have involved several different methodologies including intracranial recordings and lesion studies, electroencephalography (EEG), magnetoencephalography (MEG), functional magnetic resonance imaging (fMRI) and positron emission tomography (PET), and electrical/magnetic source modeling. Intracranial recording studies, predominantly employing auditory Oddball paradigms in patients with intractable epilepsy, have often demonstrated P3‐like potentials in the medial temporal lobe (MTL), implicating structures such as the hippocampus, parahippocampal gyrus, and amygdala [Baudena et al., 1995; Halgren et al., 1980, 1995a,b; McCarthy et al., 1989; Stapleton and Halgren, 1987]. Polarity inversions within and around the MTL have been interpreted as evidence for local generation [Halgren et al., 1986; Kiss et al., 1989; McCarthy et al., 1989; Wood and McCarthy, 1985], although it has been argued not to be conclusive evidence [Johnson, 1988]. Hippocampal damage has been shown to affect an intracranial limbic P3‐like potential [Puce et al., 1989]. However, it has been questioned whether or not the MTL makes a significant contribution to generation of the scalp recorded P3 at all, since intracranial P3‐like potentials in the MTL peak approximately 50 msec later than the scalp component [Halgren et al., 1980 1986, 1995a, 1998a; Johnson, 1988; Paller et al., 1992; Smith et al., 1990; Stapleton and Halgren 1987]. Evidence from several studies involving patients who have undergone unilateral temporal lobectomy for the treatment of chronic intractable epilepsy, have not demonstrated significant reductions in P3 amplitude at scalp [Johnson, 1988, 1989; Scheffers et al., 1991; Stapleton et al., 1987]. Similarly, bilateral ablation of the MTL in monkeys had no effect on the P3 recorded from frontal and parietal epidural locations [Paller et al., 1988]. Some authors have found local attenuation of the P3 in lesioned and temporal lobectomy populations at lateral but not at centro‐parietal scalp electrodes [Daruna et al., 1989; Nishitani et al, 1999; Onofrj et al., 1991, 1992a,b] suggesting that the hippocampus/MTL complex contributes to the scalp P3 only near the lesioned area [Nishitani et al., 1999; Onofrj et al., 1991, 1992a,b]. It has been argued that the normal amplitude of the P3 in unilateral temporal lobectomy may be an artifact due to increased current flow caused by skull bone defect [Nishitani et al., 1999]. However, a substantial body of lesion studies involving patients without skull bone defect [Johnson, 1988, 1989; Knight, 1991, 1996; Polich and Squire, 1993; Rugg et al., 1991] provide evidence counter to the view that increases in current flow to the scalp due to the skull bone defect have a normalizing effect on an attenuated P3 from the MTL.
A related issue is whether P3‐like potentials in the hippocampus/MTL are likely to be volume conducted to and, therefore, be observable at the scalp. Although the distribution of the scalp P3 is consistent with both deep generators and distributed cortical generators [Altafullah et al., 1986], it is questionable whether deep sources such as the hippocampus and MTL contribute via volume conduction to the scalp potential [Altafullah et al., 1986; Johnson, 1993]. It is widely accepted that scalp recorded ERPs reflect the summation of volume‐conducted activity from a large number of pyramidal cortical neurons arranged in open field configurations [Nunez, 1981]. Although the hippocampus is organized in a laminar fashion with two distinct layers of pyramidal neurons [Mesulam, 1985], the tissue geometry is likely to cause cancellation of source currents, producing a field that attenuates more rapidly with distance. Thus, it is unknown whether it contributes significantly to scalp ERPs since the potential due to deep sources would be strongly attenuated between source and scalp [Nunez, 1985]. A study investigating the volume conduction of deeply generated interictal spikes in epilepsy demonstrated a general absence of related activity at the scalp, except possibly at lateral scalp regions [Altafullah et al., 1986]. Several authors acknowledge that activity in the MTL may make a partial contribution to the scalp P3, but that cortical generators are the predominant source of the P3 component [Rugg et al., 1991; Stapleton et al., 1987; Stapleton and Halgren 1987]. The suggestion that the temporo‐parietal association cortex might be involved in generating the P3 component [Knight, 1990; Knight et al., 1989a,b; Yamaguchi and Knight, 1991a, 1993] is supported by the finding that temporo‐parietal skull thickness correlates with P3 amplitude [Frodl et al., 2001].
Substantial evidence supports the view that there are multiple generators of the scalp P3 [Baudena et al., 1995; Halgren et al., 1995a,b, 1998a; Jentzsch and Sommer, 2001; Ji et al., 1999; Johnson, 1993]. Intracranial studies have shown P3‐like activity in cortical areas including the prefrontal and inferior frontal regions [Neshige and Lüders, 1992; Wood and McCarthy, 1985], inferior parietal lobe [Smith et al., 1990], and superior temporal sulcus [Baudena et al., 1995; Halgren et al., 1995a,b]. Polarity reversals suggesting local generation have been demonstrated in the superior temporal sulcus [Halgren et al., 1995a] and parieto‐occipital region [Kiss et al., 1989]. The intraparietal sulcus (IPS) of the superior parietal lobe (SPL) has also been suggested as a generator on the basis of local polarity inversions [Baudena et al., 1995; Halgren et al., 1995a, 1998a]. Event‐related fMRI studies have identified several regions that are found to be activated specifically during Oddball target processing, including the middle frontal gyrus (MFG) [Krino et al., 2000; McCarthy et al., 1997], supramarginal gyrus (SMG) [Hinton et al., 1999; Linden et al., 1999; Menon et al., 1997], superior temporal gyrus (STG) [Hinton et al., 1999], frontal operculum and insular cortex [Linden et al., 1999], and the superior parietal lobe (SPL) [Hinton et al., 1999], but with notable absence of hippocampal activation [Hinton et al., 1999; McCarthy et al., 1997]. Intracranial studies have demonstrated a role for the temporo‐parietal cortex [Halgren et al., 1995a] and lesions of this region, specifically involving the STG and SMG of the inferior parietal lobe (IPL), have consistently been associated with an absence or diminution of the scalp P3 component [Knight et al., 1987; Knight, 1990; Yamaguchi and Knight, 1991a,b; Yamaguchi and Knight, 1993]. Such evidence has supported a developing consensus that the temporo‐parietal region makes a critical contribution to the scalp P3 [Knight, 1987, 1991], with Menon et al. [1997] asserting that the dominant contribution derives from bilateral activation of superficial sources in the SMG.
Several source localization techniques have been employed to identify the generator(s) of the P3. Equivalent current dipole (ECD) fitting is a method that assumes either a single ECD, or a small number of discrete ECDs, of fixed location are responsible for the signal observed at the scalp [George et al., 1995], with estimates based on either electrical or magnetic data. Magnetic resonance imaging (MRI) has been included in some ECD models to determine best fitting spheres for use in spherical head models [Menon et al., 1997; Rogers et al., 1991], whilst fMRI has been used to constrain the locations of dipoles for ECD modeling [Menon et al., 1997; Opitz et al., 1999]. Temporal and hippocampal sources of the P3 have been repeatedly reported in these studies [Gordon et al., 1987, 1990; Goto et al., 1996; Hegerl and Frodl‐Bauch, 1997; Lewine et al., 1989; Okada et al., 1983; Rogers et al., 1991; Tarkka et al., 1995, 1996; Tarkka and Stokic, 1998; Turetsky et al., 1990]. In addition, sources have been reported in subcortical regions [Mecklinger et al., 1998] and the frontal and parietal cortex [Anderer et al., 1998; He et al., 2001; Mecklinger and Ullsperger, 1995; Yamazaki et al., 2000, 2001]. There are also references to the STG [Anderer et al., 1998; Opitz et al., 1999], SMG [Anderer et al., 1998; Menon et al., 1997; Nishitani et al., 1999], the parieto‐occipital junction [Anderer et al., 1998], and medial superior parietal cortex [Anderer et al., 1998].
A limitation of discrete source modeling approaches such as ECD is that they generally require a priori knowledge of the number and location of the likely sources of activity in order to seed dipole positions [Tarkka et al., 1995]. Since the sources of the P3 are not known [Tarkka et al., 1996; Tarkka and Stokic, 1998] this becomes problematical. Further, several authors [e.g., Kincses et al., 1999; Nunez et al., 1991; Nunez and Westdorp, 1994] have also questioned their suitability for estimating the neural sources of high level cognitive processes, since these sources are likely to be distributed over large regions of the cortex rather than at a few discrete locations [e.g., Nunez et al., 1991; Nunez and Westdorp, 1994]. Simulation studies have suggested that the ECD method can produce significant error in estimating the depth of broad and extended sources [George et al., 1995], which may explain why such approaches have most consistently reported deep rather than cortical source estimates. Such arguments are clearly relevant to P3 source estimation, since the P3 is generally considered to be an index of cognitive processes, and there is a broad consensus that it is likely to be generated by multiple distributed sources. It would seem more appropriate to employ localization techniques that accommodate distributed rather than discrete source estimates.
It has been recognized that realistic head geometry, including the modeling of cortical surface topography that respects sulcal integrity, is necessary for accurate identification of the cortical sources of P3 [Halgren et al., 1995b, 1998a]. This has not been technically possible in many of the early studies, which have relied on spherical head models to provide analytic solutions to the forward problem. Indeed, very few of the ECD studies cited above have used MRI [Menon et al., 1997; Rogers et al., 1991], and none have used MRI information to develop realistic head and cortical surface models from individual anatomy. Further, these studies tended to employ few scalp electrodes (usually no more than 32), which severely limits the spatial resolving power of such source modeling techniques [Nunez et al., 1994]. Finally, most studies have developed solutions based on group data, thus disregarding the likelihood of individual differences in source configurations and missing the benefits that are obtained from accurate real head and cortical surface modeling from individual anatomy.
Cortical current density (CCD) estimation offers an alternative source modeling technique that constrains the inverse solution to the cortical surface. The use of putative dipoles oriented normal to and distributed throughout the cortical surface is premised on the assumption that cortical pyramidal cells, which are arranged normal to the cortical surface and constitute 65–75% of cortical neurons, provide the primary source of electrical current flows to the scalp [Nunez, 1981]. The restriction of source activity to the cortex is physiologically plausible, given that the sources of scalp electrical activity are likely to be due to synchronous activity of cortical pyramidal neurons [Nunez, 1981]. As the CCD approach is a distributed source model, it does not require a priori information about the number or locations of sources, which are still unknown in the case of the P3. The method employs a boundary element technique involving realistic head geometries derived from high‐resolution structural MRI [de Munck, 1992; Hämäläinen and Sarvas, 1989; Meijs et al., 1989] to segment and define the boundaries of the cortex, inner skull, outer skull, and scalp. The resistance to current flow of each intervening segment is modeled as isotropic and homogenous using known approximations [e.g., Law, 1993; Nunez, 1981]. This method of source estimation has now been used in several studies [e.g., Babiloni et al., 2000], including the non‐invasive identification of sources of interictal epileptiform activity [Huppertz et al., 2001; Waberski et al., 1998].
In the present study, CCD modeling was used to estimate the cortical sources of activity obtained from 124 scalp sites during the conventional time course of the scalp target P3. The inverse problem was solved using minimum norm constraints [Crowley et al., 1989; Hämäläinen and Ilmoniemi, 1984; Wang et al., 1992]. A scalp target P3‐like component was obtained using a variation of the traditional Oddball paradigm, which required subjects to attend to concrete words presented visually on a computer screen and to detect occasional target words. It has previously been shown that this task generates a robust P3‐like component [Clark et al., 1998]. Based on the evidence reviewed here, it was predicted that cortically constrained source localization would reveal cortical sources associated with the peak of the P3 component during the detection of target words in the middle frontal gyrus, superior temporal region, temporo‐parietal region, supramarginal gyrus of the inferior parietal lobe, and the intraparietal sulcus of the superior parietal lobe.
SUBJECTS AND METHODS
Subjects
Five neurologically and psychologically normal subjects (3 males, 2 females) with a mean age of 20.6 years (± SD 1.56) participated in this study. All subjects were right‐handed [Annett, 1970], had normal visual acuity (Snellen Eye Chart), were first language English speakers, and were not taking any psychoactive medications. Subjects had an average of 13.2 years of education (± SD 0.84) and an estimated WAIS‐R [Wechsler, 1981] full‐scale IQ of 107.2 (± SD 5.89) [Nelson, 1992]. All subjects gave informed consent for this study after the nature of the experimental procedures was explained. The Social and Behavioral Research Ethics Committee at Flinders University and the Research Ethics Committee at the Royal Adelaide Hospital approved this study.
Experimental task and procedure
Subjects completed a variant of the classical Oddball paradigm that involved the detection of visually presented target words amongst non‐target words, with words presented equiprobably in upper‐ or lowercase. Subjects were required to attend to words in one case, whilst ignoring words presented in the other case. In each block, the target was either defined at the beginning of the task block or was defined as a consecutive repeat of a word. The manipulations of case and target definition relate to other aspects of the study that affected non‐target stimulus processing that are not reported at this time. Participants were instructed to use a right index finger button press to indicate the detection of a target word. Speed and accuracy were emphasized equally in task instructions.
Each task block involved the presentation of 32 word stimuli (16 attended words, 16 unattended words) derived from a master set of 32 medium frequency [Kucera and Francis, 1967] concrete nouns of between four and seven letters and with no more than two syllables. The 32 words in each block consisted of four repeats of eight words selected without replacement from the master set. Four of these eight words were presented in uppercase, the other four in lowercase. No word appeared in both upper‐ and lowercase within a block. Average word frequency was balanced across all word groups. In each block, the target stimulus occurred in a pseudo‐random position on four occasions, providing a probability of 12.5%. This study reports results from activity related to the processing of target words during performance of this working memory task. Each word was presented for 300 msec at a fixed intensity with a pseudo‐random stimulus onset asynchrony between 1.5 and 1.7 sec. Words were presented in white on a black background via a computer monitor using Gentask software (STIM, Neuroscan; Neurosoft, El Paso, TX) with responses collected using a response pad (Neuroscan; Neurosoft). The performance of subjects on the target detection task was measured on two indices: reaction time and target detection rate.
Electrophysiological data collection and analysis
EEG was recorded continuously from the scalp using a 124‐channel Electro‐Cap (ES1‐128; ElectroCap Internationa, Eaton, OH) with tin electrodes. The inter‐electrode distance was approximately 2 cm and conformed to standardized locations in the guidelines for extended 10:20 placement [American Electroencephalographic Society, 1991] with additional locations interpolated evenly between the standard sites. A single right ear reference was used. Activity was also obtained from the left ear and used offline for arithmetically computed, linked ears referencing. Eye movements were recorded via electro‐oculogram (EOG) from 4 tin electrodes placed above and below the right eye (vertical EOG) and on the outer canthus of the left and right eyes (horizontal EOG). During data collection, electrode impedances were kept below 5 kOhm and approximately equal. Analogue EEG was initially pre‐amplified using headbox circuitry and then transferred to secondary amplifiers (Neuroscan SYNAMPS model 5083). EEG and EOG signals were amplified (1,000 and 500 times, respectively) across a band pass of DC‐70 Hz and digitized at 500 Hz (2‐msec sampling rate) with 16‐bit resolution using automatic DC correction at 70% saturation.
EMG and DC offset potentials were removed by visual inspection and EOG artifacts were corrected algorithmically [Semlitsch et al., 1986]. Single‐trial EEG epochs were constructed from 200 msec pre‐stimulus to 1,500 msec post‐stimulus. Epochs with excessive EEG activity (±120 μV) or reaction times indicative of anticipatory (<100 msec) or slow responses (>900 msec) were rejected. Remaining epochs were baselined on the 200‐msec pre‐stimulus interval and averaged for each subject to provide averaged event‐related potentials (ERPs) at the scalp. Grand mean ERPs were derived by averaging individual subject ERPs. Noisy or clearly artifactual ERP waveforms were replaced with an average of the ERP activity from the four surrounding electrodes, weighted by distance. The P3‐like response to rare target stimuli was identified by visual inspection as a positive polarity component with a peak latency in the window obtained for the classical auditory Oddball P3 (between 300 and 650 msec), maximal over centro‐parietal locations [Fabiani et al., 1987]. It was identified separately for each subject and for the group as a whole, and latency and baseline‐to‐peak amplitude measures obtained.
MRI data collection and analysis
Magnetic resonance imaging (MRI) was performed on a commercial Siemens (Erlangen, Germany) VISION (Magnetom, 4000) 1.5 Tesla scanner with a CP Head Coil. High‐resolution T1 weighted sagittal images were obtained using a conventional MPRAGE sequence with parameters: TR 9.7 msec, TE 4 msec, TI 300 msec, flip angle 12°, FOV 256 × 256 mm, pixel size 1.0 × 1.0 mm, slice thickness 1.0 mm, 164 slices. Two high‐resolution structural MRI volumes were obtained for each subject, which were first aligned using a linear rigid body alignment (6 df; AIR 3.0) [Woods et al., 1998a,b], and then averaged to provide an MRI volume with a higher signal‐to‐noise ratio for segmentation. The averaged MRI volume was used to identify and segment the boundaries between different tissues types within the head (scalp, skull, and cortex) in preparation for modeling the realistic geometry of the head. Segmentation was carried out using semi‐automated tools (EMSE Suite; Source Signal Imaging, San Diego, CA). The boundary between white matter and cortical gray matter was identified using a combination of voxel intensity thresholds and a 3D region grow algorithm starting from a seed point located in the corpus callosum. The grow algorithm terminated once a boundary of voxels that exceeded a nominated intensity threshold was detected. This resulted in a 3D mask of all white matter regions up to the border of the inner cortical gray boundary. Any points that were incorrectly included in the region were manually edited. Finally, the 3D mask was filled to remove any voxels incorrectly omitted and used to segment the high‐resolution MRI to define the inner cortical gray boundary. The inner cortical gray boundary is required so that dipoles can be distributed throughout the cortical surface, resulting in a dipole layer that represents potential cortical generators in gray matter. An expansion algorithm then approximated the inner surface of the skull, since the skull is difficult to see on T1‐weighted images. In a series of expansion steps, by approximately one voxel in each direction per step, each voxel that shared at least one face with a voxel already inside the white matter region was assimilated into the region. Expansion was terminated once all brain regions, meninges, and CSF were included in the extended mask. The location of the outer skull boundary was then determined in an analogous expansion to a boundary adjacent to but not touching the scalp. The scalp or head boundary was determined after manually removing all extraneous extra‐scalp noise in the MRI.
Meshes were then created to approximate the surface of each tissue type (scalp, outer skull, inner skull, and cortex). This is necessary in order to define each boundary as a mathematical surface on which calculations can be performed, rather than as a discrete collection of voxels in a 3D volume. For each subject, the cortical surface was tiled using a Tetrahedral Surface Triangle algorithm (T‐SUTRA) [Greenblatt and Nichols, 2001] to respect topological features of the cortical surface. A simpler shrink‐wrap approach was used to create the mesh for each of the other surfaces. The resultant cortical meshes consisted, on average, of 38,495 surface vertices, with dipoles oriented normal to the mesh surface and distributed throughout the mesh at each vertex point (EMSE Suite; Source Signal Imaging).
Co‐registration of EEG and MRI data
During MRI acquisition, multi‐modality radiographic markers (Neuromedical Supplies, Neurosoft) were placed on the left and right pre‐auricular points and on the nasion. After EEG collection, the 3D locations of these anatomical points and the locations of each electrode were determined using a 3Space Fastrak magnetic digitizer (Polhemus, Colchester, VT). The location of each marker on the MRI image was identified by intensity differentiation. Co‐registration of the electrodes to the MRI head surface was first approximated by visual alignment of the markers. Final adjustment was completed using a least squares fit algorithm (EMSE Suite; Source Signal Imaging).
Laplacian transformation of scalp voltage data
In preparation for source localization, averaged ERPs for the target condition for each subject were transformed using a spherical spline Laplacian [Perrin et al., 1989] based on the angular position of electrodes, obtained from digitization of the electrode positions. This approach was first proposed by Nunez and Westdorp [1994], who suggested that the Laplacian could be used in conjunction with source estimation techniques to identify cortical sources. There were several reasons for applying the Laplacian transformation to the scalp ERP data. Firstly, the Laplacian transformation significantly attenuates the contribution to scalp electrical activity of deep subcortical sources, which for purposes of cortically constrained source estimation would constitute a source of noise [Babiloni et al., 2000; Nunez et al., 1994]. Secondly, this transformation provided scalp current estimates that are reference free; Nunez et al. [1991] recommend that reference‐free data be used in source modeling when the distribution and spatial frequency of sources are unknown, as is the case in the present study. Thirdly, it has been demonstrated [Babiloni et al., 2000] that the use of the Laplacian transformation prior to source localization improves the spatial localization power of weighted minimum norm source models of human somatosensory evoked potentials (SEPs); Laplacian transformed weighted minimum norm estimates resulted in lower dipole localization error and lower spatial dispersion relative to weighted minimum norm estimates based on raw untransformed potentials. Notably, the scalp Laplacian transformation provides an unambiguous metric of local radial current flowing through the skull into the scalp [Nunez et al., 1991], described in Amperes/m2 (A/m2), unlike the alternative average reference method. At the same time, it should also be noted that latency shifts in the componentry of ERP waveforms between scalp potentials and scalp current flow are a potential outcome of Laplacian transformations; such shifts are not addressed or quantified in the present study.
Cortical current density estimation
Real head, boundary element modeling using four mesh surfaces (scalp, inner and outer skull, and cerebral cortex), and homogenous and isotropic conductivities for each tissue type (skin 0.33 S/m, skull 0. 0042 S/m, brain/csf 0.33 S/m) [Geddes and Baker, 1967], which results in a conductivity ratio of 0. 0128, were used to compute the forward model. The normalized minimum norm method with realistic geometries [Crowley et al., 1989] was used to estimate a distributed source solution for each ERP time point using a pseudoinverse operator, normalized by the effective unit dipole field strength for each source [Crowley et al., 1999; Hämäläinen and Ilmoniemi, 1984; Wang et al., 1992]. Regularization was used in the estimation of cortical current density, to minimize unwanted noise sensitivity during calculation of the inverse operator. Regularization employed singular value decomposition with truncation, based on the noise power determined from the pre‐stimulus baseline. The truncation level was then set to either the noise power from the pre‐stimulus baseline or 5% of the total spectral power, whichever was smaller. The smallest singular values, whose sum was less than the truncation level, were then set to zero and omitted in the inversion. This has the effect of removing those terms in the inverse matrix with the greatest noise sensitivity, i.e., those with the highest spatial frequencies.
During cortical current density estimation, the cortical dipole mesh was sub‐sampled to enable the algorithm to run significantly faster. The algorithm uses a distance criterion measured on the surface representation of the cortex to determine which neighboring dipoles are close enough to be combined. This procedure averaged each dipole with its neighbors if the distance was 10 mm or less. The inverse solution once obtained for the reduced set of dipoles was then interpolated to all dipoles in the mesh for visualization.
The putative cortical generators of the P3‐like component were estimated for each subject from the inverse solution for the peak of the scalp component within the averaged ERP. Cortical current density is estimated as current flow (Amperes) per surface area (metres2) giving the units A/m2.
Derivation of average head model
To assess the consistency across subjects of the estimated cortical sources of the P3‐like component, an intersubject averaging technique was employed, using an approach similar to that of the Massachusetts General Hospital (MGH) group. This group has developed sophisticated cortical surface based techniques for intersubject averaged spatio‐temporal estimates of source activity [e.g., Dale et al., 2000; Halgren et al., 1998b]. Their intersubject averaging approach involves morphing the reconstructed cortical surface for each subject into an average spherical representation, which aligns sulcal and gyral features across subjects while minimizing geometric distortion [Dale et al., 1999, 2000; Fischl et al., 1999a,b]. Cortical surface based deformation procedures have been demonstrated to substantially reduce anatomical and functional variability across subjects [Dale et al., 2000], relative to the more commonly used normalization approach of Talairach et al., [1967]. In the present study, a volumetric method employing a high degree of freedom (168 df) non‐linear warping algorithm (AIR 3.0) [Woods et al., 1998a,b], rather than the spherical deformation method, was used to align the segmented cortex of individual subjects and develop an average cortical surface reconstruction.
The preparation for across subjects, cortically constrained source analysis involved two stages: 1) creation of average head model and 2) creation of the average cortical surface. An automated image registration algorithm (AIR 3.0) [Woods et al., 1998a,b] was iteratively used to align each subject's head to the standard subject (S4). Initially, a linear rigid body alignment (6 df; AIR 3.0) was performed, followed by two successive non‐linear warping iterations: 1) second‐order non‐linear (30 df) and 2) third‐order non‐linear (60 df) to register the individual subjects' heads to the standard subject. This iterative process allowed the registration to be improved until a satisfactory average head was obtained. The second stage of the development of the group average head model involved the use of a high degree of freedom (168 df), non‐linear warping algorithm to align each subject's segmented cortical surface to the standard subject (AIR 3.0). Segmentation of tissue boundaries and mesh generation were repeated in the manner described above, based on the average head (scalp, inner‐skull, outer‐skull) and average cortex mesh. Lastly, electrode positions from each subject were averaged to create a representation of the average electrode positions across the group. The putative cortical generators of the group P3‐like component were estimated from the inverse solution for the peak of the scalp component within the grand mean ERP.
RESULTS
Behavior
Subjects responded to targets with a mean reaction time of 458 msec (±SD 83.9) and a mean target detection accuracy of 96.9% (±SD 3.66).
Scalp waveforms
Figure 1 shows the averaged event‐related potential activity in μV to targets for all five subjects at 70 representative scalp sites from −200 prestimulus to 800 msec post‐stimulus. For simplicity in presentation of these data, individual subjects' waveforms are not differentiated. These potentials are presented relative to a mathematically computed linked ear reference, and low pass filtered at 14 Hz. The ERP waveforms shown in Figures 1 and 2 are those obtained after ocular artifact removal. Figure 2 includes the grand mean scalp ERP activity in μV for the target condition plotted against the non‐target condition at 70 representative scalp sites across the time window relative to a mathematically computed linked ear reference. Waveforms were low‐pass filtered at 14 Hz. The non‐target condition is shown to demonstrate the effect size of the P3‐like component to targets and was not included in any further analyses. A pronounced P3‐like component to targets, hereafter referred to as the P3, is evident at all scalp sites and maximal at PO3 and surrounding electrodes.
Figure 1.
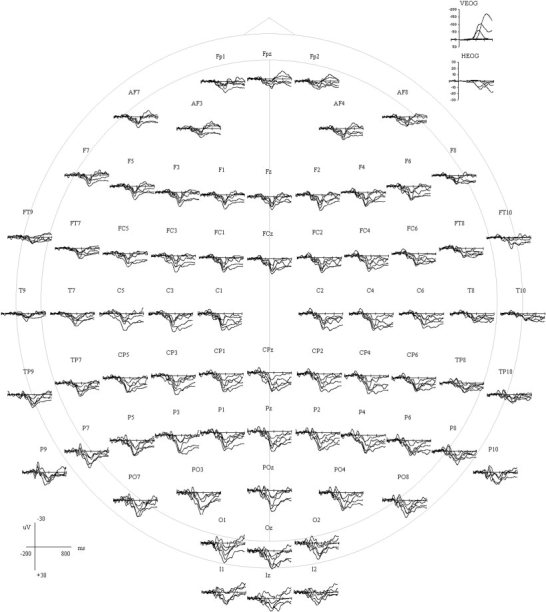
Averaged ERP activity (μV) to target words for all five subjects at 70 representative scalp sites, depicted from 200 msec pre‐stimulus to 800 msec post‐stimulus. The check marks on the x‐axis represent 200‐msec intervals. The data shown have been corrected for EOG artifact.
Figure 2.
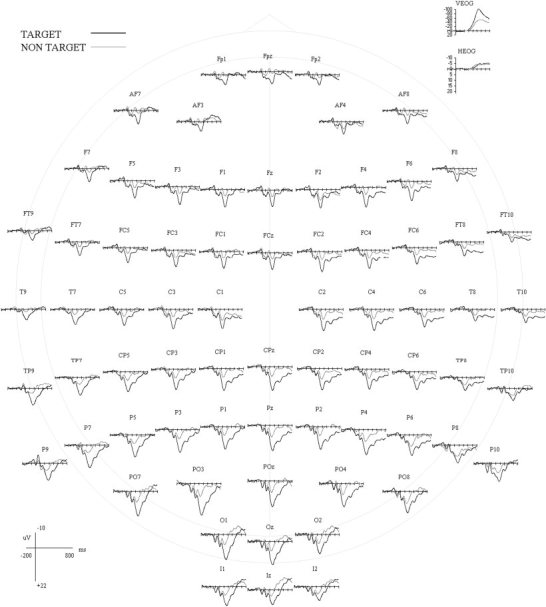
Grand average ERP activity (μV) to target words (thick line) and non‐target words (thin line) at 70 representative scalp sites, depicted from 200 msec pre‐stimulus to 800 msec post‐stimulus. The check marks on the x axis represent 200‐msec intervals. The data shown have been corrected for EOG artifact.
Scalp topography
Figure 3A shows the scalp topography of event‐related potential activity at the peak of the P3 component for the target condition from each subject overlaid on their respective scalp surfaces modeled from structural MRI. The color scale is equally weighted around zero and is assigned based on the peak amplitude of the P3 component for each subject. Scalp topographic maps are shown with contours that represent 5% steps in microvolts relative to the absolute range for each subject. A broad parietal distribution is evident across all subjects with some variability in the laterality of the strongest activity, with three subjects (S2, S4, and S5) showing activity slightly more left lateralized, one (S3) slightly more right lateralized, and one (S1) with strongest activity in the midline. One subject (S4) showed evidence of two frontal enhancements at the scalp. Figure 3B shows the scalp topography of grand mean ERP activity at the peak of the P3 component (358 msec), plotted on the group average scalp surface. A left‐sided parietal peak is clearly evident. In both single subject and group data, the dominant feature is centro‐parietally located, consistent with earlier work reporting the topography of the P3.
Figure 3.

Scalp topographic activity (μV) to target words at the peak of the P3 component for (A) individual subjects and (B) the grand mean ERP activity (group). Topographic maps were scaled equally around zero according to the maximum value (microvolts) at the peak of the P3 component with amplitudes and latencies as follows: S1 ± 26.5 μV, 340 msec; S2 ± 29 μV, 356 msec; S3 ± 17 μV, 366 msec; S4 ± 10.9 μV, 360 msec; S5 ± 25.1 μV, 360 msec; Group ± 19.8 μV, 358 msec. Isocontours were derived by partitioning scalp activity into 20 equal bands, depicting 5% steps in microvolts across the range for each subject's topographic maps. C: Cortical current density maps for individual subjects and (D) group maps shown on the modeled inner surface of cortical gray matter to target words at the peak of the scalp P3 component after spherical spline Laplacian transformation. Source activity reflects radial current density (A/m2) estimated by cortical constraint of the source solution to radial dipoles distributed equally throughout the cortex. The scalar bar indicates positive (yellow to red) and negative (blue to aqua) current source density, with CCD maps scaled equally around zero with amplitudes and latencies as follows: S1 ± 0.138 A/m2, 336 msec; S2 ± 0.203 A/m2, 336 msec; S3 ± 0. 0513 A/m2, 364 msec; S4 ± 0.231 A/m2, 332 msec; S5 ± 0. 0732 A/m2, 348 msec; Group ± 0. 0623 A/m2, 348 msec. Cortical activity for the P3 component is depicted from superior and posterior, and left and right lateral viewpoints.
Cortical current density: individual subjects
Figure 3C shows the estimated cortical current density at the peak of the P3 component in individual subjects. The cortical current density (CCD) maps are scaled equally around zero so that the negative and positive tails of the range of values (A/m2) were of equal size. The range of the scale for each subject was determined by the positive maximum current density value at the peak of that subject's P3‐like component. A threshold was applied to the middle 30% of that range (i.e., 15% on each side of the zero point of the range). This smoothed the boundaries of the reconstructed sources without significantly attenuating them and made the current density extrema easier to see.
Sources were evident predominantly in the intraparietal sulcus (IPS) and surrounding superior parietal gyrus (SPG). Sources in this region were observed consistently in all subjects with variability in the degree of lateralization and extent of activation. This can be most readily appreciated in the posterior and superior views. In four of the five subjects, sources were strongly bilateral in the IPS, whereas the other subject (S4) had activation more strongly on the left, with smaller sources on the right. The extent of the reconstructed sources in the superior parietal gyrus surrounding the IPS was more variable between subjects, with clearly bilateral activity in two subjects (S3, S5), more activity to the left in two other subjects (S2, S4), and more on the right in another subject (S1). In one case (S3), SPL activation extended anteriorly to include the postcentral gyrus (PoCG), precentral gyrus (PGC), and superior frontal gyrus (SFG) in the right hemisphere. All subjects showed small sources posterior to the SPG to include the superior occipital gyrus (SOG), which anatomically borders the intraparietal sulcus. Activity here was bilateral other than for subject S2, where it was left lateralized, and subject S5 also showed activation in the adjacent middle occipital gyrus (MOG).
In addition, there were minor sources of frontal activity in subjects S2 and S3 in and around the precentral gyrus on the left (PCG). Small regions of activation were also found posteriorly in the postcentral gyrus (PoCG) of the left hemisphere for subjects S2, S4, and S5. Two subjects (S2 and S3; see posterior and lateral views in Fig. 3) had distinct sources in basal temporal cortical areas including the mid‐fusiform gyrus (FG) bilaterally for subject S3, and in the right hemisphere for subject S2, extending medially across the anterior transverse collateral sulcus (ATCS). Further sources were observed in the lingual gyrus extending into the inferior/fourth occipital gyrus for S3 and S2 (see posterior view Fig. 3). Only one subject (S1) demonstrated source activity in the IPL, specifically in the angular gyrus (AG) bordering the lateral occipital gyrus (LOG) of the right hemisphere.
Cortical current density Intersubject average
Figure 3D shows the cortical current density estimated from the grand mean scalp activity for the group. As would be expected from the reconstructed sources in individual subjects, sources are evident predominantly in the intraparietal sulcus (IPS) and superior parietal gyrus (SPG) of the superior parietal lobe (SPL) bilaterally, extending into superior occipital gyrus. Current sources were also evident in the lingual gyrus and inferior/fourth occipital gyrus of the occipital region, with greater activity clearly apparent in the left hemisphere. Although it appears that activation in this region across the group may be the due to sources found in subjects S2 and S3, it is notable that even when ERP data were normalized across subjects for amplitude differences (data not shown), the same pattern of results were obtained, which suggests that these sources cannot be explained by increased amplitude of the P3 component in subjects S2 and S3. In contrast, activity observed in the mid‐fusiform region in S2 and S3 did not appear in the intersubject analysis.
Evolution of the P3 component
Figure 4 shows the evolving time course of the P3 between 250 and 470 msec post‐target for the intersubject average cortical current density estimate. The CCD maps shown therein are averaged in 20‐msec time windows from 250 to 470 msec post‐stimulus, at which time the late slow wave begins to predominate. The principal sources that evolve over the duration of the P3 are those in the SPG and IPS. Activity in this region first appears in a small area of the SPG in the left hemisphere in the 270–290‐msec time window, then is well established by 290–310 msec post‐target, with a substantial increase in extent to include the major portion of the SPG and IPS on the left. This period also depicts the first appearance of sources in the homologous region of the right hemisphere, which then extend (310–330 msec) to include a large portion of the SPG and the descending segment of the IPS and subsequently includes the superior portion of the IPS, mirroring equivalent activation in the left hemisphere. At the same time, left SPG and IPS sources strengthen in amplitude and continue to do so in the following period (330–350 msec). This bilateral pattern remains stable 330–370 msec post‐target, at which time (370–390 msec) activity in the left IPS and SPG begins to weaken and right IPS activity gradually diminishes in extent so that by 390–410 msec it includes only the descending segment of the IPS. Thereafter, the pattern of activity remains relatively stable in strength and extent except that by 450–470 msec post‐target there has been a slight increase in the strength of left SPG and IPS sources and a re‐emergence of activity in the superior extent of the right IPS.
Figure 4.

Group cortical current density maps to target words showing the temporal evolution of the P3 component between 250 and 470 msec post‐target. The CCD maps are averages across consecutive 20‐msec time windows. They are shown from inferior, posterior, and superior viewpoints. The scale bar indicates positive (yellow to red) and negative (blue to aqua) current source density, with each CCD map scaled to the peak of the P3 component (±0. 0623 A/m2).
In addition to these SPG and SPL sources, activity is also evident 330–350 msec post‐target in the left inferior/fourth occipital gyrus. The activation in this region of the dorsal surface of the occipital pole is much stronger on the left, but is strongly bilateral on the ventral surface of the brain. During the 350–370‐msec interval, an additional current source becomes evident in the medial lingual gyrus, predominantly on the left, with activation on the right extending slightly from the basal surface of the brain into the medial lingual gyrus. From 370–390 msec, activation in these extrastriate visual areas is remarkably stable with only a slight diminution of activation in the left medial lingual gyrus. By 390–410 msec, activity in the left medial lingual gyrus has disappeared. The remaining extrastriate activity is sustained on the left throughout the temporal window but terminates on the right by 390–410 msec post‐target.
During the evolution of the P3 component, there are also minor current sources apparent in frontal regions, though these cannot be seen easily in Figure 4. The first appearance of this activity is during the 270–290‐msec time window, when small regions of activity are evident on the left in the superior portion of the PCG, the middle frontal gyrus (MFG), and the postcentral gyrus (PoCG). By 310–330 msec this frontal activation disappears other than for a small region of the PCG until 390–410 msec when the superior PCG and PoCG activations return and remain until 430–450 msec post‐target. The left MFG returns briefly 410–450 msec post‐target after which a region in the left superior midline superior frontal gyrus (SFG) appears. By 450–470 msec, all frontal sources disappear.
Another small source is apparent during the evolution of the P3 component in the left posterior middle temporal gyrus near the temporo‐parietal‐occipital junction. This source waxes and wanes in activity over the entire time window with maximum amplitude apparent 410–430 msec post‐target. Another small source appears 370–390 msec post‐target in the AG of the right inferior parietal lobe, peaks in activity 410–450 msec, and remains thereafter but decreases slightly in extent and amplitude.
DISCUSSION
This study employed a 124‐channel EEG sensor array with high‐resolution structural MRI to identify the cortical sources of the visuo‐verbal P3 component obtained to target stimuli, without a priori assumptions about the number and locations of sources generating the P3. The source estimation technique employed was based on real head geometry obtained from structural MRI and a distributed source model constrained to the cortical surface. As expected, a scalp P3 to targets was identified broadly at centroparietal sites in all subjects. When examining the grand average scalp topography at the peak of the P3 component, left hemisphere lateralization is apparent.
Cortical localization of the P3 component
Consistent with prediction, sources of the P3 were evident in the intraparietal sulcus and superior parietal gyrus of the superior parietal lobe, with variation across subjects in the extent and laterality of regions identified. In all cases, sources were found in the superior occipital gyrus, ranging from very small sources (S3) to much larger sources (S5). Similarly, very small sources were apparent in the precentral gyrus in two subjects on the left (S2, S3), with much larger activity on the right for one subject (S3). The hypotheses that cortical generators of the P3 would include the middle frontal gyrus, supramarginal gyrus, superior temporal sulcus, and parieto‐occipital junction were not supported. Only one subject showed source activity in the inferior parietal lobe, specifically in the angular gyrus (AG) bordering the lateral occipital gyrus (LOG) of the right hemisphere. Unexpectedly, two subjects showed P3 sources in the lingual gyrus (LG) bordering the inferior/fourth occipital gyrus. Further unexpected sources were observed in basal temporal cortical areas in the mid‐fusiform gyrus (FG), extending medially across the anterior transverse collateral sulcus (ATCS). Group analysis revealed several regions that were consistently activated across subjects including the IPS and SPG extending into superior occipital gyrus, and a region in the lingual gyrus and inferior/fourth occipital gyrus predominantly on the left.
A significant part of the purpose of this study was to investigate the sources of the P3 in individual subjects in a manner that preserved the anatomical and functional variability between them [White et al., 2001]. The cortical current density estimates depicted in Figure 3c show notable variability between subjects in the sources of the P3. This variability can be characterized in terms of the occurrence of activation in particular anatomical regions, the locations of sources within such regions, the laterality of the sources, and the extent of activation in particular regions. For example, regional variability was evident with mid‐fusiform activity being found in only two (S2, S3) of the five subjects. Similarly, the locations of sources across subjects also varied within regions. For example, SPG and IPS sources were found in anterior locations for S1 whereas they were more posterior and extending into SOG for S5. The lateralization of SPG/IPS sources varied over subjects, with S2 and S4 showing strongly left lateralized activation but S1, S3, and S5 showing strong bilateral activation. Finally, the extent of activation within particular regions varied considerably. For example, the SPG/IPS source for S4 was fairly circumscribed in comparison to a much more extended source in S3. Notably, it is this last characteristic, the extent of activation within particular regions, that appears to be the most significant contributor to intersubject variability in this study, a finding consistent with the report of Xiong et al. [2000] in relation to the performance of a complex language task.
Such sources of intersubject variability could be related to any of a number of factors. For example, there are considerable inter‐individual differences in the morphology of the cortical surface. Variations in sulcal and gyral morphology have been a significant issue in neuroimaging research, where the predominant approach so far has been to investigate group effects. Several methods have been established to accommodate differences in cortical morphology (e.g., non‐linear warping algorithms such as AIR) [Woods et al., 1998] in order to combine functional data from single subjects for group analysis. Such methods clearly assist in enabling the overlap of data from functionally homologous regions between subjects [White et al., 2001], but one can only realistically assume a general correspondence of major structures. It is not clear that there is such correspondence, though, at the scale of minor sulci and gyri, or even that such structures are consistently present across all individuals. Further, structure‐function mapping may vary across individuals irrespective of morphological differences. This has been noted even in primary sensory cortical regions, with recent work identifying significant intersubject variability in functional localization within the extrastriate cortex in humans [Hasnain et al., 1998]. Finally, cognitive factors may influence variability in regional deployment during information processing; these may include, for example, strategic differences in the approach to task performance, the attentional resources and/or biases allocated or required during task performance [White et al., 2001], and differences in cognitive ability.
But despite such considerations, we were nevertheless able to identify sources in the SPG, IPS, and aspects of the lingual and fourth occipital gyri, that were common across subjects and strongly evident in the group result. These sources might, therefore, be considered to reflect the core cortical regions critical to the generation of the visuo‐verbal P3. Notably, these regions were strongly and consistently evident during the evolution of the P3 as well as at its peak. The striking stability over time of this P3 network is consistent with earlier work investigating cortical dynamics during verbal working memory processing [Clark et al., 2001].
Functional significance of cortical source activity
This section reviews the functional significance of the sources identified. The superior parietal lobe, which includes the SPG and IPS (Brodman Area [BA] 7), has been demonstrated to play a significant role in attentional networks concerned with spatial and linguistic information, working memory, and visuo‐motor integration [Lynch, 1980]. The SPL has been consistently activated in a wide range of functional neuroimaging studies of working memory involving verbal material such as letters and words [Cabeza and Nyberg, 2000]. Activation in this region has tended to be left lateralized [Awh et al., 1996; Fiez et al., 1996; Jonides et al., 1997; Rympa et al., 1999; Smith et al., 1996] in tasks that require only the maintenance of information on‐line [D'Esposito et al., 1998]. Additional activation in right SPL has been associated with an increase in working memory load [Braver et al., 1997; Cohen et al., 1997; Jonides et al., 1997], and bilateral activation of the SPL is often observed in demanding working memory tasks [Awh et al., 1996; Honey et al., 2000; LaBar et al., 1999; Schumacher et al., 1996, Smith et al., 1996], though not in all cases [Isoardi et al., 1999; Jonides et al., 1997]. Working memory studies involving numerical material have also activated this region on the left [Petrides et al., 1993] and on the right [Coull et al., 1996] and in the IPS region bilaterally [Manoach et al., 1997]. Spatial working memory tasks consistently demonstrate superior parietal activations often bilaterally, sometimes including the IPS [Belger et al., 1998; Bushara et al., 1999; Courteney et al., 1996; Owen et al., 1996; Smith et al., 1996], or on the right [Coull & Frith, 1998; Owen et al., 1998]; however, non‐verbal, object working memory tasks do not normally activate this region [Cabeza and Nyberg, 2000].
The involvement of the superior parietal lobe in a fronto‐parietal network subserving sustained attention is well accepted [Cabeza and Nyberg, 2000; Mesulam, 1998]. Neuropsychological studies have provided compelling evidence for a role of this region in attention [Andersen, 1987], as well as evidence from primate studies [see Mesulam, 1985] and human functional neuroimaging [Benedict et al., 1998; Coull et al., 1996; Pardo et al., 1991]. The strong reciprocal connections from posterior parietal cortex area PG in monkeys (dorsal portion of the inferior parietal lobe and caudal banks of the intraparietal sulcus) to the anterior cingulate gyrus, support a role for this region in attentive aspects of behavior [Goldman‐Rakic, 1988; Mesulam, 1983]. In humans, the postero‐lateral aspects of the SPL play a role in spatial information processing, including the discrimination [Faillenot et al., 1999; Sugio et al., 1999] and mental manipulation [e.g., Cohen et al., 1996; Harris et al., 2000] of spatial features, spatial attention [Anderson et al., 1994; Corbetta et al., 1993; Coull and Frith, 1998], and working memory retention of visuo‐spatial information [Bushara et al., 1999; Coull and Frith, 1998; Courtney et al., 1997; Goldberg et al., 1996; Owen et al., 1996; Zarahn et al., 1999].
However, it is clear from the activations obtained during verbal working memory and related tasks that this region also has a role in attention to linguistic stimuli. Coull and Frith [1998] demonstrated that the superior parietal cortex is involved in non‐spatial attention and related working memory processes. It has been argued, therefore, that this region is part of a general attention network that that is not only involved in visuo‐spatial attention but also involved in the processing of linguistic stimuli [Posner et al., 1988] and thus does not merely map spatial co‐ordinates [Mesulam, 1998]. Rather, this region is a critical gateway involved in accessing, binding, and integrating sensory information related to the conceptual representation and exploration of extra‐personal space [Mesulam, 1998]. Such convergence of information in this region supports the suggestion that the superior parietal lobe is implicated in visuo‐motor integration [Creutzfeldt, 1995; Hyvarinen, 1982]. In primates, this region appears to map the contralateral visual field [Galletti et al., 1999a,b] and links to anterior sensory and motor regions, which suggests a role in providing spatial information for visuo‐motor integration [e.g. Andersen et al., 1997; Caminiti et al., 1999; Galletti et al., 1995, 1997, 1999a,b; Johnson et al., 1993]. In humans, this region processes visuo‐spatial information for stimulus‐guided movement [Alexander et al., 1992; Grafton et al., 1992, 1998; Kertzman et al., 1997; Levine et al., 1978; Otsuki et al., 1999; Paolino et al., 1983]. Lesions in certain areas of the left (usually) posterior parietal lobe impair the planning and execution of object‐related and purposeful actions, termed apraxia, indicating an inability to integrate the sensory input into an action or motor symbol, even though there is no apparent motor defect [Creutzfeldt, 1995]. The inability to convert sensory stimuli into satisfactory actions, or to relate the surrounding sensory signals to a scheme of action has been found to be common to all defects of parietal lobe [Creutzfeldt, 1995].
Source activation of the SPL found in the present study supports the proposition that the IPS and SPG may have a significant role in P3 generation [Halgren et al., 1998a]. The sources identified here in the SPG and IPS were consistent with those of Hinton et al. [1999] who found activity in the SPG to targets. Further, the intraparietal sulcus has previously been suggested as a likely generator of the scalp P3 based on demonstration of local generation of P3‐like potentials in this region [Baudena et al., 1995; Halgren et al., 1998a]. The SPL is one of several areas that have been found to be involved in event‐related fMRI studies of target processing [Hinton et al., 1999]. This involvement suggests a role for these regions in attentional modulation of the contents of working memory through visuo‐motor integration, specifically the linking in working memory of sensory representations to motor programs for the purpose of contingent action. Thus, the IPS may play a role in directed attention and visuo‐motor integration, which contribute to the selection of an appropriate motor response to behaviorally relevant visual cues [Manoach et al., 1997] such as task relevant stimuli that consistently elicit a P3.
Source activity observed predominantly in the superior parietal lobe extended posteriorly into the region of the superior occipital gyrus, tracking the path of the posterior descending aspects of the IPS. Although activity in the superior occipital gyrus was unexpected, it is conceivable that these regions may be partially involved in generation of the scalp recorded P3. Architectonically, this region is the extrastriate visual association cortex (BA19) sending part of its major output to posterior parietal lobe, suggesting that the region is predominantly involved in visuo‐spatial processing [Mesulam, 1985]. The extrastriate visual association areas are extensively interconnected with other regions, and appear to be heavily involved in the integration of visual information with the brain systems subserving speech and other executive functions [Walsh, 1987]. Functional imaging studies in humans investigating spatial working memory function have repeatedly shown activity in the superior occipital gyrus, while activity in this region has also been observed during verbal and object working memory, often bilaterally [Coull et al., 1996; D'Esposito et al., 1998; Fiez et al., 1996; Salmon et al., 1996]. The left extrastriate visual association area has been activated during the encoding of letters during working memory [Rypma and D'Esposito, 1999], as well as during semantic monitoring of words during working memory [McLeod et al., 1998]. The functional significance of this region has been interpreted as possibly reflecting an increase in visual attention under certain working memory conditions [Cabeza and Nyberg, 2000].
Activation in the region including the posterior lingual gyrus and junction of the inferior/fourth occipital gyrus and posterior fusiform gyrus on the ventral surface of the brain was unexpected. However, a considerable body of functional neuroimaging [see Cabeza and Nyberg, 2000] and neuropsychological [see Friedman et al., 1993; Walsh 1987] work highlights the significance of this extrastriate region in the processing of visual word forms. Fiez and Petersen [1998] reviewed neuroimaging studies involving reading and found that the left occipital and occipitotemporal regions (BA18 and 37/19) in the posterior fusiform area were involved consistently in visual analysis of word‐like stimuli. Petersen et al. [1988, 1990] suggested that left ventral occipito‐temporal region (posterior junction of the lingual and fusiform gyri) might be part of a network that codes visual word forms. There are, however, two notable exceptions to these findings. Price et al. [1996] did not find activity in the inferior occipital/lingual/fusiform region activated when subjects were reading words compared to when viewing false fonts. However, this result could be explained by the findings of Nobre et al. [1994, 1998] who reported activation in this region to all types of letter strings. Thus, activation in this region would not have been highlighted in the statistical comparison of Price et al. [1996]. More recently, Cohen et al. [2000] found activation only in the mid portion of the left fusiform common to both left and right visual hemifield presentation of words, with hemifield specific activity in contralateral posterior and mesial occipito‐temporal region, suggesting that activity in this area may be related to early stages of visual processing rather than activity of a specific visual word form area. In contrast, though, neural generators associated with word reading have been identified in the lingual gyrus using ECD source modeling [Hinojosa et al., 2000; Kuriki et al., 1998] and in the ventral area continuous from lingual gyrus to fusiform gyrus predominantly on the left [Kuriki et al., 1998]. Lastly, activity in this region has also been observed in verbal working memory tasks on the left [Beuregard et al., 1997; Paulesu et al., 1993, 1995; Salmon et al., 1996] and bilaterally [Chee et al., 1999; Coull et al., 1996; Honey et al., 2000].
The neuropsychological literature also provides compelling evidence for the role of this region in processing visual word forms. Lesions of the left ventral occipital region and the splenium [the posterior portion of the corpus callosum) result in pure alexia (word blindness) [Walsh, 1987], which consists of a failure to recognize words without evidence of other language disorders such as speech and writing deficits [Walsh, 1987]. This syndrome evolves when areas that are thought to encode visual word‐forms in the left hemisphere are disconnected from and therefore cannot communicate with other language areas [Mesulam, 1998]. Visual information received by the right occipital lobe cannot reach the left (language) hemisphere because of interruption of the inter‐hemispheric fibers in the splenium [Walsh, 1987]. Lesions to the splenium interfere with the inter‐hemispheric transfer of visual information from the right hemisphere to the visual word form and transmodal language areas in the left hemisphere [Mesulam, 1998], usually as a result of infarction of the distribution of the posterior cerebral artery [Walsh, 1987]. Thus, pure alexia results from lesions that prevent both the ipsliateral and contralateral visual representations from reaching language areas in the left temporoparietal region [Mesulam, 1985].
Further down the ventral “what” stream of visual processing, along the basal surface of the brain in the mid‐fusiform gyrus, it has been established that there is an area specialized for the encoding of word‐forms and word‐like letter strings [Nobre et al., 1994; Puce et al., 1996]. Intracranial studies have found a positive polarity potential around 400 msec post‐stimulus in the anterior temporal lobe, which was sensitive to semantic content and not elicited by non‐words, faces or checkerboards and faces [Nobre et al., 1994]. Results suggest a specialized stream within the ventral visual pathway for processing of written words, leading to a specific region that has been located slightly laterally to the fusiform face area [Nobre et al., 1994; Puce et al., 1996]. Data from patients suggests that word processing in this region is bilateral [Nobre et al., 1994]. Kiehl et al. [1999] found bilateral activity in the fusiform for both concrete and abstract words during a lexical decision task, whereas Cohen et al. [2000] found left lateralized activations in the mid portion of the fusiform common to both left and right hemifield visual word presentation. Herbster et al. [1997] also found activation of the left fusiform when comparing irregular words with regular words, and concluded that this region was involved in semantic or symbolic analysis of visual word forms. The available evidence favors the view that the junction of the posterior fusiform, lingual gyrus, and inferior occipital gyrus has a very early role in the processing of visual word forms as it is sensitive to all types of letter strings, whereas the mid‐fusiform is sensitive to semantic content and context [Nobre et al., 1994].
Small regions of activity in pre and post‐central gyri were observed in all subjects, though not in the group result, probably due to the large intersubject variability in the relative positions of these activations. Yamazaki et al. [2000] also found P3 activation in these regions using a multiple ECD approach and attributed it to the motor readiness potential, though the support for this attribution is equivocal [Ilan and Miller, 1999; Pritchard et al., 1999; Salisbury et al., 2001]. In this instance, it is probable that such activity represents the very early stages of visuo‐motor integration in preparation for the required response to targets.
Several regions that were predicted to be active on the basis of previous literature were not found to be so in the present study. These include the middle frontal gyrus (MFG), superior temporal region (STS, STG), temporo‐parietal region, and supramarginal gyrus (SMG) of the inferior parietal lobe (IPL). Previous functional imaging studies of working memory from our laboratory, employing essentially the same paradigm [Clark et al., 2000a,b] have identified bilateral activation in dorsolateral prefrontal (MFG) and inferior parietal (SMG) cortical regions during working memory updating tasks although task comparisons did not differentiate between target and non‐target processing. The current findings are somewhat inconsistent with activation found during target processing in functional imaging studies, where activity has been observed in MFG [Krino et al., 2000; McCarthy et al., 1997], SMG [Hinton et al., 1999; Linden et al., 1999; Menon et al., 1997; McCarthy et al., 1997] and STG [Hinton et al., 1999]. A possible explanation for the inconsistency between the current results and previous fMRI studies is the issue of the temporal lag of the hemodynamic response critical to localization in functional neuroimaging studies. Even though the temporal resolution of event‐related analyses of functional imaging data is superior to conventional block designs, the technique still has inherently limited temporal resolution (seconds) in comparison to electrophysiological techniques (milliseconds). A consequence of this limitation in the temporal resolution of functional neuroimaging is that activation maps represent an integration of processes across the full time window of the event‐related potential and, therefore, identify all regions involved during task performance not simply those associated with the P3 component. In contrast, the approach employed in the present study enabled the identification of regions activated specifically during the P3 component. The principal finding of sources of the P3 to target words in the IPS and SPG provides support for the intracranial evidence of Halgren et al. [1994a]. Intracranial depth recordings have shown large amplitude, often highly focal P3‐like waveforms in the superior parietal lobe [Baudena et al., 1995; Halgren et al., 1994a, 1995a, 1998a]. It is particularly relevant that P3‐like potentials were obtained for visual and auditory stimuli, including repeated words and faces [Halgren et al., 1994a,b], suggesting the modality independence of this region.
The findings of the present study are contrary to the suggestion that activity in the inferior parietal lobe is likely to make the dominant contribution to the scalp P3 [Menon et al., 1997; Smith et al., 1990], though it has been noted [Halgren et al., 1995a] that the intracranial parietal P3 observed by Smith et al. [1990] was at an earlier latency than the conventional P3 observed at the scalp and may, thus, reflect independent functional activity. The results of the present study are also inconsistent with the findings of Yamaguchi and Knight [1991a,b] and Knight et al. [1990] who found that lesions to superior parietal region do not affect the scalp recorded P3. Further, lesions of the temporo‐parietal region, including the superior temporal gyrus (STG) and supramarginal gyrus (SMG) of the inferior parietal lobe (IPL), have consistently been associated with an absence or diminution of the scalp P3 [Knight, 1990; Knight et al., 1989; Yamaguchi and Knight, 1991a,b, 1993]. The explanation for the apparent inconsistencies with the lesion work of Yamaguchi and colleagues is unclear at this time.
It has been well argued that the MTL contributes to the generation of the scalp P3 in conjunction with more superficial cortical regions [McCarthy and Wood, 1987; McCarthy et al., 1989; Wood and McCarthy, 1985; Stapleton and Halgren, 1987]. This suggestion is apposite since the paralimbic (parahippocampal gyrus) and limbic regions (hippocampus) play a critical role in emphasizing the behavioral relevance of a stimulus [Mesulam, 1985]. However, the magnitude of the contribution of MTL activity to scalp‐recorded potentials remains unclear [Altafullah et al., 1986], since the potential due to such deep sources would be strongly attenuated during volume conduction to the scalp [Nunez, 1985]. In addition, the Laplacian transformation also introduces attenuation of deep sources, as it enhances underlying local cortical activity by reducing global contributions to the scalp potential [Nunez, 1995], thus favoring more superficial sources.
Some evidence suggests that the contribution of such deep sources to the scalp is limited to regions very close to the generating source [Altafullah et al., 1986]. Stapleton and Halgren [1987] have argued that depth potentials may be psychologically and physiologically related to an observed scalp potential whilst not be biophysically a part of the scalp electrical field. The hippocampal formation is a site of considerable neuroanatomic convergence [Zeineh, 2001] and receives its cortical input predominantly via the parahippocampal areas [Mesulam, 1985] from heteromodal association cortical areas. The posterior parietal cortex (area 7a in monkeys) has strong reciprocal disynaptic connections to area CA1 of the hippocampus [Clower et al., 2001]. It is likely that the MTL P3 activity is functionally related to the activity observed in the SPL, due to the demonstrated reciprocal interconnectivity between these regions, with some evidence to suggest that the input from the hippocampus to area 7a is stronger than the reciprocal connection from 7a [Clower et al., 2001]. Thus, although there is strong evidence to suggest an involvement of the MTL in generation of the P3, it is unlikely that activity in the MTL region is contributing significantly via volume conduction to the scalp P3.
Cortically constrained source localization methodology
The use of cortical surface constraints and distributed source models in electromagnetic scalp field analysis is a relatively recent advance [e.g., Dale and Sereno, 1993; George et al., 1995; Simpson et al, 1995]. There are, however, a number of issues relating to the method used for cortically constrained analysis. One such issue pertains to the use of the Laplacian transformation of scalp‐recorded ERPs, as opposed to using the average reference, prior to calculating the forward model. The problems surrounding the reference electrode in relation to scalp potentials have been well documented [see Nunez et al., 1991]. The method of referencing chosen can influence the outcome of source modeling since the reference must be taken into account during the calculation of the forward solution. If a physical reference is used, any error in computing the forward solution for the reference will influence the calculation for all other electrodes, giving an unacceptable bias to reference modeling errors. Thus, there is an advantage to using non‐referential montages, such as common average reference or Laplacian for source modeling.
Conventionally, the common average reference transformation has been applied to scalp voltage data to obtain reference‐free data prior to source modeling. The average reference transformation is used to approximate an inactive reference with zero potential, by subtracting the mean of all electrodes at each time point from each scalp electrode [Junghöfer et al., 1999]. The procedure assumes that the scalp activity is sufficiently random, so that the sum of potentials at each electrode will approximate zero. However, this assumption does not hold for evoked or event‐related potentials, as they are essentially non‐random due to signal averaging [Bertrand et al., 1985]. Further, the calculation of the average reference is problematic due to incomplete head coverage of conventional EEG arrays [Junghöfer et al., 1999]. Incomplete coverage biases the average reference such that it is non‐zero, thus violating a fundamental assumption of the technique [Bertrand et al., 1985]. This will cause potential amplitudes to be smaller for electrodes located in the center of the electrode array than for those located on the periphery [Junghöfer et al., 1999]. Further, the average reference transformation provides no meaningful metric for neurophysiological interpretation of estimated source activity. The related justification for using the Laplacian transformation is discussed at some length in the Method section. However, it is worth referring here to the recent work by Babiloni et al. [2000], which demonstrated significantly increased spatial localization power relative to weighted minimum norm estimates based on raw potentials, in terms of both lower dipole localization error and lower spatial dispersion.
A potential criticism of using the Laplacian transformation prior to source modeling is that it will attenuate deep cortical sources. Indeed, it has been estimated that such attenuation is two times that obtained without use of the technique. Nevertheless, the present study was able to identify deep cortical sources in the mid‐fusiform gyrus (FG) extending into the anterior transverse collateral sulcus (ATCS) in two subjects, suggesting that use of the Laplacian is a viable option. In a related matter, it is generally accepted that dipole localization algorithms tend to misinterpret widespread superficial cortical sources as localized deep sources [Nunez, 1990], so it can be argued that the spatial filtering properties of the Laplacian may help obviate such localization errors [Nunez and Westdorp, 1994].
Another matter concerns the use of the minimum norm to find a unique inverse solution [Crowley et al., 1989; Hämäläinen and Ilmoniemi, 1984; Wang et al., 1992]. There is no physiological basis for the minimum norm algorithm and so the particular anatomical localization it provides may be false. Nevertheless, by restricting the problem to the cortical surface, a constraint that offers high physiological plausibility, the potential for error is significantly reduced. Further, the minimum norm provides a relatively conservative approach with regional accuracy bought at the expense of limited spatial precision. This lack of precision helps explain the large spatial extent of many of the reconstructed sources reported in this study. Prior knowledge can be used to increase confidence in the minimum norm solution and, in the present study, the regions activated were largely consistent with those found in the relevant functional neuroimaging work. The validity of source localization may also be assessed using single subject fMRI to provide convergent source information. Ongoing work is examining this possibility by weighting ERP source estimation parameters with the fMRI source probability matrix.
The last issue for consideration is the use of group averaging to obtain a group cortically constrained result across subjects. Recent work has demonstrated the use of cortical surface–based deformation procedures to morph reconstructed cortical surfaces for each subject into an average spherical representation [Dale et al., 2000; Fischl et al., 1999a,b] that aligns sulcal and gyral features across subjects while minimizing geometric distortion. Although the present study employed a high degree of freedom non‐linear warping, it is unlikely that this approach would have been as accurate as the spherical deformation technique used by the MGH group [Dale et al., 2000; Fischl et al., 1999a,b] in representing the average cortical surface.
Conclusions
This study demonstrated cortical sources of the visuo‐verbal P3 to targets in the intraparietal sulcus, superior parietal lobe, and aspects of the lingual and fourth occipital gyri. The findings provide support for the proposition that sources in the superior parietal lobe make a significant contribution to the P3 observed at the scalp. The functional significance of activity in this region has been interpreted to reflect the involvement of working memory and associated attentional and visuo‐motor integrative processes. The concomitant activity in lingual/inferior occipital gyrus is taken to reflect activation of regions associated with the analysis of visual word forms.
Acknowledgements
This study was supported by a multi‐year Large Australian Research Council grant (A00105227 to C. R. C.), and by a National Health and Medical Research Council of Australia grant (980690).
REFERENCES
- Alexander MP, Fischer RS, Friedman R. 1992. Lesion localization in apractic agraphia. Arch Neurol 49: 246–251. [DOI] [PubMed] [Google Scholar]
- Altafullah I, Halgren E, Stapleton JM, Crandall PH. 1986. Interictal spike wave complexes in the human medial temporal lobe: Typical topography and comparisons with cognitive potentials. Electroencephalogr Clin Neurophysiol 63: 503–506. [DOI] [PubMed] [Google Scholar]
- American Electroencephalographic Society . 1991. Guidelines for standard electrode position nomenclature. J Clin Neurophysiol 8: 200–202. [PubMed] [Google Scholar]
- Anderer P, Pascual‐Marquird, Semlitsch MV, Saleto B. 1998. Differential effects of normal aging on sources of standard N1, target N1 and target P300 auditory event‐related brain potentials revealed by low resolution electromagnetic tomography (LORETA). Electroencephalogr Clin Neurophysiol 108: 160–174. [DOI] [PubMed] [Google Scholar]
- Andersen, RA . 1987. Inferior parietal lobule function in spatial perception and visuomotor integration In: Plum F, editor. Handbook of physiology, vol 5 Baltimore: American Physiological Society; p 483–518. [Google Scholar]
- Andersen RA, Snyder LH, Bradley DC, Xing J. 1997. Multimodal representation of space in the posterior parietal cortex and its use in planning movements. Annu Rev Neurosci 20: 303–320. [DOI] [PubMed] [Google Scholar]
- Anderson TJ, Jenkins IH, Brooks DJ, Hawken MB, Frackowiak RS, Kennard C. 1994. Cortical control of saccades and fixation in man. A PET study. Brain 117: 1073–1084. [DOI] [PubMed] [Google Scholar]
- Andreassi JL 1995. Psychophysiology: human behaviour and physiological response, 3rd ed. Hillsdale, NJ: Lawrence Erlbaum. [Google Scholar]
- Annett M. 1970. A classification of hand preference by association analysis. Br J Psychol 61: 303–321. [DOI] [PubMed] [Google Scholar]
- Awh E, Jonides J, Smith E, Schumacher E, Koeppe R, Katz S. 1996. Dissociation of storage and rehearsal in verbal working memory: evidence from positron emission tomography. Psychol Sci 7: 25–31. [Google Scholar]
- Babiloni, F , Babiloni, C , Locche, L , Cincotti, F , Rossini, PM , Carducci, F . 2000. High‐resolution electro‐encephalogram: source estimates of Laplacian‐transformed somatosensory‐evoked potentials using realistic subject head model constructed from magnetic resonance images. Med Biol Eng Comp 38: 512–519 [DOI] [PubMed] [Google Scholar]
- Bastuji H, García‐Larrea L. 1999. Evoked potentials as a tool for the investigation of human sleep. Sleep Med Rev 3: 23–45. [DOI] [PubMed] [Google Scholar]
- Baudena P, Halgren E, Heit G, Clarke JM. 1995. Intracerebral potentials to rare target and distractor auditory and visual stimuli. III. Frontal cortex. Electroencephalogr Clin Neurophysiol 94: 251–264. [DOI] [PubMed] [Google Scholar]
- Belger A, Puce A, Krystal JH, Gore JC, Goldman‐Rakic P, McCarthy G. 1998. Dissociation of mnemonic and perceptual processes during spatial and non‐spatial working memory using fMRI. Hum Brain Mapp 6: 14–32. [DOI] [PMC free article] [PubMed] [Google Scholar]
- Benedict RH, Frith CS, Grasby PM, Friston KJ, Paulesu E, Fracowiak RSJ, Dolan RJ. 1998. Functional neuroimaging of attention in the auditory modality. Neuroreport 9: 121–126. [DOI] [PubMed] [Google Scholar]
- Bertrand O, Perrin F, Pernier J. 1985. A theoretical justification of the average reference in topographic evoked potential studies. Electroencephalogr Clin Neurophysiol 62: 462–464. [DOI] [PubMed] [Google Scholar]
- Beauregard M, Chertkow H, Bub D, Murtha S, Dixon R, Evans A. 1997. The neural substrate for concrete, abstract and emotional word lexical. A positron emission tomography study. J Cogn Neurosci 9: 441–461. [DOI] [PubMed] [Google Scholar]
- Braver TS, Cohen JD, Nystrom LE, Jonides J, Smith EE, Noll D. 1997. A parametric study of prefrontal cortex involvement in human working memory. Neuroimage 5: 49–62. [DOI] [PubMed] [Google Scholar]
- Bushara KO, Weeks RA, Ushii K, Catalan, M‐J , Tian B, Rauchacker JP, Hallett M. 1999. Modality‐specific frontal and parietal areas for auditory and visual spatial location in humans. Nat Neurosci 2: 759–766. [DOI] [PubMed] [Google Scholar]
- Cabeza R, Nyberg L. 2000. Imaging cognition II: an empirical review of 275 PET and fMRI studies. J Cogn Neurosci 12: 1–47 [DOI] [PubMed] [Google Scholar]
- Caminiti R, Genovesio A, Marconi B, Mayer AB, Onorati P, Ferraina S, Mitsuda T, Giannetti S, Squatrito S, Maioli MG, Molinari M. 1999. Early coding of reaching: frontal and parietal association connections of parieto‐occipital cortex. Eur J Neurosci 11: 3339–3345. [DOI] [PubMed] [Google Scholar]
- Chee MWL, O'Craven K, Bergida R, Rosen B, Savoy R. 1999. Auditory and visual word processing studied with fMRI. Hum Brain Mapp 7: 15–28. [DOI] [PMC free article] [PubMed] [Google Scholar]
- Clark CR, Orr RS, Wright EK, Weber DL. 1998. Working memory updating to visual verbal stimuli: a high resolution ERP study In: Koga Y, Nagata K, Hirata K, editors. Brain topography today. Tokyo: Elsevier Science, p 173–178. [Google Scholar]
- Clark CR, Egan GF, McFarlane AC., Morris P, Weber D, Sonkilla C, Marcina J, Tochon‐Danguy HJ. 2000a. Updating working memory for words: a PET activation study. Hum Brain Mapp 9: 42–54. [DOI] [PMC free article] [PubMed] [Google Scholar]
- Clark CR, Moores KA, McFarlane AC, Lewis A, Brown G, Puce A, Egan G. Taylor J. 2000b. Linking sensory and motor representations in working memory plan formation. Neuroimage 5: S77. [Google Scholar]
- Clark CR, Moores KA, Lewis A, Weber DL, Fitzgibbon S, Greenblatt R, Brown G, Taylor J. 2001. Cortical network dynamics during verbal working memory function. Int J Psychophysiol 42: 161–176. [DOI] [PubMed] [Google Scholar]
- Clower DM, West RA, Lynch JC, Strick PL. 2001. The inferior parietal lobule is the target of output from the superior colliculus, hippocampus, and cerebellum. J Cogn Neurosci 21: 6283–6291. [DOI] [PMC free article] [PubMed] [Google Scholar]
- Cohen JD, Perlstien WM, Braver TS, Nystrom LE, Nol DC, Jonides J, Smith E. 1997. Temporal dynamics of brain activation during a working memory task. Nature 386: 604–608. [DOI] [PubMed] [Google Scholar]
- Cohen L, Dehaene S, Naccache L, Lehééricy S, Dehaene‐Lambertz G, Hénaff MA, Michel F. 2000. The visual word form area: spatial and temporal characterisation of an initial stage of reading in normal subjects and posterior split‐brain patients. Brain 123: 291–307. [DOI] [PubMed] [Google Scholar]
- Cohen M, Kosslyn S, Breiter H, DiGirolamo G, Thompson W, Anderson A, Bookheimer S, Rosen B, Belliveau J. 1996. Changes in cortical activity during mental rotation: a mapping study using functional MRI. Brain 119: 89–100. [DOI] [PubMed] [Google Scholar]
- Corbetta M, Miezin FM, Shulman GL, Petersen SE. 1993. A PET study of visuospatial attention. J Neurosci 13: 1202–1226. [DOI] [PMC free article] [PubMed] [Google Scholar]
- Courtney SM, Ungerleider LG, Keil K, Haxby JV. 1996. Object and spatial visual working memory activate separate neural systems in human cortex. Cereb Cortex 6: 39–49. [DOI] [PubMed] [Google Scholar]
- Courtney SM, Ungerleider LG, Keil K, Haxby JV. 1997. Transient and sustained activity in a distributed neural system for human working memory. Nature 386: 608–611. [DOI] [PubMed] [Google Scholar]
- Coull JT, Frith CD. 1998. Differential activation of right superior parietal cortex and intraparietal sulcus by spatial and nonspatial attention. Neuroimage 8: 176–187. [DOI] [PubMed] [Google Scholar]
- Coull JT, Frith CD, Frackowiak RSJ, Grasby PM. 1996. A fronto‐parietal network for rapid visual information processing: PET study of sustained attention and working memory. Neuropsychologia 34: 1085–1095. [DOI] [PubMed] [Google Scholar]
- Creutzfeldt OD. 1995. Cortex cerebri. Oxford: Oxford University Press. [Google Scholar]
- Crowley CW, Greenblatt RE, Khalil I. 1989). Minimum norm estimation of current distributions in realistic geometries In: Williamson SJ, Hoke M, Stroink G, Kotani M, editors. Advances in biomagnetism. New York: Plenum Press, p 603–606. [Google Scholar]
- Crowley TA, Haupt CD, Kynor DB. 1999. A weighting matrix to remove depth bias in the linear biomagnetic inverse problem with application to cardiology In: Aine CJ, Okada Y, Stroink, Swithenby SJ, Wood CC, editors. Proceedings of the 10th International Conference on Biomagnetism. New York: Springer, p 197–200. [Google Scholar]
- Dale A, Sereno M. 1993. Improved localization of cortical activity by combining EEG and MEG with MRI cortical surface reconstruction: a linear approach. J Cog Neurosci 5: 162–176. [DOI] [PubMed] [Google Scholar]
- Dale A, Fischl B, Sereno M. 1999. Cortical surface‐based analysis: 1. Segmentation and surface reconstruction. Neuroimage 9: 179–194. [DOI] [PubMed] [Google Scholar]
- Dale A, Liu AK, Fischl BR, Buckner RL, Belliveau JW, Lewine JD, Halgren E. 2000. Dynamic statistical parametric mapping: Combining fMRI and MEG for high‐resolution imaging of cortical activity. Neuron 26: 55–67. [DOI] [PubMed] [Google Scholar]
- Daruna JH, Nelson AV, Green JB. 1989. Unilateral temporal lobe lesions alter P300 scalp topography. Int J Neurosci 46: 243–247. [DOI] [PubMed] [Google Scholar]
- de Munck JC. 1992. A linear discretization of the volume conductor boundary integral equation using analytically integrated elements. IEEE Trans Biomed Eng 39: 986–990. [DOI] [PubMed] [Google Scholar]
- D'Espostio M, Aguirre GK, Zarahn E, Ballard D, Shin RK, Lease J. 1998. . Functional MRI studies of spatial and nonspatial working memory. Brain Res Cogn Brain Res 7: 1–13. [DOI] [PubMed] [Google Scholar]
- Donchin E, Coles MGH. 1988. Is the P300 component a manifestation of context updating? Behav Brain Sci 11: 357–374. [Google Scholar]
- Fabiani M, Gratton G, Karis D, Donchin E. 1987. The definition, identification and reliability of measurement of the P300 component of the event‐related brain potential In: Ackles PK, Jennings JR, Coles MG, editors. Advances in psychophysiology, vol 2 Greenwhich, CT: JAI Press, p 1–78. [Google Scholar]
- Faillenot I, Decety J, Jeannerod M. 1999. Human brain activity related to the perception of spatial features of objects. Neuroimage 10: 114–124. [DOI] [PubMed] [Google Scholar]
- Fiez JA, Petersen SE. 1998. Neuroimaging studies of word reading. Proc Natl Acad Sci USA 95: 914–921. [DOI] [PMC free article] [PubMed] [Google Scholar]
- Fiez JA, Raife EA, Balota DA, Schwarz JP, Raichle M. 1996. A positron emission tomoraphy study of the short‐term maintenance of verbal information. J Neurosci 16: 808–822. [DOI] [PMC free article] [PubMed] [Google Scholar]
- Fischl B, Sereno M, Dale A. 1999a. Cortical surface‐based analysis: II. Inflation, flattening, and a surface‐based coordinate system. Neuroimage 9: 195–207. [DOI] [PubMed] [Google Scholar]
- Fischl B, Sereno M, Tootell RBH, Dale AM. 1999b. High‐resolution inter‐subject averaging and a coordinate system for the cortical surface. Hum Brain Mapp 8: 272–284. [DOI] [PMC free article] [PubMed] [Google Scholar]
- Freidman R, Ween JE, Albert ML. 1993. Alexia In: Heilman KM, Valenstein E, editors. Clinical neuropsychology. New York: Oxford University Press, p 37–62. [Google Scholar]
- Frodl T, Meisenzahl EM, Müller D, Leinsingerm G, Juckel G, Hahn K, Möller HJ, Hergerl U. 2001. The effect of the skull on event‐related P300. Clin Neurophysiol 112: 1773–1776. [DOI] [PubMed] [Google Scholar]
- Galletti C, Battaglini PP, Fattori P. 1995. Eye position influence on the parieto‐occipital area PO (V6) of the macaque monkey. Eur J Neurosci 7: 2486–2501. [DOI] [PubMed] [Google Scholar]
- Galletti C, Fattori P, Kutz DF, Battaglini PP. 1997. Arm movement‐related neurons in the visual area V6A of the macaque superior parietal lobule. Eur J Neurosci 9: 410–413. [DOI] [PubMed] [Google Scholar]
- Galletti C, Fattori P, Kutz DF, Gamberini M. 1999a. Brain location and visual topography of cortical area V6A in the macaque monkey. Eur J Neurosci 11: 575–582. [DOI] [PubMed] [Google Scholar]
- Galletti C, Fattori P, Gamberini M, Kutz DF. 1999b. The cortical visual area V6: brain location and visual topography. Eur J Neurosci 11: 3922–3936. [DOI] [PubMed] [Google Scholar]
- Geddes LA, Baker LE. 1967. The specific resistance of biological materials: a compendium of data for the biomedical engineer and physiologist. Med Biol Eng 5: 271–293. [DOI] [PubMed] [Google Scholar]
- George J, Aine C, Mosher J, Schmidt D, Ranken D, Schlitt H, Wood C, Lewine J, Sanders J, Belliveau J. 1995. Mapping function in the human brain with magnetoencephalography, anatomical magnet resonance imaging, and functional magnetic resonance imaging. J Clin Neurophysiol 12: 406–431. [DOI] [PubMed] [Google Scholar]
- Goldberg TE, Berman KF, Randolph C, Gold JM, Weinberger, DR . 1996. Isolating the mnemonic component in spatial delayed response: a controlled PET 15O‐labelled water regional cerebral blood flow study in normal humans. Neuroimage 3: 69–78. [DOI] [PubMed] [Google Scholar]
- Grafton ST, Mazziotta JC, Woods RP, Phelps ME. 1992. Human functional anatomy of visually guided finger movements. Brain 115: 565–587. [DOI] [PubMed] [Google Scholar]
- Grafton ST, Fagg AH, Arbib MA. 1998. Dorsal premotor cortex and conditional movement selection: PET functional mapping study. J Neurophysiol 79: 1092–1097. [DOI] [PubMed] [Google Scholar]
- Goldman‐Rakic PS. 1988. Topography of cognition: parallel distributed networks in primate association cortex. Ann Rev Neurosci 11: 137–156. [DOI] [PubMed] [Google Scholar]
- Gordon E, Sloggett S, Harvey I, Kraiuhun C, Rennie C, Yiannikas C, Meares R. 1987. Magnetoencephalography: locating the source of P300 via magnetic field recording. Clin Exp Neurol 23: 101–110. [PubMed] [Google Scholar]
- Gordon E, Rennie C, Collins L. 1990. Magnetoencephalography and late component ERPs. Clin Exp Neurol 27: 113–120. [PubMed] [Google Scholar]
- Goto Y, Brigell MG, Parmeggiani L. 1996. Dipole‐modelling of the visual evoked P300. J Psychosom Res 41: 71–79. [DOI] [PubMed] [Google Scholar]
- Greenblatt RE, Nichols JD. 2001. T‐Sutra: a surface tiling algorithm for volumetric image data. Neuroimage 13: S134. [Google Scholar]
- Halgren E, Squires NK, Wilson C, Rohrbaugh JW, Babb TL, Crandall PH. 1980. Endogenous potentials generated in the human hippocampal formation and amygdala by infrequent events. Science 210: 803–805. [DOI] [PubMed] [Google Scholar]
- Halgren E, Stapleton JM, Smith M, Altafullah I. 1986. Generators of the human scalp P3(s) In: Cracco RQ, Bodis‐Wolner I, editors. Evoked potentials, III. Boston: Butterworths, p 269–284. [Google Scholar]
- Halgren E, Baudena P, Heit G, Clarke M, Marinkiovic K. 1994a. Spatio‐temporal stages in face and word processing. 1. Depth recorded potentials in the human occipital and parietal lobes. J Physiol Paris 88: 1–50. [DOI] [PubMed] [Google Scholar]
- Halgren E, Baudena P, Heit G, Clarke M, Marinkiovic K, Chauvel P. 1994b. Spatio‐temporal stages in face and word processing. 2. Depth recorded potentials in the human frontal and Rolandic cortices. J Physiol Paris 88: 51–84. [DOI] [PubMed] [Google Scholar]
- Halgren E, Baudena P, Clarke JM, Heit G, Liégois C, Chauvel P, Musolino A. 1995a. Intracerebral potentials to rare target and distractor auditory and visual stimuli. I. Superior temporal plane and parietal lobe. Electroencephalogr Clin Neurophysiol 94: 191–220. [DOI] [PubMed] [Google Scholar]
- Halgren E, Baudena P, Clarke JM, Heit G, Marinkovic K, Devaux B, Vignal JP, Biraben A. 1995b. Intracerebral potentials to rare target and distractor auditory and visual stimuli. II. Medial, lateral and posterior temporal lobe. Electroencephalogr Clin Neurophysiol 94: 229–250. [DOI] [PubMed] [Google Scholar]
- Halgren E, Marinkovic K, Chauvel P. 1998a. Generators of the late cognitive potentials in auditory and visual oddball tasks. Electroencephalogr Clin Neurophysiol 106: 156–164. [DOI] [PubMed] [Google Scholar]
- Halgren E, Lewine JD, Marinkovic K, Buckner RL, Paulson KM, Chauvel P, Rosen BR, Dale AM. 1998b. Anatomically‐constrained distributed cortical activation patterns from MEG during word‐processing: Validation using fMRI and intracranial EEG. Neuroimage 7: S175. [Google Scholar]
- Hämäläinen M, Ilmoniemi R. 1984). Interpreting measured magnetic fields of the brain: estimates of current distributions. Helsinki Univ Tech Rep TKK‐F‐A559.
- Hämäläinen M, Sarvas J. 1989. Realistic conductivity geometry model of the human head for interpretation of neuromagnetic data. IEEE Trans Biomed Eng 36: 165–171. [DOI] [PubMed] [Google Scholar]
- Harris IM, Egan GF, Sonkkila C, Tochon‐Danguy HJ, Paxinos G, Watson JDG. 2000. Selective right parietal lobe activation during mental rotation: parametric PET study. Brain 123: 65–73. [DOI] [PubMed] [Google Scholar]
- Hasnain MK, Fox PT, Woldorf MG. 1998. Intersubject variability of functional areas in the human visual cortex. Hum Brain Mapp 6: 301–315. [DOI] [PMC free article] [PubMed] [Google Scholar]
- He B, Lian J, Spencer KM, Dien J, Donchin E. 2001. A cortical potential imaging analysis of the P300 and novelty P3 components. Hum Brain Mapp 12: 120–130. [DOI] [PMC free article] [PubMed] [Google Scholar]
- Hegerl U, Frodl‐Bauch T. 1997. Dipole source analysis of P300 component of the auditory evoked potential: a methodological advance? Psychiatry Res 74: 109–118. [DOI] [PubMed] [Google Scholar]
- Herbster AN, Mintun MA, Nebes RD, Becker JT. 1997. Regional cerebral blood flow during word and nonword reading. Hum Brain Mapp 5: 84–92. [DOI] [PubMed] [Google Scholar]
- Hinojosa JA, Martín‐Loeches M, Gómez‐Jarabo G, Rubia FJ. 2000. Common basal extrastriate areas for the semantic processing of words and pictures. Clin Neurophysiol 111: 552–560. [DOI] [PubMed] [Google Scholar]
- Hinton SC, MacFall JR, McCarthy G. 1999. Posterior and frontal activation by auditory targets and novel sounds: an event‐related functional magnetic resonance imaging study. Neuroimage 9: S793. [Google Scholar]
- Honey GD, Bullmore ET, Sharma T. 2000. Prolonged reaction time to verbal working memory task predicts increased power of posterior parietal cortical activation. Neuroimage 12: 495–503. [DOI] [PubMed] [Google Scholar]
- Huppertz HJ, Hoegg S, Sick C, Lücking CH, Zenter J, Schulze‐Bonhage A, Kristeva‐Feige R. 2001. Cortical current density reconstruction of interictal epileptiform activity in temporal lobe epilepsy. Clin Neurophysiol 112: 1761–1772. [DOI] [PubMed] [Google Scholar]
- Hyvarinen J. 1982. Posterior parietal lobe of the primate brain. Physiol Rev 62: 1060–1129. [DOI] [PubMed] [Google Scholar]
- Isoardi RA, Townsend DW, Carter CS, Herbster A, Dachille MA, Cidis Meltzer C. 1999. A study of injected dose for brain mapping on the SCAT HR+: Activation maps for a parametric verbal working memory task. Neuroimage 9: 145–153. [DOI] [PubMed] [Google Scholar]
- Ilan AB, Miller J. 1999. A distinction between the initiation and the continuation of response preparation. Psychophysiology 36: 209–219. [PubMed] [Google Scholar]
- Jentzsch I, Sommer W. 2001. Sequence‐sensitive subcomponents of P300: Topographical analyses and dipole source localization. Psychophysiology 38: 607–621. [PubMed] [Google Scholar]
- Ji J, Porjesz B, Begleiter H, Chorlian D. 1999. P300: the similarities and differences in the scalp distribution of visual and auditory modality. Brain Topogr 11: 315–327. [DOI] [PubMed] [Google Scholar]
- Johnson R. 1988. Scalp‐recorded P300 activity in patients following unilateral temporal lobectomy. Brain 111: 1517–1529. [DOI] [PubMed] [Google Scholar]
- Johnson R. 1989. Auditory and visual P300s in temporal lobectomy patients: evidence for modality‐dependent generators. Psychophysiology 26: 633–650. [DOI] [PubMed] [Google Scholar]
- Johnson R. 1993. On the neural generators of the P300 component of the event‐related potential. Psychophysiology 30: 90–97. [DOI] [PubMed] [Google Scholar]
- Jonides J, Schumacher EH, Smith EE, Lauber EJ, Awh E, Minoshima S, Koeppe RA. 1997. Verbal working memory load affects regional brain activation as measured by PET. J Cogn Neurosci 9: 462–475. [DOI] [PubMed] [Google Scholar]
- Junghöfer M, Elbert T, Tucker DM, Braun C. 1999. The polar average reference effect: a bias in estimating head surface integral in EEG recording. Clin Neurophysiol 110: 1149–1155. [DOI] [PubMed] [Google Scholar]
- Kertzman C, Schwarz U, Zeffiro TA, Hallett M. 1997. The role of posterior parietal cortex in visually guided reaching movements in humans. Exp Brain Res 114: 170–183. [DOI] [PubMed] [Google Scholar]
- Kiehl F, Liddle PF, Smith AM, Mendrek A, Forster BB, Hare RD. 1999. Neural pathways involved in the processing of concrete and abstract words. Hum Brain Mapp 7: 225–233. [DOI] [PMC free article] [PubMed] [Google Scholar]
- Kincses WE, Braun C, Kaiser S, Elbert T. 1999. Modelling extended sources of event‐related potentials using anatomical and physiological constraints. Hum Brain Mapp 8: 182–193. [DOI] [PMC free article] [PubMed] [Google Scholar]
- Kiss I, Dashieff RM, Lordeon P. 1989. A parieto‐occipital generator for P300: evidence from human intracranial recordings. Int J Neurosci 49: 133–139. [DOI] [PubMed] [Google Scholar]
- Knight RT. 1991. Effects of hippocampal lesions on the human P300. Neurosci Abstracts 17: S657. [Google Scholar]
- Knight RT. 1990. Neural mechanisms of event‐related potentials: Evidence from human lesion studies In: Rohrbaugh JW, Parasuraman R, Johnson R, editors. Event‐related brain potentials: basic issues and applications. Oxford: Oxford University Press, p 3–18. [Google Scholar]
- Knight RT. 1996. Contribution of human hippocampal regions to novelty detection. Nature 383: 256–259 [DOI] [PubMed] [Google Scholar]
- Knight RT, Scabini D, Woods D, Clayworth C. 1987. Differential effects of unilateral parietal or temporo‐parietal lesions on human N200‐P300. Neurosci Abstracts 22: S521. [Google Scholar]
- Knight RT, Scabini D, Woods DL, Clayworth C. 1989a. Contributions of temporal‐parietal junction to the human auditory P3. Brain Res 502: 109–116. [DOI] [PubMed] [Google Scholar]
- Knight RT, Scabini D, Woods D, Clayworth C. 1989b. The effects of lesions of superior temporal gyrus and inferior parietal lobe on temporal and vertex components of the human AEP. Electroencephalogr Clin Neurophysiol 70: 499–509. [DOI] [PubMed] [Google Scholar]
- Krino E, Belger A, Goldman‐Rakic P, McCarthy G. 2000. Prefontal activation evoked by infrequent target and novel stimuli in a visual target detection task: an event‐related functional magnetic resonance imaging study. J Neurosci 20: 6612–6618. [DOI] [PMC free article] [PubMed] [Google Scholar]
- Kucera H, Francis N W. 1967. Computational analysis of present‐day American English. Providence, RI: Brown University Press. [Google Scholar]
- Kuriki S, Takeuchi F, Hirata Y. 1998. Neural processing of words in the human extrastriate visual cortex. Brain Res Cogn Brain Res 6: 193–203. [DOI] [PubMed] [Google Scholar]
- Law SK. 1993. Thickness and resistivity variations over the upper surface of the human skull. Brain Topogr 6: 99–109. [DOI] [PubMed] [Google Scholar]
- LaBar KS, Gitelman DR, Parrish TB, Mesulam MM. 1999. Neuroanatomic overlap of working memory and spatial attention networks: a functional MRI comparison within subjects. Neuroimage 10: 695–704. [DOI] [PubMed] [Google Scholar]
- Levine DN, Kaufman KJ, Mohr JP. 1978. Inaccurate reaching associated with a superior parietal lobe tumor. Neurology 28: 555–561. [DOI] [PubMed] [Google Scholar]
- Lewine D, Roeder SBW, Oakley MT, Arthur DL, Aine CJ, George JS, Flynn ER. 1989. A modality specific neuromagnetic P3 In: Williamson S, Hoke M, Stroink G, Kotani M, editors. Advances in biomagnetism. New York: Plenum Press, p 229–232. [Google Scholar]
- Linden DE, Prvulovic D, Formisano E, Vollinger M, Zanella FE, Goebel R, Dierks T. 1999. The functional neuroanatomy of target detection: an fMRI study of visual and auditory oddball tasks. Cereb Cortex 9: 815–823. [DOI] [PubMed] [Google Scholar]
- Lynch JC. 1980. The functional organisation of posterior parietal association cortex. Behav Brain Sci 3: 484–534. [Google Scholar]
- Manoach DS, Schlaug G, Siwert B, Darby D, Bly BM, Benfield A, Edelma R, Warach S. 1997. Prefrontal cortex fMRI signal changes are correlated with working memory load. Neuroreport 8: 545–549. [DOI] [PubMed] [Google Scholar]
- McCarthy G, Wood CC. 1987. Intracranial recordings of endogenous ERPs in humans. Electroencephalogr Clin Neurophysiol Suppl 39: 331–337. [PubMed] [Google Scholar]
- McCarthy G, Wood CC, Williamson PD, Spencer D. 1989. Task‐dependent field potentials in human hippocampal formation. J Neuroscience 9: 4253–4268. [DOI] [PMC free article] [PubMed] [Google Scholar]
- McCarthy G, Luby M, Gore J, Goldman‐Rakic P. 1997. Infrequent events transiently activate human prefrontal and parietal cortex as measured by functional MRI. J Neurophysiol 77: 1630–1634. [DOI] [PubMed] [Google Scholar]
- McLeod AK, Buckner RL, Miezin FM, Petersen SE, Raichle ME. 1998. Right anterior prefrontal cortex activation during semantic monitoring and working memory. Neuroimage 7: 41–48. [DOI] [PubMed] [Google Scholar]
- Mecklinger A, Ullsperger P. 1995. The P300 to novel and target events: a sophisticated dipole model analysis. Neuroreport 7: 241–245. [PubMed] [Google Scholar]
- Mecklinger A, Maess B, Opitz B, Pfeifer E, Cheyne D, Weinberg H. 1998. A MEG analysis of the P300 in visual discrimintation tasks. Electroencephalogr Clin Neurophysiol 108: 45–56. [DOI] [PubMed] [Google Scholar]
- Meijs JWH, Weier OW, Peters MJ and van Oosterom A. 1989. On the numerical accuracy of the boundary element method. IEEE Trans Biomed Engr 36: 1038–1049. [DOI] [PubMed] [Google Scholar]
- Menon V, Ford JM, Lim KO, Glover GH, Pfefferbaum A. 1997. Combined event‐related fMRI and EEG evidence for temporal‐parietal cortex activation during target detection. Neuroreport 8: 3029–3037. [DOI] [PubMed] [Google Scholar]
- Mesulam M‐M. 1983. The functional anatomy and hemispheric specialisation for directed attention. Trends Neurosci 6: 384–387. [Google Scholar]
- Mesulam M‐M. 1985. Patterns in behavioural neuroanatomy. Association areas, the limbic system, and hemispheric specialisation In: Mesulam M‐M, editor. Priniples of behavioural neurology. Philadelphia: FA Davis, p 1–70. [Google Scholar]
- Mesulam M‐M. 1998. From sensation to cognition. Brain 121: 1013–1052. [DOI] [PubMed] [Google Scholar]
- Nelson HE. 1992. National Adult Reading Test, 2nd ed. Berkshire, England: NFER‐Nelson Publishing Co. [Google Scholar]
- Neshige R, Luders H. 1992. Recording of event‐related potentials (P300) from human cortex. J Clin Neurophysiol 9: 294–298. [DOI] [PubMed] [Google Scholar]
- Nishitani N, Ikeda A, Nagamine T, Honda M, Mikuni N, Taki W, Kimura J, Shibasaki H. 1999. The role of the hippocampus in auditory processing studied by event‐related electric potentials and magnetic fields in epilepsy patients before and after temporal lobectomy. Brain 122: 687–707. [DOI] [PubMed] [Google Scholar]
- Nobre AC, Allison T, McCarthy G. 1994. Word recognition in the human inferior temporal lobe. Nature 372: 260–263. [DOI] [PubMed] [Google Scholar]
- Nobre AC, Allison T, McCarthy G. 1998. Modulation of human extrastriate visual processing by selective attention to colours and words. Brain 121: 1357–1368. [DOI] [PubMed] [Google Scholar]
- Nunez P. 1981. Electric fields of the brain. Oxford: Oxford University Press. [Google Scholar]
- Nunez P. 1985. Physical principles and neurophysiological mechanisms underlying event‐related potentials In: Nunez P, editor. Neocortical dynamics and human EEG rhythms. New York: Oxford University Press, p 19–36. [Google Scholar]
- Nunez PL, Westdorp AF. 1994. The surface Laplacian, high resolution EEG and controversies. Brain Topogr 6: 221–226. [DOI] [PubMed] [Google Scholar]
- Nunez PL, Pilgreen KL, Westdorp AF, Law SK, Nelson AV. 1991. A visual study of surface potentials and Laplacians due to distributed neocortical sources: computer simulated and evoked potentials. Brain Topogr 4: 151–168. [DOI] [PubMed] [Google Scholar]
- Nunez PL, Silberstein RB, Cadusch PJ, Wijesinghe RS, Westdorp AF, Srinivasan R. 1994. A theoretical and experimental study of high resolution EEG based on surface Laplacians and cortical imaging. Electroencephalogr Clin Neurophysiol 90: 40–57. [DOI] [PubMed] [Google Scholar]
- Okada TC, Kaufman L, Williamson SJ. 1983. The hippocampal formation as a source of the slow endogenous potentials. Electroencephalogr Clin Neurophysiol 55: 417–426. [DOI] [PubMed] [Google Scholar]
- Onofrj M, Gambi D, Fulgente T, Bazzano S, Colamartino P. 1991. Persistence of P3 component in severe amnestic syndrome. Electroencephalogr Clin Neurophysiol 87: 480–484. [DOI] [PubMed] [Google Scholar]
- Onofrj M, Fulgente T, Nobilio D, Malatesta G, Bazzano S, Colamartino P, Gambi D. 1992a. P3 recordings in patients with bilateral temporal lobe lesions. Neurology 42: 1762–1767. [DOI] [PubMed] [Google Scholar]
- Onofrj M, Curatola L, Malatesta G, Colamartino P, Bazzano S, Fulgente T, Ferracci F. 1992b. Delayed P3 event‐related potentials (ERPs) in thalamic haemorrhage. Electroencephalogr Clin Neurophysiol 83: 52–61. [DOI] [PubMed] [Google Scholar]
- Optiz B, Mecklinger A, von Cramon DY, Kruggel F. 1999. Combining electrophysiological and hemodynamic measures of the auditory oddball. Psychophysiology 36: 124–147. [DOI] [PubMed] [Google Scholar]
- Otsuki M, Soma Y, Arai T, Otsuka A, Tsuji S. 1999. Pure apraxic agraphia with abnormal writing stroke sequences: report of a Japanese patient with a left superior parietal haemorrhage. J Neurol Neurosurg Psychiatry 66: 233–237. [DOI] [PMC free article] [PubMed] [Google Scholar]
- Owen AM, Doyen J, Petrides M and Evans AC. 1996. Planning and spatial working memory: a positron emission study in humans. Eur J Neurosci 8: 353–364. [DOI] [PubMed] [Google Scholar]
- Owen AM, Stern CE, Look RB, Tracey I, Rosen B, Petrides M. 1998. Functional organization of spatial and nonspatial working memory processing within the human lateral frontal cortex. Proc Natl Acad Sci USA 95: 7721–7726 [DOI] [PMC free article] [PubMed] [Google Scholar]
- Paller KA, Zola‐Morgan S, Squire L, Hillyard S. 1988. P3‐like brain waves in normal monkeys and in monkeys with medial temporal lesions. Behav Neurosci 102: 714–725. [DOI] [PubMed] [Google Scholar]
- Paller KA, McCarthy G, Roessler E, Allison T, Wood CC. 1992. Potentials evoked in human and monkey medial temporal lobe during auditory and visual oddball paradigms. Electroencephalogr Clin Neurophysiol 84: 269–279. [DOI] [PubMed] [Google Scholar]
- Paolino E, De Bastiani P, Monetti VC, Boldrini P, Rosati G. 1983. Pure, “aphasic” agraphia due to damage of the left superior parietal lobule. Ital J Neurol Sci 4: 233–237. [DOI] [PubMed] [Google Scholar]
- Pardo JV, Fox PT, Raichle ME. 1991. Localization of a human system for sustained attention by positron emission tomography. Nature 349: 61–63. [DOI] [PubMed] [Google Scholar]
- Paulesu E, Frith CD, Frackowiak RS. 1993. The neural correlates of the verbal component of working memory. Nature 362: 342–345. [DOI] [PubMed] [Google Scholar]
- Paulesu E, Connelly A, Frith CD, Friston K, Heather J, Myers R, Gadian D, Frackowiak RS. 1995. Functional MR imaging correlations with positron emission tomography. In: Drayer BP, editor. Neurosurg Clin N Am 5: 207–225. [PubMed] [Google Scholar]
- Perrin F, Pernier J, Bertrand O, Echallier JF. 1989. Spherical splines for scalp potential and current density mapping. Electroencephalogr Clin Neurophysiol 72: 184–187. [DOI] [PubMed] [Google Scholar]
- Perrin F, Garcia‐Larrea L, Mauguiere F, Bastuji H. 1999. A differential brain response to the subject's own name persists during sleep. Clin Neurophysiol 110: 2153–2164. [DOI] [PubMed] [Google Scholar]
- Petersen SE, Fox PT, Posner MI, Mintun M, Raichle ME. 1988. Positron emission tomographic studies of the cortical anatomy of single‐word processing. Nature 331: 585–589. [DOI] [PubMed] [Google Scholar]
- Petersen SE, Fox PT, Posner MI, Mintun M, Raichle ME. 1989. Positron emission tomographic studies of the processing of single words. J Cogn Neurosci 1: 153–170. [DOI] [PubMed] [Google Scholar]
- Petersen SE, Fox PT, Synder AZ, Raichle ME. 1990. Activation of extrastriate and frontal cortical areas by visual words and word‐like stimuli. Science 240: 1041–1044 [DOI] [PubMed] [Google Scholar]
- Petrides M, Alivistos B, Meyer E, Evans A. 1993. Functional activation of the human frontal cortex during the performance of verbal working memory tasks. Proc Natl Acad Sci USA 90: 878–882. [DOI] [PMC free article] [PubMed] [Google Scholar]
- Polich J, Squire LR. 1993. P300 from amnesic patients with bilateral hippocampal lesions. Electroencephalogr Clin Neurophysiol 86: 408–417 [DOI] [PubMed] [Google Scholar]
- Posner MI, Petersen SE, Fox PT, Raichle M. 1988. Localization of vognitive operations in the human brain. Science 240: 1627–1631. [DOI] [PubMed] [Google Scholar]
- Price CJ, Wise RJS, Watson JDG, Patterson K, Howard D, Frackowiak RSJ. 1996. Brain activity during reading: the effects of exposure duration and task. Brain 117: 1255–1269. [DOI] [PubMed] [Google Scholar]
- Pritchard WS, Houlihan ME, Robinson JH. 1999. P300 and response selection. A new look using independent component analysis. Brain Topogr 12: 31–37. [DOI] [PubMed] [Google Scholar]
- Puce A, Kalnins RM, Berkovic SF, Donnan GA, Bladin PF. 1989. Limbic P3 potentials, seizure localization and surgical pathology in temporal lobe epilepsy. Ann Neurol 26: 377–385. [DOI] [PubMed] [Google Scholar]
- Puce A, Allison T, Asgari M, Gore JC, McCarthy G. 1996. Differential sensitivity of human visual cortex to faces, letterstrings, and textures: a functional magnetic resonance imaging study. J Neurosci 16: 5205–5215. [DOI] [PMC free article] [PubMed] [Google Scholar]
- Rappaport M, McCandless KL, Pond W, Krafft MC. 1991. Passive P300 response in traumatic brain injury patients. J Neuropsychiatry Clin Neurosci 3: 180–185. [DOI] [PubMed] [Google Scholar]
- Rogers RL, Baumann SB, Papanicolaou AC, Bourbon TW, Alagarsamy S, Eisenberg HM. 1991. Localization of P3 sources using magnetoencephalography and magnetic resonance imaging. Electroencephalogr Clin Neurophysiol 79: 308–321 [DOI] [PubMed] [Google Scholar]
- Rugg MD, Pickles CD, Potterm DP, Roberts RC. 1991. Normal P300 following extensive damage to the left medial temporal lobe. J Neurol Neurosurg Psychiat 54: 217–222. [DOI] [PMC free article] [PubMed] [Google Scholar]
- Rympa B, D'Esposito M. 1999. The roles of prefrontal brain regions in components of working memory: effects of memory load and individual differences. Proc Natl Acad Sci USA 96: 6558–6563. [DOI] [PMC free article] [PubMed] [Google Scholar]
- Rympa B, Prabhakaran V, Desmond JE, Glover G, Gabrieli JDE. 1999. Load‐dependent roles of frontal brain regions in the maintenance of working memory. Neuroimage 9: 216–226. [DOI] [PubMed] [Google Scholar]
- Salisbury DF, Rutherford B, Shenton ME, McCarley RW. 2001. Button‐pressing affects P300 amplitude and scalp topography. Clin Neurophysiol 112: 1676–1684. [DOI] [PMC free article] [PubMed] [Google Scholar]
- Salmon E, Van der Linden M, Collette F, Delfiore G, Maquet P, Degueldre C, Luxen A, Franck G. 1996. Regional brain activity during working memory tasks. Brain 119: 1617–1625. [DOI] [PubMed] [Google Scholar]
- Scheffers MK, Johnson R Jr, Ruchkin DS. 1991. P300 in patients with unilateral temporal lobectomies: the effects of reduced stimulus quality. Psychophysiology 28: 274–284. [DOI] [PubMed] [Google Scholar]
- Schumacher EH, Lauber E, Awh E, Jonides J, Smith EE, Koeppe RA. 1996. PET evidence for an amodal verbal working memory system. Neuroimage 3: 79–88. [DOI] [PubMed] [Google Scholar]
- Semlitsch HV, Anderer P, Schuster P, Presslich O. 1986. A solution for reliable and valid reduction of ocular artifacts, applied to the P300 ERP. Psychophysiology 23: 695–703. [DOI] [PubMed] [Google Scholar]
- Simpson G, Pflieger M, Foxe J, Ahlfors S, Vaughan H, Hrabe J, Ilmoniemi R, Lantos G. 1995. Dynamic neuroimaging of brain function. J Clin Neurophysiol 12: 432–449. [DOI] [PubMed] [Google Scholar]
- Smith E, Jonides J, Koeppe R. 1996. Dissociating verbal and spatial working memory using PET. Cereb Cortex 6: 11–20. [DOI] [PubMed] [Google Scholar]
- Smith E, Halgren E, Sokolik MM, Baudena P, Musolino A, Liegeois‐Chauvel C, Chauvel P. 1990. The intracranial topography of the P3 event‐related potential elicited during auditory oddball. Electroencephalogr Clin Neurophysiol 76: 235–248. [DOI] [PubMed] [Google Scholar]
- Stapleton JM, Halgren E. 1987. Endogenous potentials evoked in simple cognitive tasks: Depth components and task correlates. Electroencephalogr Clin Neurophysiol 67: 44–52. [DOI] [PubMed] [Google Scholar]
- Stapleton JM, Halgren E, Moreno KA. 1987. Endogenous potentials after anterior temporal lobectomy. Neuropsychologia 25: 549–557 [DOI] [PubMed] [Google Scholar]
- Sutton S, Braren M, Zubin J. 1965. Evoked potential correlates of stimulus uncertainty. Science 150: 1187–1188. [DOI] [PubMed] [Google Scholar]
- Sugio T, Inui T, Matsuo K, Matsuzawa M, Glover GH, Nakai T. 1999. The role of the posterior parietal cortex in human object recognition: a functional magnetic resonance imaging study. Neurosci Lett 276: 45–48. [DOI] [PubMed] [Google Scholar]
- Talairach J, Szikla G, Tournoux P, Prossalentis A, Bordas‐Ferrer M, Covello L, Jaco M, Mempel E. 1967. Atlas d'Anatomie Stereotaxique du Telencephale. Paris: Masson et Cie. [Google Scholar]
- Tarkka IM, Stokic DS. 1998. Source localization of P300 from oddball, single stimulus and omitted‐stimulus paradigms. Brain Topography 11: 141–151. [DOI] [PubMed] [Google Scholar]
- Tarkka IM, Stokic DS, Basile LFH, Papanicolaou AC. 1995. Electric source localization of the auditory P300 agrees with magnetic source localization. Electroencephalogr Clin Neurophysiol 96: 538–545. [DOI] [PubMed] [Google Scholar]
- Tarkka IM, Micheloyannis S, Stoic DS. 1996. Generators of human P300 elicited by somatosensory stimuli using muliple dipole source analysis. Neuroscience 75: 275–287. [DOI] [PubMed] [Google Scholar]
- Turetsky B, Raz J, Fein G. 1990. Representation of multi‐channel evoked potential data using a dipole component model of intracranial generators: application to the auditory p 300. Electroencephalogr Clin Neurophysiol 76: 540–556. [DOI] [PubMed] [Google Scholar]
- Verleger R. 1988. Event‐realted potentials and cognition: A critique of the context updating hypothesis and an alternative interpretation of the P3. Behav Brain Sci 11: 343–427. [Google Scholar]
- Waberski TD, Buchner H, Lehnertz K, Hufnagel A, Fuchs M, Beckmann R, Rienäcker A. 1998. Properties of advanced headmodelling and source reconstruction for the localization of epileptiform activity. Brain Topogr 10: 283–290 [DOI] [PubMed] [Google Scholar]
- Wang JZ, Williamson SJ, Kaufman L. 1992. Magnetic source images determined by a lead‐field analysis: the unique minimum‐norm least squares estimation. IEEE Trans Biomed Eng 39: 665–675. [DOI] [PubMed] [Google Scholar]
- Walsh K. 1987. Neuropsycology: A Clinical Approach, 2nd ed. Edinburgh: Churchill Livingstone. [Google Scholar]
- Wechsler D. 1981. Wechsler Adult Intelligence Scale (Revised). New York: The Psychological Corporation. [Google Scholar]
- White T, O'Leary D, Magnotta V, Arndt S, Flaum M, Andreasen NC. 2001. Anatomic and functional variability: the effects of filter size in group fMRI data analysis. Neuroimage 13: 577–588. [DOI] [PubMed] [Google Scholar]
- Wood CC, McCarthy G. 1985. A possible frontal lobe contribution to scalp P300. Neuroscience Abstracts 11: 879. [Google Scholar]
- Woods RP, Grafton S, Holmes CJ, Cherry SR, Mazziotta JC. 1998a. Automated image registration: I. General methods and intrasubject, intramodality validity. J Comput Assist Tomogr 22: 139–152. [DOI] [PubMed] [Google Scholar]
- Woods RP, Grafton S, Watson J, Sicotte NL, Mazziotta JC. 1998b. Automated image registration: II. Intersubject validation of linear and non‐linear methods. J Comput Assist Tomogr 22: 153–165. [DOI] [PubMed] [Google Scholar]
- Xiong J, Rao S, Jerabek P, Zamarripa F, Woldorf M, Lancaster J, Fox P. 2000. Intersubject variability in cortical activations during a complex language task. Neuroimage, 12: 326–339. [DOI] [PubMed] [Google Scholar]
- Yamaguchi S, Knight RT. 1991a. Anterior and posterior association cortex contributions to the somatosensory P300. J Neurosci 11: 2039–2054. [DOI] [PMC free article] [PubMed] [Google Scholar]
- Yamaguchi S, Knight RT. 1991b. P300 generation by novel somatosensory stimuli. Electroencephalogr Clin Neurophysiol 78: 50–55 [DOI] [PubMed] [Google Scholar]
- Yamaguchi S, Knight RT. 1993. Association cortex contributions to the human P3 In: Haschke W, Roitbak AI, Speckman EJ, editors. Slow potential changes in the Brain. Boston: Birkhauser, p 71–84. [Google Scholar]
- Yamazaki T, Kamijo K, Kenmochi A, Fukuzumi S, Kiyuna T, Takaki Y, Kuroiwa Y. 2000. Multiple equivalent current dipole source localization of visual event‐related potentials during oddball paradigm with motor response. Brain Topogr 12: 159–175. [DOI] [PubMed] [Google Scholar]
- Yamazaki T, Kamijo K, Kiyuna T, Takaki Y, Kuroiwa Y. 2001. Multiple dipole analysis of visual event‐related potentials during oddball paradigm with silent counting. Brain Topogr 13: 161–168. [DOI] [PubMed] [Google Scholar]
- Zarahn E, Aguirre GK, D'Esposito M. 1999. Temporal isolation of the neural correlates of spatial mnemonic processing with fMRI. Brain Res Cogn Brain Res. 7: 255–268. [DOI] [PubMed] [Google Scholar]
- Zeineh MM, Engel SA, Thompson PM, Bookheimer S. 2001. Unfolding the human hippocampus with high resolution structural and functional MRI. Anat Rec New Anatomist 265: 111–120. [DOI] [PubMed] [Google Scholar]