

Abstract
The emergence of transcranial magnetic stimulation (TMS) as a tool for investigating the brain has been remarkable over the past decade. While many centers are now using TMS, little has been done to automate the delivery of planned TMS stimulation for research and/or clinical use. We report on an image‐guided robotically positioned TMS system (irTMS) developed for this purpose. Stimulation sites are selected from functional images overlaid onto anatomical MR images, and the system calculates a treatment plan and robotically positions the TMS coil following that plan. A new theory, stating that cortical response to TMS is highest when the induced E‐field is oriented parallel to cortical columns, is used by the irTMS system for planning the position and orientation of the TMS coil. This automated approach to TMS planning and delivery provides a consistent and optimized method for TMS stimulation of cortical regions of the brain. We evaluated the positional accuracy and utility of the irTMS system with a B‐shaped TMS coil. Treatment plans were evaluated for sites widely distributed about a head phantom with well‐defined landmarks. The overall accuracy in positioning the planned site of the TMS coil was approximately 2 mm, similar to that reported for the robot alone. The estimated maximum range of error in planned vs. delivered E‐field strength was +4%, suggesting a high degree of accuracy and reproducibility in the planned use of the irTMS system. Hum. Brain Mapping 22:329–340, 2004. © 2004 Wiley‐Liss, Inc.
Keywords: TMS, robot, TMS aiming accuracy, TMS aiming reproducibility
INTRODUCTION
Transcranial magnetic stimulation (TMS) can produce highly localized and reproducible brain stimulation for use in functional brain mapping studies. This intrinsic capability, with a TMS coil properly positioned, provides a means to selectively activate many brain areas. Though TMS has been used in brain studies for over a decade, little progress has been made in automating the planning and delivery of TMS stimulations. Early TMS usage was limited to the mapping of motor areas where coil positioning was guided by electrophysiological and/or visual monitoring [Brasil‐Neto et al., 1992; Cohen and Hallett, 1988; Wassermann et al., 1996]. These studies led to a somewhat unexpected finding, that small changes in position and/or orientation of the TMS coil could result in a loss of motor response, emphasizing the need for accurate holding and aiming. In areas where feedback was not possible the TMS coil was usually positioned near to the site of interest with an orientation that mimicked that used for motor areas. A coordinate‐based method for TMS planning and positioning was introduced as a means to stimulate sites away from motor areas [Paus, 1996]. Image‐guided selection of stimulation sites using MRI and positioning using stereotactic methods soon followed [Herwig et al., 2001; Krings et al., 1997; Paus and Wolforth, 1998; Wassermann et al., 1996]. Another attractive image‐guided aiming scheme uses functional image overlays in high‐resolution MR images to select stimulation sites [Fox et al., 2004; George et al., 1996; Krings et al., 2001; Pascual‐Leone et al., 1996; Paus, 1999]. PET studies of TMS‐induced changes in cerebral blood flow (CBF) show that regional changes in blood flow are small compared to the volume of cortical tissue exposed to supra‐threshold stimulation intensities [Fox et al., 1997, 2004; Paus et al., 1997; Paus and Wolforth, 1998], indicative of a localized response within cortical tissue. This highly focal response of TMS has been used for topographic mapping of the hand motor area [Brasil‐Neto et al., 1992; Cohen and Hallett, 1988; Krings et al., 2001; Wassermann et al., 1996].
A major problem in developing an automated TMS planning system has been the lack of a theory to predict brain response from TMS stimulation. A recent theory [Fox et al., 2004], based on the theoretical relationship between TMS‐induced electric fields (E‐fields) and the orientation of sensitive brain circuits, supports planning and testing of brain response. E‐fields induced by TMS coils vary spatially in both intensity and direction, and the response within the brain also varies with E‐field orientation [Amassian et al., 1990, 1992; Mills et al., 1992; Ruohonen, 1998]. The interaction of E‐field orientation and the brain's directional response is believed to be the major contributor to the highly localized response to TMS in the brain. The aiming theory of Fox et al. [2004] states that the TMS‐induced E‐field vector should be aligned with cortical columns to achieve optimal directional sensitivity, and that the effective E‐field can be calculated as the cosine of the angle between the E‐field direction and that of cortical columns. The direction of the TMS‐induced E‐field within the brain is principally tangential to the head surface [Tofts, 1990], a direction that is normal to many sulcal banks and, therefore, parallel to many cortical columns. The cortical‐column alignment theory appears to be consistent with numerous TMS/PET studies performed in our laboratory where activations near the TMS coil were small and mostly found along sulcal banks. Another theory suggests that neuronal stimulation by TMS in vivo often occurs at “ends” or “bends” of axons [Amassian et al., 1992, 1994; Ruohonen, 1998]. A corollary to this theory is that the most efficient, i.e., lowest threshold, stimulation occurs when the E‐field is parallel to an axon's axis and strongest near an end or bend. The cortical‐column alignment theory predicts this preferred configuration near the cortical end of axons, where both “end” and “bend” effects are possible near sulcal banks. An alternate theory suggests that TMS stimulations occur via interneurons [Day et al., 1989], but none of the proposed theories are sufficient to explain all observations. The theory of Fox et al. [2004], by providing a means to predict the local directional sensitivity of cortical areas, supports planned delivery of consistent, localized stimulation intensity to many brain areas and was, therefore, selected as the theoretical basis for testing the positioning capability of the irTMS system. Accurately controlled TMS systems that make use of its highly directional capability should significantly advance our ability to plan and deliver localized TMS for both research and clinical uses.
Early TMS imaging studies relied on manual or crude mechanical means for positioning and holding stimulator coils [Fox et al., 1997; Paus et al., 1997]. Recent developments in holding and positioning systems for TMS coils include the Image‐Guided TMS system called Brainsight™ Frameless from Rogue Research (Montreal, Canada). This commercial system integrates functional and MR images for planning and uses a frameless positioning and holding mechanism for positioning TMS coils. The accuracy and reproducibility of this device have not been reported. A commercially available neuronavigation system, modified in a way to hold a TMS coil, was recently described that provided detailed mapping of the primary motor cortex as an aid to neurosurgery [Krings et al., 2001]. The reported accuracy was approximately 1 cm in locating several hand muscle areas when compared with direct electrical brain stimulation. Both of these TMS systems provide a means to monitor and detect when a subject has moved.
Robotic systems can provide exceptional aiming and holding capabilities for TMS coils. Commercial medical robotic systems are now used in clinical settings such as neurosurgery (NeuroMate, ISS, Paris, France) and radiation oncology (Accuray, Sunnyvale, CA). The Accuray robot‐arm based stereotactic radiosurgery system called CyberKnife® has a reported positional accuracy of 1.1 mm [Chang et al., 2003]. Recently a robotic system was developed for hair transplantation [Gildenberg, 2003] suggesting safe and cost effective use of robotic devices about the head. An image‐based robotically positioned TMS system (irTMS) has been developed at the Research Imaging Center. This system integrates the cortical‐column aiming theory for planning with the TMS coil positioning and holding capabilities of a robotic system. The exceptional planning and delivery capabilities of the irTMS system led to its use in several funded research projects (NSF‐0225711 and Dana Foundation). Preliminary data indicate that accurate and systematic TMS coil positioning can be achieved by this system using functional and anatomical imaging and robotics. The purpose of this investigation is to evaluate the positional accuracy, reproducibility, and utility of the irTMS system.
IRTMS System Description
Important steps of image‐guided robotically positioned TMS are: (1) determining target sites using anatomical (3‐D MRI) and coregistered functional images (PET or fMRI), (2) planning the coil pose for each site from these 3‐D images, (3) registering the in situ head to its 3‐D MR image, (4) registering the robot's coordinate system to the in situ head, and (5) and robotically positioning the TMS coil to the planned pose. Errors associated with each of these steps contribute to the overall or “application” accuracy for the TMS/Robotic system. These five steps are implemented in the irTMS system as follows:
-
1
Determining Target Site(s). Target sites are selected while viewing orthogonal sections of MR images with overlaid co‐registered statistical parametric functional images (SPI) (Fig. 1). A TMS user picks one or more sites of interest, and an option is provided to find the centroid of the functional activity around the site of interest in the SPI.
-
2
Planning the TMS Coil Pose. The goal of a plan is to position the B‐shaped coil body such that its treatment axis passes through the targeted site, scalp‐to‐target distance is minimized, and orientation about the treatment axis follows the cortical‐column aiming theory (Fig. 1). This orientation scheme assumes that the greatest stimulation efficiency occurs if the TMS coil's induced E‐field (y‐axis) is parallel to cortical columns, i.e., normal to the surface of the cortex at the targeted site (Fig. 2). The in‐air E‐field for the Cadwell figure‐eight coil was calculated using previously published methods [Davey et al. 1991; Roth et al. 1991; Tofts, 1990], and its calibration verified along the treatment axis using a field probe [Epstein et al. 1990]. In the irTMS system, this E‐field was modeled as a 3‐D vector field sampled at 1‐mm resolution (see Fig. 2). This modeling supports the interchangeable use of coils with different shapes and sizes. The magnitude and direction of the E‐field at a planned site is easily found from this model, and the output of the Cadwell HRS power supply adjusted to set the planned E‐field strength at the target site. The cortical column direction is estimated for a treatment site as the direction normal to the cortical surface. The irTMS system calculates the coil pose parameters for each planned site.
-
3
Registration of In Situ Head to Its MR Image. The registration scheme for the image‐guided TMS system aligns the in situ head to an MR image of the head using 3‐D head surface models of each. The in situ head surface model is a collection of 3‐D coordinates acquired about the head surface using a mechanical 3‐D digitizer (Microscribe 3DLX, Immersion Corp., San Jose, CA). This manually digitized in situ head model is sparsely sampled (∼1,000 points) using an evenly distributed pattern (Fig. 3). This digitizing pattern is similar to that suggested by Wang et al. [1994] for registration of a manually digitized head surface to a patient's MR image of the head. A small spherical tip is used with the digitizer stylus to collect this data. This stylus/tip combination is not painful when pressing against the scalp and is not hampered by hair. The manually digitized head surface must come from regions of the head that are rigid. To meet this requirement, points are selectively digitized about the upper scalp in an area similar to that approximately covered by a hat. For this reason, the in situ head surface model is called a “hat” model.
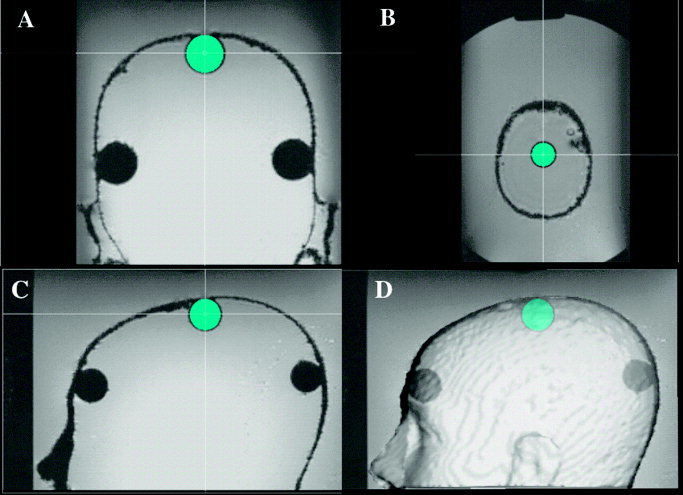
Figure 1.
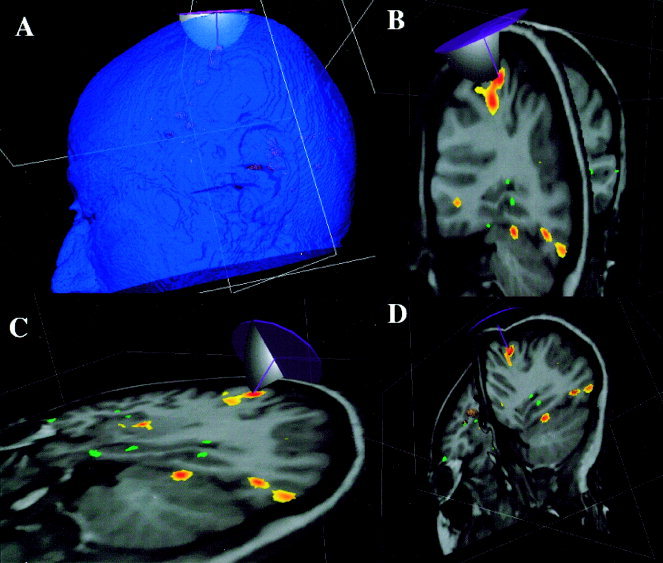
The relationship between head surface, treatment site, and TMS coil are illustrated in A. The treatment‐planning component of the irTMS system provides three orthogonal views to assist the user in pinpointing the treatment site while viewing an MRI with functional image overlaid (B–D). Surface of TMS coil body is simulated as a circular disk and modeled magnitude of the E‐field is shown in one plane.
Figure 2.
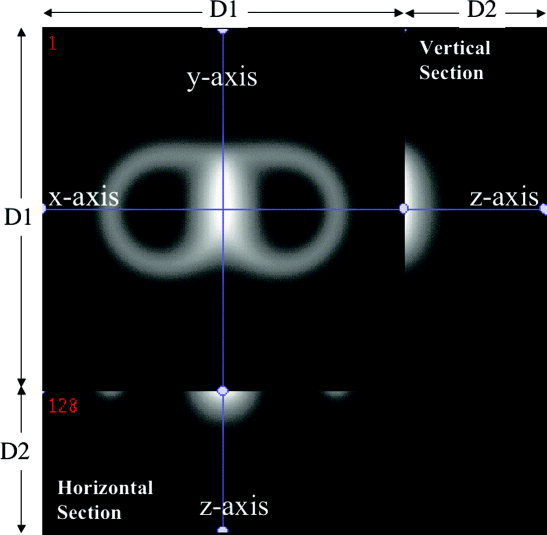
Image of calculated magnitude of E‐field of the Cadwell B‐shaped TMS coil. The highest magnitude seen centrally was used to define the x‐y‐z origin for the coil. The horizontal section illustrates the field in the x–‐z plane and the vertical section illustrates the field in the y–z plane. The largest magnitude is always along the z‐axis, the designated treatment axis. The E‐field along the z‐axis is directed parallel to the y‐axis. D1 = 256 mm, D2 = 100 mm.
Figure 3.
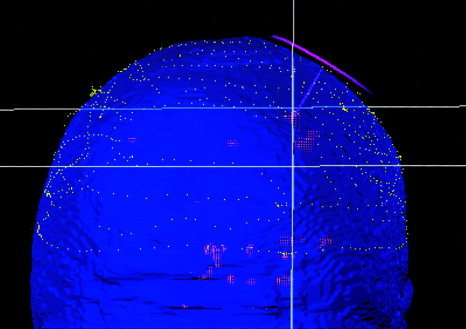
The in situ head surface data from manual digitizer (dotted lines) fitted to the head surface data from MRI (surface rendered). The TMS coil pose, treatment axis, and targeted functional site are also shown.
An MR‐derived head surface model is formed as a series of contours spanning most of the head surface. This model is, therefore, called a “head” model. The head surface is relatively easy to detect in T1‐weighted 3‐D MR images using a surface threshold value to define surface contours. Contours are organized into contiguous sections (one for each MR section image) each containing a collection of paired 2‐D coordinates describing the exterior surface of the head. The MRI‐derived contours have approximately 12,000 points when sampled from a 2‐mm 3‐D grid (Fig. 3).
The goal is to register the hat model (in situ head surface) to the head model (MRI head surface) by iteratively adjusting the hat. A 9‐parameter affine coordinate transform is used to translate, rotate, and scale points in the hat model during this registration process. The objective is to find the coordinate transformation that minimizes the sum square error of the distance between points in the hat model and corresponding locations in the head model. The algorithm is identical to that used for surface‐based head and brain registration [Lancaster et al., 1999; Pelizzari et al., 1989]. Before registration, a subject's head is immobilized using an individually fitted thermoplastic facial mask. The time to register a subject's head is less than 5 min mostly due to the time to manually digitize the scalp. After registration, the 9‐parameter transform and its inverse can be used to transform between coordinates in the in situ head and those in the MR image of the head, and vice versa.
A Talairach‐like coordinate system is used with the anterior commissure as the origin, the anterior‐to‐posterior commissure line forming the y‐axis, and the mid‐sagittal plane as the y‐z plane. The coordinate sense is +x to the right, +y to the front, and +z to the top of the head. This brain‐based right‐handed coordinate system is used for recording all registration and positioning data for the robotic system.
-
4
Registering Robot to In Situ Head. The robot is moved to a location near the immobilized in situ head and manual digitizer, and remains at this location for the duration of the study. Locations of landmarks near the end of the NeuroMate robot arm (on joint‐5) are known in the robot's coordinate system from previous calibration using the manual digitizer. These landmarks are recorded by the 3‐D digitizer and used to calculate a transform from the robot coordinate frame to the brain‐based coordinate system. This registration determines the transform from robot coordinates to the standard‐head (MRI based) coordinate system that is registered to the in situ head, completing the overall system spatial calibration.
-
5
Positioning the TMS Coil by the Robot. Properly moving the TMS coil requires accurate forward and inverse kinematics equations of the robot. The added TMS coil holder with sixth axis (Fig. 4) required a modification of the original kinematics equations. When positioning the coil, it is necessary to avoid any contact with the head by any part of the TMS coil body and/or robot arm. A graphic simulator is being developed that includes coil, robot arm, and the patient's scalp to preview planned positioning and movement. The current collision avoidance scheme is to manually move the robot arm/TMS coil to a safe pose, then to use automated positioning software to move the TMS coil in small steps to the planned pose. Several safety features are built into the irTMS system including a live‐man switch that must be activated while the robot is moving and multiple emergency‐stop switches (Fig. 4).
Figure 4.
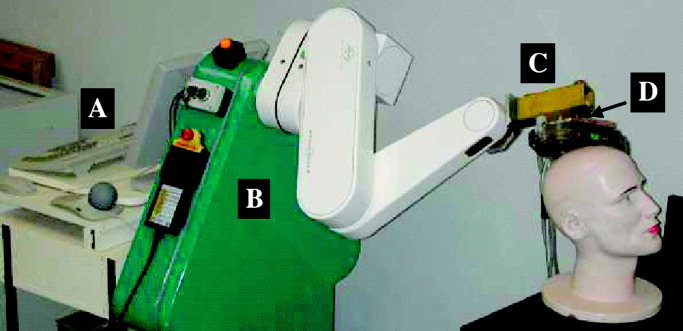
The irTMS robotic system with (A) the computer for processing and controlling planned positioning of the TMS coil, (B) the Neuromate robot arm, (C) the added TMS coil holder, and (D) the 6th axis for coil rotation.
Materials and Methods
Manual Digitizer Evaluation
The Microscribe‐3DLX has a large workspace (1.67‐m diameter) with a specified accuracy of ±0.3 mm (100‐point one‐inch diameter ANSI sphere). The digitizer was sent to the manufacturer for recalibration before testing began. A quality control test was performed following the manufacturer's instructions to verify proper operation before testing with the phantom. An additional test was performed to verify that the Microscribe‐3DLX calibration was consistent for x, y, and z directed measurements. This test evaluated the radius of circles (25, 50, 75, 100, 125 mm) inscribed into a Plexiglas calibration tool. The calibration tool was first tested with a high‐accuracy digitizer (±0.005 mm; model 3000i, Romer Cimcore, Farmington Hills, MI), yielding a baseline radius measurement error of 0.08 mm. The mean measured radius error for the Microscribe‐3DLX digitizer was small (within ±0.30 mm) and similar for three orthogonal orientations of the calibration tool, verifying consistent calibration for x, y, and z directions.
Phantom Development
To compare planned with actual TMS positioning, a test phantom simulating the head was constructed to mimic conditions of in vivo use of the irTMS system. Landmarks that could be accurately digitized in high‐resolution 3‐D MR images and in situ (Fig. 5) were built into the phantom. The head phantom was constructed using a hollow hard‐plastic head‐to‐shoulder mannequin (http://www.buymannequins.com/heads.htm, Daves Sur+, Frankford, DE). The shoulder region was removed and the head‐neck portion mounted onto a clear Plexiglas base. Nine landmarks (1‐inch‐diameter spheres) were permanently attached along the inner surface of the head phantom. This inner‐surface positioning of the spheres was chosen so that they would not interfere with head surface extraction from the MR image or with manual digitization of the head surface, and these landmarks were near cortical sites of interest in human brains. The spatial distribution of the landmarks was chosen to have them near and between the standard x, y, and z axes of the head (Fig. 5).
Figure 5.

The head phantom illustrating positions of spheres used as landmarks. Inset: The tapered channels that determined the manually digitized center of a sphere.
The centers of the nine spheres served as head‐based landmarks for testing. The center of each sphere was mechanically established using small precision‐drilled channels (Fig. 5, inset). The design was such that the stylus tip of the manual 3‐D digitizer stopped at the sphere's center when fitted snugly into the channels. Plugs were used to fill the channels when acquiring MR images of the phantom providing a more natural head surface (Fig. 6).
Figure 6.
MR image of spheres illustrating fitting of the sphere model to sphere 8 in (A) coronal, (B) axial, (C) sagittal sections, and (D) a 3‐D surface rendered view. Crosshairs mark the center of the fitted sphere.
Before attaching the spheres to the phantom, each was evaluated to determine if its mechanical center was sufficiently close to its theoretical center. Coordinates for the theoretical center of twelve spheres were estimated by fitting a spherical model to digitized surface points. Each sphere was tested while firmly held in position using a mold that spanned the lower ⅛th of the sphere. This arrangement exposed approximately ¾ of the sphere's surface for digitization. Twelve evenly distributed points were digitized about the exposed surface of each sphere. A least square error fit of these 12 points was used to mathematically estimate the coordinates of each sphere's theoretical center. Each sphere's mechanical center (x‐y‐z coordinate) was also measured twice and averaged using the 3‐D digitizer. Nine spheres were selected for use in the phantom. The difference between theoretical and mechanical centers for these nine spheres ranged from 0.20 to 0.55 mm (mean = 0.40 ± 0.11 mm).
MRI Data Acquisition and Preprocessing
The head phantom was placed in a water cylinder and imaged using a high‐resolution 3‐D spoiled gradient echo sequence on a 1.9T Elscint/GE Prestige imager (TR/TE/flip angle = 33/6/35). The image was acquired as sagittal slices with 1‐mm spacing in the three cardinal directions. The MR image was resliced to 2‐mm spacing for subsequent processing, consistent with the approach used by Li et al. [2002] in their evaluation of the NeuroMate robot arm. The head surface was segmented using a single threshold value (Figs. 1A and 3). Coordinates for points from the head surface were converted to a head model using our convex hull software [Lancaster, et al. 1999].
Extraction of Landmarks From MRI
The x‐y‐z coordinate of the center of each sphere was determined from MRI by co‐registering a 3‐D graphical model of a sphere with the sphere's 3‐D MR image (Fig. 6). The radius and position of a transparent spherical model were adjusted with a precision of 0.1 mm while viewing the model overlaid on an MR image of the sphere (within the head phantom). Co‐registration was done while viewing axial, sagittal, and coronal sections, and adjustments were iterated until the model was well aligned in all three views (Fig. 6). Inter‐observer variability of this manual task was evaluated in three individuals, each recording the coordinates of the center of all nine spheres. Analysis of variance showed no significance difference in the sphere locations (P > 0.9) across users, and inter‐observer correlations were high (R > 0.99) for each coordinate axis. The standard deviation of sphere centers across all users was small for each landmark (< 0.2 mm). The mean x‐y‐z coordinate from all measurements of the center of each sphere was designated as the MRI landmark site of the sphere for subsequent use in this study.
Reproducibility and Accuracy of In Situ Landmarks
Hat‐to‐head fitting was performed five times with a mean of 1,105 points digitized about the scalp region of the head phantom for each trial. The fit quality was good for each with a mean root‐mean‐square (RMS) distance between the head and hat of ∼0.4 mm. Time between fittings was varied and the digitizing pattern was similar to that in Figure 3. Following each hat‐to‐head registration, each landmark was digitized five times in succession, i.e., sphere 1–9, sphere 1–9, etc. Reproducibility of landmarks due to repeat measurement and repeat fitting was assessed. The nine‐parameter transform, determined from each of the five hat‐to‐head registrations, was used to transform mean locations of in situ landmarks to the MRI head coordinate system for comparison with MRI determined landmarks to evaluate accuracy.
Accuracy of Robotic Positioning
A robot arm capable of positioning and holding a high‐rate Cadwell figure eight TMS coil, including power and cooling‐water cables, was used in this study (NeuroMate, IMMI, France) (Fig. 4). The specified accuracy and precision for the NeuroMate arm position is 0.75 ± 0.15 mm and orientation 0.125 ± 0.02°. A recent report indicated that the application accuracy for frameless‐registration use of the NeuroMate robot arm was 1.95 ± 0.44 mm [Li et al., 2002]. Their reported application accuracy (0.86 ± 0.32 mm) approached manufacturer's specifications when framed registration was evaluated. Our TMS/robotic system also uses frameless registration, and we speculated that the application accuracy of the irTMS system would be similar to that of Li et al. [2002]. However, the modifications to our robot arm adding a TMS coil holder assembly including a 6th axis encoder (Fig. 4) might slightly degrade application accuracy.
The MRI‐derived TMS plan for each of the nine spheres was used to position the B‐shaped coil by the robot arm. The pose of the coil was measured using the manual digitizer and compared with the planned pose for each sphere. This was repeated with five different hat‐to‐head registrations to assess the effect of registration on pose. The in situ sphere landmarks were manually recorded following each registration to ensure that the in situ to MRI transform remained stable. The application accuracy was calculated at the phantom head surface and at targeted sites within the head phantom. Finally, the E‐field error at targeted sites was estimated from the 3‐D E‐field model.
Results and Analysis
Reproducibility and Accuracy of In Situ Landmarks
A two‐factor ANOVA (repeat measure and repeat fit) was used to evaluate reproducibility of in situ landmark measurements (N = 5 × 5 per landmark). An ANOVA was calculated for each of the manually measured x, y, and z coordinates of the sphere centers in each of the nine spheres. No significant differences in sphere centers were found for repeat manual digitization of any sphere (uncorrected P > 0.08), and standard deviations were all small compared with the Microscribe 3DLX digitizer accuracy (Table I). A small though statistically significant effect on sphere landmark measurements due to repeat hat‐to‐head fitting was seen for most of the spheres (uncorrected P < 0.05) (Table I). The standard deviations for repeat fitting were approximately three times those for repeat measurement. Standard deviations were generally less than 1 mm, with mean and median values for standard deviations due to repeat registration of 0.6 mm or less. For both repeat manual digitization and repeat fitting, the largest variance component was in the z‐direction, with SDz being approximately two times that for SDx or SDy.
Table I.
Standard deviations (mm) of x‐y‐z coordinates measured at the mechanical centers of spheres*
| Repeat measure | Repeat fitting | |||||
|---|---|---|---|---|---|---|
| SDx | SDy | SDz | SDx | SDy | SDz | |
| Mean | 0.071 | 0.066 | 0.122 | 0.215 | 0.394 | 0.606 |
| Median | 0.052 | 0.063 | 0.122 | 0.184 | 0.363 | 0.643 |
| Maximum | 0.140 | 0.133 | 0.223 | 0.400 | 0.629 | 1.098 |
| Minimum | 0.027 | 0.019 | 0.053 | 0.046 | 0.079 | 0.126 |
N = 25 measurements.
Landmark locations from the 25 measurements of each sphere (five repetitions following each of the five registrations) were averaged following transformation to the brain coordinate system. This set of nine mean landmark locations was compared with the corresponding landmarks determined from MRI. No significant differences were seen in the x, y, or z coordinates for the set of paired landmarks (paired t‐test; P < 0.001). Residual differences between transformed in situ landmarks and MRI determined landmarks were analyzed (Table II). This was done by fitting the set of nine in situ landmarks to the corresponding set from MRI using a nine‐parameter affine transform with an iterative least square error method for spatial registration markers [Velpaus et al., 1988] using Mathcad PLUS 6 for Macintosh (MathSoft, Cambridge, MA). The fitting was done in a serial fashion by translation, rotation, and scaling to estimate the effect of each. Residual differences in translation, rotation, and scale in the two sets of landmark points were small. The mean RMS distance between paired landmarks in the two sets of data dropped from 0.85 to 0.78 mm following translation, to 0.45 mm following translation plus rotation, and to 0.36 mm with the full transform. These measures indicate that the mean RMS distance between landmarks following the head‐surface‐based hat‐to‐head fitting was within ∼0.5 mm of that for landmark‐based fitting. Individual components of translation differences were <0.25 mm, rotation differences <0.52°, and scaling differences <0.5%. These results indicate unbiased fitting of the head phantom to its MR image using the surface‐based hat‐to‐head fitting technique.
Table II.
Residual differences between in situ and MRI measured landmarks
| Axis | Translation (mm) | Rotation (°) | Scale (%) |
|---|---|---|---|
| x | −0.08 | −0.52 | +0.4 |
| y | −0.22 | −0.17 | −0.5 |
| z | −0.20 | −0.23 | +0.1 |
Accuracy of Robotic Positioning
The position and orientation of the TMS coil were obtained for each planned site using the 3‐DLX digitizer and landmarks on the face of the coil body. The mean distance between the planned and measured position of the B‐shaped TMS coil was 1.99 ± 0.46 mm, our application accuracy at the head surface. This distance decomposes into a mean error of 1.14 ± 0.27 mm along the coil's treatment axis and a mean error of 1.32 ± 0.51 mm perpendicular to the treatment axis. The mean orientation error of the treatment axis was 1.22 ± 0.64°. The targeted treatment sites (sphere centers) were from 14–18 mm below the head surface. The mean distance error at these treatment sites was 2.01 ± 0.43 mm, 1.20 ± 0.24 mm along the treatment axis and 1.56 ± 0.45 mm perpendicular to the treatment axis. The error in orientation of the B‐shaped coil (and the E‐field) about the treatment axis was also very small (mean = 0.06°, standard deviation = 2.89°, max = 5.93°, min = −4.88°).
The maximum E‐field error resulting from the positioning errors was estimated from the 3‐D model of the field used in planning by the irTMS system (Fig. 2). On the treatment axis, the E‐field is directed parallel to the coil's y‐axis, and this direction was therefore used for assessing E‐field errors. Relative errors in the E‐field orientation were estimated using the cortical‐column aiming theory, i.e., using the cosine of the about‐the‐treatment‐axis angle error. The maximum orientation error leads to an estimated maximum E‐field error of only 0.53%. Estimated maximum errors in the E‐field due to position were calculated using positional errors of ±2 mm from the planned site in three directions, one along the treatment axis (z‐direction) and two across the treatment axis (x‐ and y‐directions). These errors were calculated at two distances bracketing common treatment depths (z = 20, 30 mm). The estimated maximum error in the E‐field due to position errors decreased with increasing distance from the coil body. Since the E‐field changes more rapidly along the treatment axis than across it (Fig. 2), position errors along this axis had the largest estimated maximum E‐field errors (3.0% at 20 mm, 2.7% at 30 mm). The smallest estimated maximum E‐field errors were for position errors in the y direction (0.024% at 20 mm, 0.022% at 30 mm). Slightly larger estimated maximum E‐field errors were found for position errors in the x‐direction (0.14% at 20 mm, 0.10% at 30 mm). A worst‐case combination of position and orientation errors leads to overall estimated maximum E‐field errors of 3–4% at 20 mm, dropping by ∼0.5% at 30 mm.
Discussion
Test results show that the irTMS system can accurately position and reposition a TMS coil at a planned location about the head surface. The impact of small positioning errors on the planned E‐field strength was also small. The largest factor in the maximum estimated E‐field error (∼3%) was due to depth (distance along the treatment axis) emphasizing the need to keep this component of the error small. The distance error along the treatment axis for the irTMS system was smaller, and had a smaller standard deviation, than the error across the treatment axis, so the maximum estimated E‐field error is somewhat conservative. While the maximum E‐field error range was 3–4%, the majority of individual measurements fell well within this range, with a mean value close to zero percent. The E‐field calculations assume no change in the E‐field due to head‐to‐air or tissue‐to‐bone conductivity changes [Davey et al., 1991; Roth et al., 1991; Tofts, 1990]. While such effects could be modeled into the calculated E‐field, preliminary data suggest that additional modeling near the treatment axis for figure‐eight coils may not be needed [Fox et al., 2003].
Preliminary testing using the irTMS system for planning and delivery of TMS to the M1 hand area led to successful activation in each of five volunteers, as verified by EMG. The target site for M1 hand were identified as those with the largest change in z‐score in the M1 hand area, using fMRI BOLD or O‐15 PET, for a finger‐to‐thumb tapping task compared to no hand movement. When converted to Talairach coordinates for comparison, the target M1 site locations varied significantly between individuals. This is partly due to the natural anatomical variability of the central sulcus [Kochunov et al., 2000; Steinmetz et al., 1989]. The distance between target sites in the five individuals and their mean Talairach coordinate ranged from 6.0 to 13.4 mm, with a mean and standard deviation of 9.5 ± 3.2 mm. The largest distance was associated with the single female in the group. In another study using the irTMS system (Dana Foundation), the primary functional site for an N‐back task was targeted using fMRI. The Talairach coordinates for these functional sites in seven subjects were also compared with their mean Talairach coordinate. Not surprisingly, these functional sites had a larger variability in distances from their mean location than for the hand area (max = 29.0 mm, min = 9.0 mm), with a mean and standard deviation of 17.6 ± 6.9 mm. The large distances between individual sites and their centroid location indicate that coordinate‐based aiming would not likely be appropriate in these studies. Unlike coordinate or anatomical image‐based aiming schemes, the functional‐anatomical aiming scheme of the irTMS system, which also accounts for local cortical orientation, provides a theoretically sound approach for planning and delivery of TMS in non‐motor areas, where physiological feedback is not available to verify positioning. The irTMS system is currently being used to target the supplementary motor area in a study of motor learning (NSF‐0225711). The target site for the TMS stimulation was determined from an O‐15 PET study contrasting complex finger‐to‐thumb movement compared with no hand movement. As was seen for stimulation of the M1 hand area, the TMS‐induced activated region in SMA is similarly located but smaller in extent than SMA activations due to finger tapping. An additional consideration for use of TMS for patients with pathology is that induced E‐fields might vary due to nearby changes in conductivity. If such effects can be formally modeled, they can be included in the treatment planning stage of the irTMS system.
The fitting method used to align the in situ head with the MR image of the head adapts to changes in spatial calibration of MR imaging systems. The fitting method should, therefore, work well with different manufacturers' MRI systems or if calibration should change over time. The scaling between the in situ head phantom and its MR image for our MRI system was studied by fitting the nine landmarks collected from each. A 9‐parameter affine transform with an iterative least square error fitting method (MathCad) was used to estimate the mean scaling factors to optimally fit in situ head landmarks to MRI head landmarks. The estimated scaling factors differed from unity in the x and y directions by less than 1%, while the mean z‐scale factor was significantly smaller than unity (0. 9662 ± 0. 0005). A similar result was seen when fitting the in situ head surface model to the MRI head surface model using the hat‐to‐head method, with x‐ and y‐scale factors within 1% of unity and a smaller z‐scale factor (0. 9719 ± 0. 0101). This difference was attributed to a z axis calibration difference in the MR image, since the digitizer had equivalent measurement accuracy in the x‐, y‐, and z‐directions. The positioning accuracy measured for the irTMS system indicates that the difference in z‐scaling factors was well accommodated with little or no impact on TMS coil positioning.
Repeat measurements of hat‐to‐head fitting showed a higher variability in the z‐scale factor than for the x‐ and y‐scale factors, with corresponding standard deviations of 1 vs. 0.2%. However, standard deviations measured from repeat fitting to digitized landmarks were similar for all scale factors, and all were less than 0.2%. Unlike digitized landmark fitting, the hat‐to‐head fitting combines the tasks of finding matching landmarks with that of determining a nine‐parameter affine transform to account for differences in position, orientation, and scaling. We believe that the larger variability in z‐scale factor for hat‐to‐head fitting was the result of less complete sampling of the head surface in the z‐direction. While the MRI head surface is well sampled, the sampling by manually digitizing the head surface is limited to the upper scalp (Fig. 3). The limited sampling in our study was designed to mimic in vivo head surface sampling that required that samples be above the custom‐fitted mask used to restrict head motion and to follow only the bony scalp. While the scalp scanning method provides good coverage of opposing sides of the head for the x and y directions, this is not true for the z direction where only the upper surface is well sampled. To test whether additional z‐extent of the head would improve the z‐variability, we added left and right cheekbones and an occipital pole area to the manual digitization pattern. This was done manually scanning the head phantom nine times and fitting each to the MRI model of the head phantom using the hat‐to‐head fitting software. The reproducibility of x‐ and y‐scale factors did not change, with standard deviations of ∼0.2%. However, the reproducibility of the z‐scale factor improved substantially to a standard deviation of 0.35%, approximately ⅓ of the value without the added z‐extent. Since both of the added areas are contained in the MRI head surface, including them during routine use is possible. The head holding and support system is being redesigned to provide access to these additional areas and the mastoid processes in human studies.
Test results derived from the head phantom represent intrinsic capabilities of the irTMS system, and indicate that the E‐field can be delivered with an overall range of accuracy of approximately ±3%. While this study did not attempt to deal with head movement, others have shown that movement can be tracked using a variety of devices [Zamorano et al., 1994]. Methods that track head movement set thresholds for movement and alert the operator when to reposition. This adjustment requires that TMS be stopped and the coil repositioned before TMS is resumed. The irTMS system has the capability to reposition dynamically using its robotic arm so that TMS can be continuously applied. Also, the threshold for movement detection should be different in different directions, and this could be assessed prior to beginning a study to better adapt dynamically to head movements. Work is underway to develop these features for the irTMS system.
Common practice in TMS studies is to set the stimulator output as a percent of its output at the hand motor threshold setting. While this scheme provides a means to adapt to differences in individual M1 thresholds and standardizes reporting, it has several theoretical problems. First, the hand‐threshold approach implicitly assumes that TMS thresholds do not vary regionally, and this has not been verified. Second, the relationship between the M1 hand threshold and thresholds in other brain areas may not be consistent. Third, the threshold varies with different pulse waveforms, current directions, and stimulator types [Kammer et al., 2001]. Fourth, since many TMS aiming schemes do not use imaging for planning, few attempt to correct TMS output for differences in depth between the M1 site and the intended site, and depth correction was shown to be very important in this study. Finally, it is clear that orientation of the E‐field is important [Amassian et al., 1990, 1992, 1994; Fox et al., 2004], and that without accounting for this effect, the planned strength of the delivered E‐field cannot be accurately controlled. The irTMS planning system provides methods to control for depth and orientation effects. With these factors controlled, research into other parameters that affect TMS delivery can be done more effectively.
Conclusions
The positioning accuracy of the irTMS system, using a modified NeuroMate robot arm, was similar to that reported for the NeuroMate neurosurgical robot arm, 1.99 ± 0.46 mm. The estimated maximum variation in planned delivery of E‐field strength fell within the range of ±3–4%, demonstrating the high level of accuracy and precision of planned transcranial magnetic stimulation achievable by the irTMS system.
REFERENCES
- Amassian VE, Quirk GJ, Stewart M (1990): A comparison of cortical spinal activations by magnetic coil and electrical stimulation of monkey motor cortex. Electroencephalogr Clin Neurophysiol 77: 390–401. [DOI] [PubMed] [Google Scholar]
- Amassian VE, Eberle L, Maccabee PJ, Cracco RQ (1992): Modeling magnetic coil excitation of human cerebral cortex with a peripheral nerve immersed in a brain‐shaped volume conductor; the significance of fiber bending in excitation. Electroencephalogr Clin Neurophysiol 85: 291–301. [DOI] [PubMed] [Google Scholar]
- Amassian VE, Maccabee PJ, Cracco RQ, Cracco JB, Somasundaram M, Rothwell JC, Eberle L, Henry K, Rudell AP (1994): The polarity of the induced electric field influences magnetic coil inhibition of human visual cortex: implications for the site of excitation. Electroencephalogr Clin Neurophysiol 93: 21–26. [DOI] [PubMed] [Google Scholar]
- Brasil‐Neto JP, McShane LM, Fuhr P, Hallett M, Cohen LG (1992): Topographic mapping of the human motor cortex with magnetic stimulation: factors affecting accuracy and reproducibility. Electroencephalogr Clin Neurophysiol 85: 9–16. [DOI] [PubMed] [Google Scholar]
- Chang SD, Main W, Martin DP, Gibbs IC, Heilbrun MP (2003): An analysis of the accuracy of the CyberKnife: A robotic frameless stereotactic radiosurgical system. Neurosurgery 52(1): 140–147. [DOI] [PubMed] [Google Scholar]
- Cohen LG, Hallett M. Noninvasive mapping of human motor cortex (1988): Neurology 38: 904–909. [DOI] [PubMed] [Google Scholar]
- Davey KR, Cheng CH, Epstein CM (1991): Prediction of magnetically induced electric fields in biological tissues. IEEE Trans Biomed Engr 38: 418–422. [DOI] [PubMed] [Google Scholar]
- Day BL, Dressler D, Maertens de Noordhout A, Marsden CD, Nakashima K, Rothwell JC, Thompson PD (1989): Electric and magnetic stimulation of human motor cortex: surface EMG and single motor unit responses. J Physiol 412: 449–473. [DOI] [PMC free article] [PubMed] [Google Scholar]
- Epstein CM, Schwartzberg DG, Davey KR, Sudderth DB (1990): Localizing the site of magnetic brain stimulation in humans. Neurology 40: 666–670. [DOI] [PubMed] [Google Scholar]
- Fox PT, Ingham RJ, Mayberg H, George M, Martin C, Ingham J, Roby J, Jerabek P (1997): Imaging human cerebral connectivity by PET during TMS. NeuroReport 8: 2787–2791. [DOI] [PubMed] [Google Scholar]
- Fox PT, Narayana S, Tandon N, Sandoval H, Fox S, Kochunov PV, Lancaster JL (2004): A column‐based model of electric field excitation of cerebral cortex. Hum Brain Mapp 22: 1–14. [DOI] [PMC free article] [PubMed] [Google Scholar]
- George MS, Wassermann EM, Williams WA, Steppel J, Pascual‐Leone A, Basser P, Hallett M, Post RM (1996): Changes in mood and hormone levels after rapid‐rate trans cranial stimulation (rTMS) of the prefrontal cortex. J Neuropsychiat Clin Neurosci 8: 172–180. [DOI] [PubMed] [Google Scholar]
- Gildenberg PL (2003): Hair transplantation method and apparatus. United States Patent No. 6,585,746.
- Herwig U, Schõnfeldt‐Lecuona C, Wunderlich AP, von Tiesenhausen C, Thielscher A, Walter H, Spitzer M (2001): The navigation of transcranial magnetic stimulation. Psychiat Res Neuroimaging 108: 123–131. [DOI] [PubMed] [Google Scholar]
- Kammer T, Beck A, Thielscher A, Laubis‐Herrmann U, Topka H (2001): Motor thresholds in humans: a transcranial magnetic stimulation study comparing different pulse waveforms, current directions and stimulator types. Clin Neurophysiol 112: 250–258. [DOI] [PubMed] [Google Scholar]
- Kochunov P, Lancaster J, Thompson P, Boyer A, Haedies J, Fox P (2000): Evaluation of octree spatial normalization method for regional anatomical matching. Hum Brain Mapp 11: 193–206. [DOI] [PMC free article] [PubMed] [Google Scholar]
- Krings T, Buchbinder BR, Butler WE, Chiappa KH, Jiang HJ, Rosen BR, Cosgrove GR (1997): Stereotactic transcranial magnetic stimulation: correlation with direct electrical stimulation. Neurosurgery 41: 1319–1325. [DOI] [PubMed] [Google Scholar]
- Krings T, Chiappa KH, Foltys H, Reinges MH, Cosgrove GR, Thron A (2001): Introducing navigated transcranial magnetic stimulation as a refined brain mapping methodology. Neurosurg Rev 24: 171–179. [DOI] [PubMed] [Google Scholar]
- Lancaster JL, Fox PT, Downs H, Nickerson DS, Hander TA, Mohammed EM, Kochunov PV, Zamarrips F (1999): Global spatial normalization of human brain using convex hulls. J Nucleic Med 40: 942–955. [PubMed] [Google Scholar]
- Li QH, Zamorano L, Pandya A, Ramiro P, Gong J, Diaz F (2002): The application accuracy of the NeuroMate robot: a quantitative comparison with frameless and frame‐based surgical localization systems. Comput Aided Surg 7: 90–98. [DOI] [PubMed] [Google Scholar]
- Mills KR, Boniface SJ, Schubert M (1992): Magnetic brain stimulation with a double coil: the importance of coil orientation. Electroencephalogr Clin Neurophysiol 85: 17–21. [DOI] [PubMed] [Google Scholar]
- Pascual‐Leone A. Catala MD, Pascual‐Leone Paccual A (1996): Lateralized effect of rapid‐rate transcranial magnetic stimulation of the prefrontal cortex on mood. Neurology 46: 499–502. [DOI] [PubMed] [Google Scholar]
- Paus T (1996): Location and function of the human frontal eye‐field: a selective review. Neuropsychologia 34: 475–483. [DOI] [PubMed] [Google Scholar]
- Paus T (1999): Imaging the brain before, during, and after transcranial magnetic stimulation. Neuropsychologia 37: 219–234. [DOI] [PubMed] [Google Scholar]
- Paus T, Jech R, Thompson CJ, Comeau R, Peters T, Evans AC (1997): Transcranial magnetic stimulation during positron emission tomography: a new method for studying connectivity of the human cerebral cortex. J Neurosci 17: 3178–3184. [DOI] [PMC free article] [PubMed] [Google Scholar]
- Paus T, Wolforth M (1998): Transcranial magnetic stimulation during PET: reaching and verifying the target site. Hum Brain Mapp 6: 399–402. [DOI] [PMC free article] [PubMed] [Google Scholar]
- Pelizzari CA, Chen GTY, Spelbring DR, Weichselbaum RR, Chen CT (1989): Accurate three‐dimensional registration of CT, PET, and/or MRI images of the brain. J Comput Asst Tomogr 13: 20–26,. [DOI] [PubMed] [Google Scholar]
- Roth BJ, Saypol JM, Hallett M, Cohen LG (1991): A theoretical calculation of the electric field induced in the cortex during magnetic stimulation. Electroencephalogr Clin Neurophysiol 81: 47–56. [DOI] [PubMed] [Google Scholar]
- Ruohonen J (1998): Transcranial magnetic stimulation modeling and new techniques. Ph.D. dissertation, (available online at http://www.biomag.hus.fi/tms/Thesis/Thesis.html), Helsinki University of Technology, Espoo, Finland.
- Steinmetz H, Fürst G, Meyer BU (1989): Craniocerebral topography within the international 10‐20 system. Electroenceph Clin Neurophysiol 72: 499–506. [DOI] [PubMed] [Google Scholar]
- Tofts PS (1990): The distribution of induced currents in magnetic stimulation of the nervous system. Phys Med Biol 35: 1119–1128. [DOI] [PubMed] [Google Scholar]
- Velpaus FE, Woltring HJ, Dortmans LJ (1988): A least‐squares algorithm for the equiform transformation from spatial marker co‐ordinates. J Biomech 21: 45–54. [DOI] [PubMed] [Google Scholar]
- Wang B, Toro C, Zeffiro TA, Hallett M (1994): Head surface digitization and registration: A method for mapping positions on the head onto magnetic resonance images. Brain Topogr 6: 185–192. [DOI] [PubMed] [Google Scholar]
- Wassermann EM, Wang B, Zeffiro TA, Sadato N, Pascual‐Leone A, Toro C, Hallett M (1996): Locating the motor cortex on the MRI with transcranial magnetic stimulation and PET. Neuroimage 59: 14–22. [DOI] [PubMed] [Google Scholar]
- Zamorano LJ, Nolte L, Kadi AM, Jiang Z (1994): Interactive intraoperative localization using an infrared‐based system. Stereotact Funct Neurosurg 63: 84–88. [DOI] [PubMed] [Google Scholar]