

Abstract
GABAergic and glutamatergic neuronal systems in adult normal human brains were shown quantitatively and in detail through the distributions of glutamate decarboxylase (GAD) and glutamate dehydrogenase (GDH), respectively. Consecutive coronal sections containing part of the striatum and the substantia nigra were obtained from the right hemisphere of three deceased persons with no history of neurological or psychiatric diseases and were stained immunohistochemically for GAD and GDH. Each stained section was divided into approximately 3 million microareas and the immunohistochemical fluorescence intensity in each area was measured by a human brain mapping analyzer, which is a microphotometry system for analysis of the distribution of neurochemicals in a large tissue slice. In the analyzed brain regions, conspicuously intense GAD‐like immunoreactivity was observed in the substantia nigra, globus pallidus, and hypothalamus. GDH was widely and rather evenly distributed in the gray matter compared to GAD, although intense GDH‐like immunoreactivity was observed in the lateral geniculate nucleus and substantia nigra. Within the substantia nigra, the globus pallidus, and other regions, characteristic distributions of GAD‐ and GDH‐like immunoreactivity were found. We believe that the analysis of the human brain by this novel technique can help to understand the functional distribution of neuronal systems in the normal human brain and may be able to identify abnormal changes in the diseased human brain. It can also provide basic data to help in the interpretation of functional magnetic resonance imaging or positron emission tomography. Hum. Brain Mapping 11:93–103, 2000. © 2000 Wiley‐Liss, Inc.
Keywords: fluorescence microphotometry, glutamate decarboxylase, glutamate dehydrogenase, human brain mapping analyzer, quantitative immunohistochemistry
INTRODUCTION
γ‐Aminobutyric acid (GABA) is the major inhibitory neurotransmitter [Krnjevíc, 1974; Roberts et al., 1976] and GABAergic neurons are widely distributed in the central nervous system (CNS). Glutamate decarboxylase (GAD) catalyzes the synthesis of GABA from glutamate and is a well‐recognized marker for GABAergic neurons both neurochemically and immunohistochemically [Roberts et al., 1976; Mugnaini and Oertel, 1985]. Glutamate dehydrogenase (GDH), on the other hand, catalyzes the interconversion of glutamate and α‐ketoglutarate, and the reaction equilibrium of GDH favors the formation of glutamate [Fisher, 1985]. Glutamate is established as one of the major excitatory neurotransmitters in the CNS [Fonnum, 1984]. GABA and glutamate may be associated with some CNS diseases such as epilepsy and Huntington's chorea, and abnormal changes in activities of GAD and GDH have been reported in diseased human brains [Bird et al., 1977; Sherwin, 1999]. The immunohistochemical distributions of GAD and GDH in the brain were previously observed by several workers [Aoki et al., 1987; Babb et al., 1989; Ohm et al., 1990; Rothe et al., 1990; Zinner‐Feyerabend and Braak, 1991]. The distributions of the activities of these enzymes have also been analyzed [McGeer and McGeer, 1976; Bird et al., 1977; Spokes, 1979; Gaspar et al., 1980; Javoy‐Agid et al., 1981; Maker et al., 1981; Filla et al., 1986]. However, the immunohistochemical approach cannot provide quantitative information, and the latter approaches cannot provide detailed information about the distributions of these enzymes in neurons or small brain regions.
We developed a fluorescence microphotometry system for the quantitative analysis of the immunohistochemical distribution of specific molecules, such as a neurotransmitter or neuromodulator, in brain slices [Sutoo et al., 1988], and analyzed the distribution of various neurochemicals in the CNS of animals and humans [Sutoo et al., 1989, 1991a, 1991b, 1991c, 1994]. We also recently developed a human brain mapping analyzer based on this system [Sutoo et al., 1998]. The quantitative linearity, sensitivity, and resolution of this analyzer surpass those of image analyzers used with TV cameras, and the sensitivity, reproducibility, and facility of this method are greater than those of the HPLC method. Also, the measuring area of this analyzer is far larger than that of laser confocal microscopes. With this analyzer, we quantitatively analyzed the distributions of choline acetyltransferase [Sutoo et al., 1998] and substance P [Sutoo et al., 1999] in human brains.
In the present study, the distributions of GABAergic and glutamatergic neurons in adult human brains were revealed by this analyzer through fluorescent immunohistochemical stains for GAD and GDH. Consecutive coronal slices of the right hemisphere were divided into approximately 3 million microareas per one slice (each area was 50 μm in diameter), and the immunohistochemical fluorescence intensities emitted from each microarea were measured. Some brain regions on the slice were also divided into microareas of 20 μm in diameter, and detailed distributions of GAD and GDH were analyzed.
MATERIALS AND METHODS
Human materials
All experimental procedures were performed in accordance with the methods and conditions described in our previous reports [Sutoo et al., 1994, 1998, 1999], and are stated here only in brief. The brains of three deceased adult males with no history of neurological or psychiatric diseases were used: Case 1, age 50, froze to death in a park; case 2, age 60, died of hepatoma; and case 3, age 70, died of lung carcinoma. The bodies of these individuals were collected by our laboratory for routine medical education and examination. Informed consent was obtained from each person before death or from his family. Each brain was perfused through both internal carotid arteries and the basilar artery within 8 h of death with 2 liters of ice‐cold phosphate‐buffered saline (PBS, pH 7.4), followed immediately by an ice‐cold fixative containing 4% paraformaldehyde and 0.2% glutaraldehyde in PBS (6 liters) for 90 min. After perfusion, each brain was halved sagittally and sliced into approximately 10‐mm‐thick coronal blocks. The tissue blocks were postfixed with 4% paraformaldehyde in PBS at 4°C for 2 days, and then rinsed with six changes of PBS at 4°C over a period of 3 days, followed thereafter by rinsing with three changes of 5% buffered sucrose at 4°C over a period of 4 days. Under these conditions, no significant differences in fluorescence intensity elicited by fixation were found between the brains. Each tissue block was frozen on dry ice and stored hermetically in triple plastic cases at −80°C until use. The frozen brains were sectioned consecutively at a thickness of 20 μm using a large freezing microtome (Cryo‐Microtom, PMV, Sweden). The sections were mounted on chrome‐alum‐gelatin‐coated slides (75 × 152 mm) and immunohistochemically stained for GAD or GDH. In this study, coronal blocks of the right hemisphere containing part of the striatum and substantia nigra were analyzed.
Immunohistochemistry
A polyclonal antibody to GAD was purchased from Chemicon International, Inc., Temecula, CA (catalog no. AB‐108). The antigen was derived from a cloned DNA (feline) and expressed in E. coli. An antibody to the enzyme was produced at high titers in a rabbit. The antibody cross‐reacted immunohistochemically with GAD from the brains of mice, rats, and humans. The polyclonal antibody to GDH was purchased from Advance Co., Ltd., Tokyo, Japan (catalog no. AB‐3030). GDH was purified from bovine liver and used as an antigen, and an antibody to the enzyme was produced at high titers in a rabbit. The antibody cross‐reacted immunohistochemically with GDH from the brains of mice, rats and humans. Sera were diluted with PBS. Immunohistochemical staining was carried out as follows: Slices were (1) rinsed with PBS for 2 h, (2) pretreated with normal goat serum diluted 1:100 at 4°C for 2 h, (3) rinsed with PBS for 1 h, (4) treated with anti‐GAD antibody (diluted 1:500) or anti‐GDH antibody (diluted 1:500), and reacted at 4°C for 12 h, (5) rinsed three times with PBS for a total of 1.5 h, (6) treated with anti‐rabbit IgG goat serum labeled with fluorescein isothiocyanate (FITC) (catalog no. 65‐6111, Zymed Lab., Inc., South San Francisco, CA) diluted 1:100, and incubated at room temperature for 3 h in a dark room, (7) rinsed six times with PBS for a total of 18 h at 4°C in a dark room, and (8) embedded in 10% glycerin PBS, and kept moist at 4°C in a dark room. The stained slices were analyzed immediately.
Distribution analysis
An image of the quantitative distribution of GAD‐ and GDH‐like immunoreactivity in each brain region can be obtained as follows: (1) the GAD or GDH labeled by immunofluorescent stain in a microarea of a brain slice is illuminated by a fine excitation; (2) the fluorescence in this area passes through a photometry diaphragm (pinhole) and the objective lens to the photometer, and its intensity is measured; (3) the brain slice is moved by a two‐dimensional scanning stage, and the fluorescence intensity in the next microarea is measured; (4) the measured fluorescence intensities in each microarea are transmitted to a host computer, where they are analyzed for reconstruction of an image of the entire scanned area; and (5) the image can be viewed in close‐up, in full, or at an angle, and displayed quantitatively. The actual intensity in a specific brain region is displayed when that region is selected by a cursor on the image on a TV monitor. The scanning speed is approximately 100 microareas/sec, the maximum stage movement is 140 × 140 mm with a minimum stepping movement of 0.25 μm, and an unlimited amount of data can be gathered continuously by transfer to external memory devices. Because the measuring point is irradiated for only 10 msec by the excitation beam, fading of the fluorescence is negligible during the measuring period and the same data can be obtained from the same point even after 50 measurements.
The operating conditions were as follows: excitation range, 420–490 nm; band‐pass interference filter, 530 nm; photomultiplier voltage, 850 V; and objective, 20×/0.5 (magnification/ numerical aperture). The entire area of each slice was measured through a measuring spot 40 μm in diameter at 50 μm intervals, and the data at approximately 3 million points were obtained from each slice. Also, several important areas were measured again in detail through a measuring spot 20 μm in diameter at 20 μm intervals. After measurement of the GAD and GDH distributions, the slices were stained for histological analysis with cresyl violet, and the distributions of neuronal cells in the slices were analyzed through measurements of the transmission densities of Nissl staining. The locations of brain regions were identified using human brain atlases [Riley, 1960; Roberts and Hanaway, 1970; Binder et al., 1979; Mai et al., 1997] (Fig. 1).
Figure 1.

Examples of coronal sections of the human brain analyzed for the distribution of GAD and GDH. In the insets, the vertical dotted lines indicate the level and axis of the analyzed coronal area, and the solid line indicates the plane of this section. The data of Figures 3 and 4 were obtained from the section levels A and B, respectively. After measurement of the distribution of GAD or GDH, the slices were stained with cresyl violet, and the precise brain regions were identified using human brain atlases [Riley, 1960; Roberts and Hanaway, 1970; Binder et al., 1979; Mai et al., 1997]. Abbreviations: Am, amygdala; CC, corpus callosum; Cd, caudate nucleus; Cl, claustrum; CR, corona radiata; DG, dentate gyrus; FGi, inferior frontal gyrus; FGm, middle frontal gyrus; FGs, superior frontal gyrus; GPe, external segment of globus pallidus; GPi, internal segment of globus pallidus; Hp, hippocampus; Hy, hypothalamus; IC, internal capsule; LG, lateral geniculate nucleus; Pt, putamen; RN, red nucleus; SNc, substantia nigra pars compacta; SNr, substantia nigra pars reticulata; TGi, inferior temporal gyrus; TGm, middle temporal gyrus; TGs, superior temporal gyrus; THd, lateral dorsal nucleus of thalamus; THl, ventral lateral nucleus of thalamus; THm, medial nucleus of thalamus.
Strong nonspecific autofluorescence was distributed throughout the entire human brain, especially in the myelinated nerve fibers of white matter. This autofluorescence may exist normally in aged human brains and may originate from lipofuscin [Mesulam and Geula, 1988; Guntern et al., 1989; Perides et al., 1989]. Therefore, quantitative immunohistochemical distributions of neurochemicals cannot be directly determined. The photometric technique is the most accurate to eliminate autofluorescence and has the highest reproducibility. That is, pure immunohistochemical fluorescence intensities were obtained from the balance of intensity values before and after immunohistochemical staining at each measuring point [Sutoo et al., 1994, 1998]. The prestained brain slice was rinsed with PBS for 2 h, during which water‐soluble fluorescence was removed completely. This slice was then embedded in 10% glycerine PBS and the autofluorescence intensity in each measuring point was measured. The fluorescence intensity data were stored in the memory of the analyzer (Fig. 2A). Then, the brain slice was stained immunohistochemically, as described previously. The stained brain slice was set at exactly the same position on the stage and measured again under the same conditions. The fluorescence intensity data were transmitted to the analyzer (Fig. 2B), where the first value was subtracted from the second value for each measuring point. Thus, pure immunohistochemical fluorescence intensity values were obtained (Fig. 2C). Variations in immunohistochemical fluorescence intensities due to staining of different sections at different times were corrected using stored control slices of rat spinal cord that were stained and analyzed simultaneously with the experimental human brain slices.
Figure 2.

Elimination of nonspecific autofluorescence in the brain slice. The distributions of fluorescence intensity were scanned from a to b in the quite same slice before and after immunohistochemical staining. The distribution in A indicates nonspecific autofluorescence, and that in B indicates immunohistochemical fluorescence superimposed on nonspecific autofluorescence. The difference between A and B, namely, the distribution of immunohistochemical fluorescence intensity is shown in C.
Standards
The immunohistochemical fluorescence intensities obtained in the slices are expressed relative to those of provisional standards. In the excitation range of 385–425 nm, the fluorescence intensity emitted from 1 mM quinine sulfate in 0.1 N sulfuric acid (100 μm in depth) is defined as 100 for our study. Because quinine sulfate is not excited in the wavelength range of 420–490 nm, uranium glass was substituted as the standard for this range. When the excitation range is 420–490 nm, the fluorescence intensity of uranium glass (100 μm in diameter, Nikon, Japan) is 64. Before analysis of the slice, the standard value of the photometer is calibrated using uranium glass through selected diaphragms, and the brain slice is analyzed using the same diaphragms. Therefore, the data are expressed as the fluorescence intensity per this size of measurement area relative to the intensity of uranium glass.
RESULTS
The immunohistochemical distributions of GAD and GDH in the right hemispheric coronal slices of the three adult normal human brains were essentially the same. Representative distributions (those in the brain of case 1, age 50) are indicated in Figures 3 and 4. The data for GAD for the entire slice are presented in Figures 3A and 4A, and those for GDH are presented in Figures 3C and 4C. In the analyzed brain regions, high GAD‐ and GDH‐like immunoreactivities were localized in the substantia nigra, globus pallidus and neostriatum regions. The detailed distributions of GAD in these regions are shown in Figures 3B and 4B, and those of GDH are shown in Figures 3D and 4D. The averaged fluorescence intensities of GAD and GDH in the major brain regions are indicated in Figure 5.
Figure 3.

A and C: Quantitative immunohistochemical distributions of GAD (A) and GDH (C) in a right hemispheric brain slice in an adult normal human (male, age 50). This area is the same as that shown in Figure 1A. Data was obtained from approximately 3 million regions in the brain at 50‐μm intervals. The immunohistochemical fluorescence intensities of GAD or GDH are shown as relative values compared with the standard intensity of uranium glass. B and D: The distributions of GAD (B) and GDH (D) in the globus pallidus, putamen and caudate nucleus areas are in the same slice as that shown in A and C, respectively. Data were obtained at 20‐μm intervals. Immunohistochemical fluorescence intensities were classified into eight ranks and are indicated by color coding as follows: In A, 0.00–0.09 (black), 0.10–0.20 (deep blue), 0.21–0.31 (light blue), 0.32–0.42 (green), 0.43–0.53 (yellow), 0.54–0.64 (red), 0.65–0.75 (pink), and 0.76 or more (white); In B, 0.21–0.92 (deep blue to pink); in C, 0.46–1.11 (deep blue to pink); and in D, 0.43–1.32 (deep blue to pink).
Figure 4.

A and C: Quantitative immunohistochemical distributions of GAD (A) and GDH (C) in a right hemispheric brain slice in an adult normal human. This area is the same as that shown in Figure 1B. Data were obtained from approximately 3 million regions in the brain at 50‐μm intervals. The immunohistochemical fluorescence intensities of GAD or GDH are expressed relative to the standard intensity of uranium glass. B and D: The distribution of GAD (B) and GDH (D) in the substantia nigra are in the same level as that shown in A and C. Data were obtained at 20‐μm intervals. Immunohistochemical fluorescence intensities were classified into eight ranks and are indicated by color coding as described in Figure 3.
Figure 5.
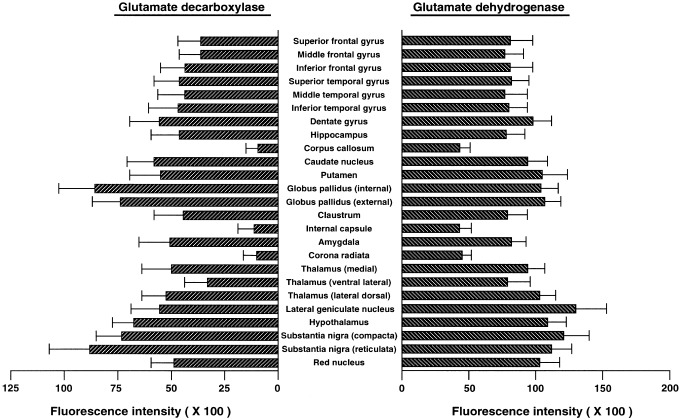
Immunohistochemical fluorescence intensities of GAD and GDH in various brain regions of the normal human brain. Each value represents the mean ± SEM of 60 data points (obtained at random from 12 slices, 4 slices in each of three brains) per 40‐μm diameter area relative to the intensity of uranium glass. The background fluorescence intensity was subtracted from the total fluorescence intensity at each measuring point and the values were averaged.
Distributions of GAD
In the analyzed brain regions, the highest level of GAD was observed in the substantia nigra, globus pallidus, and hypothalamus (Figs. 3A and 4A). Within the substantia nigra, the average immunohistochemical fluorescence intensity of GAD in the three brains was 20% higher in the pars reticulata (fluorescence intensity, 0.88 ± 0.18 (mean ± SEM)) than in the pars compacta (intensity, 0.73 ± 0.12) (Fig. 4B). The fluorescence intensity of GAD in the internal segment of the globus pallidus (0.85 ± 0.17) was approximately 15% higher than that in the external segment of globus pallidus (0.74 ± 0.13). In the internal segment of the globus pallidus, especially high levels of GAD were localized in the dorsomedial part (intensity, 1.07 ± 0.15) and ventral part (intensity, 1.04 ± 0.13) (Fig. 3B).
Relatively high levels of GAD were localized in the caudate nucleus, putamen, dentate gyrus and lateral geniculate nucleus (Figs. 3A and 4A). The GAD level in the ventral area of the putamen (intensity, 0.68 ± 0.14) was higher than that in the dorsal area (intensity, 0.50 ± 0.10), and the GAD level in the dorsal area of the caudate nucleus (intensity, 0.74 ± 0.09) along with the lateral ventricle was higher than that in the ventral area (intensity, 0.55 ± 0.09). In the lateral geniculate nucleus, the fluorescence intensity of GAD in the ventral magnocellular layers (0.67 ± 0.10) was higher than that in the dorsal parvocellular layers (0.46 ± 0.09).
Distributions of GDH
GDH is widely and rather evenly distributed in the gray matter, and so the regional variation of GDH was small compared with that of GAD. In the GDH distribution, however, the highest level of GDH was localized in the lateral geniculate nucleus and substantia nigra (Fig. 4C). In the lateral geniculate nucleus, GDH levels did not differ between the ventral magnocellular layers (intensity, 1.32 ± 0.19) and the dorsal parvocellular layers (intensity, 1.29 ± 0.20). In the substantia nigra, the GDH level in the pars compacta (intensity, 1.21 ± 0.19) was approximately 10% higher than that in the pars reticulata (intensity, 1.11 ± 0.15) (Fig. 4D).
Relatively intense GDH‐like immunoreactivity was observed in the caudate nucleus, putamen, globus pallidus, dentate gyrus, hypothalamus, red nucleus, lateral dorsal nucleus of thalamus and medial nucleus of thalamus (Figs. 3C and 4C). The GDH level did not differ among the internal and external segments of the globus pallidus and putamen. In these regions, masses of intense GDH‐like immunoreactive structures were scattered in the dorsal edge and surrounding regions of blood vessels (fluorescence intensity, 1.20–1.28). In the caudate nucleus, intense GDH‐like immunoreactive intensities were also observed in the medial intermediate area and the dorsolateral edge (fluorescence intensity, 1.22 ± 0.17) (Fig. 3D). GDH‐like immunoreactivity was distributed in both striosome and matrix compartments in the caudate nucleus and putamen.
DISCUSSION
There has been growing interest in the distributions of neurochemicals such as neurotransmitters and neuromodulators in the human brain. Abnormal changes in these levels in specific brain regions have been correlated with the occurrence of various psychoneuroses or abnormal behaviors. However, analysis of their distribution in the brain is not simple because these molecules are present in extremely small quantities, are unstable, and are not uniformly distributed in each brain region.
Immunohistochemistry is one of the most powerful techniques available for identifying and mapping the distribution of specific molecules in the brain. By this method, region‐dependent technical errors in data are very small because all brain regions in the slice can be stained at once under the same conditions, and it is not necessary to carry out tissue sampling. Also, even slight variations in the concentrations of neurochemicals in neurons or small regions in the brain slice can be observed. Our first effort in this field was the development of a fluorescence microphotometry system for quantitative analysis of the immunohistochemical distribution of neurochemicals [Sutoo et al., 1988]. This system was recently extensively redesigned as a human brain mapping analyzer [Sutoo et al., 1998].
In the present study, the distributions of GABAergic and glutamatergic systems in the adult normal human brain were measured by this analyzer through immunohistochemical staining of GAD and GDH. The GAD distributions found in this study are consistent with those of previous reports concerning enzyme activity [McGeer and McGeer, 1976; Spokes, 1979; Gaspar et al., 1980; Javoy‐Agid et al., 1981; Maker et al., 1981] and qualitative immunohistochemical observation [Zinner‐Feyerabend and Braak, 1991] in the human brain. Our finding of a decrease in the GAD level from the medial globus pallidus to the lateral putamen is reasonable because the globus pallidus receives prominent GABAergic inputs from the neostriatum [Fonnum et al., 1974; Hauber, 1998], and the neurons in the two segments of the globus pallidus are interconnected by a massive GABAergic projection from the external segment to the internal segment [Hazrati et al., 1990; Kincaid et al., 1991]. Also, the brain regions that had high levels of GAD in the present study have been investigated by many laboratories. These studies have shown that the neostriatum and the globus pallidus provide GABAergic inputs to the substantia nigra [Hattori et al., 1973; Brownstein et al., 1977; Jessell et al., 1978]. The lateral geniculate nucleus is the main thalamic station of the visual pathway, and the interneurons in the lateral geniculate nucleus are inhibitory, using GABA as their transmitter [Montero and Zempel, 1985]. GABA is well established by a large number of animal experiments to be the major inhibitory neurotransmitter in the hippocampal formation [Curtis et al., 1971; Storm‐Mathisen and Ottersen, 1984]. Histochemical data on the rat showed a dense network of GAD‐positive fibers in almost all hypothalamic nuclei [Hökfelt et al., 1978].
On the other hand, GDH was widely and rather evenly distributed in the gray matter of the brain. However, high levels of GDH were localized in the lateral geniculate nucleus and substantia nigra, and relatively high levels of GDH were observed in the caudate nucleus, putamen, globus pallidus, dentate gyrus, hypothalamus, red nucleus, lateral dorsal nucleus of thalamus, and medial nucleus of the thalamus. This result is in agreement with the distribution of enzyme activity of GDH in the human brains [Bird et al., 1977; Filla et al., 1986] and immunohistochemical observations in rat brains [Aoki et al., 1987]. These brain regions have been investigated with respect to their glutamatergic functions. Glutamate has been proposed as a retinotectal neurotransmitter [Yates and Roberts, 1974; Bondy and Purdy, 1977], and most optic projection areas such as the lateral geniculate nucleus stand out by their high GDH content [Marani and Ruigrok, 1981]. The striatum and the substantia nigra receive glutamatergic fibers from the frontal cortex [Fonnum, 1984; Hauber, 1998]. In addition to cortical afferents, other important, presumably glutamatergic, inputs to the striatum arise from the thalamus [Hauber, 1998]. The globus pallidus and substantia nigra receive glutamatergic projections from the subthalamic nucleus [Robledo and Féger, 1990]. In the substantia nigra, the density of N‐methyl‐D‐aspartate (NMDA) receptors (one of the glutamate receptors) appeared greater compared to other areas of the human midbrain [Difazio et al., 1992; Shaw et al., 1992].
It is well established that GABA is a major inhibitory neurotransmitter, and that glutamate is an excitatory neurotransmitter. In the substantia nigra, globus pallidus, putamen, and caudate nucleus, in which high levels of GAD and/or GDH were detected in this study, GABA or glutamate have been proposed as neurotransmitters. The striatum regulates the activity of the GABAergic projection neurons of the substantia nigra pars reticulata via two main functional opposing pathways, the direct and indirect pathways. The former is represented by the striatonigral GABAergic projection and monosynaptically inhibits the nigrothalamic GABA pathway, leading to a thalamic disinhibition of the glutamatergic drive to the cortex, and therefore leading to movement initiation. On the other hand, the latter encompasses a trisynaptic link, including (1) a GABAergic projection from the striatum to the globus pallidus, (2) a GABAergic projection from the globus pallidus to the subthalamic nucleus, and (3) a glutamatergic projection from the subthalamic nucleus to the substantia nigra pars reticulata, which also innervates the globus pallidus. Activation of the striopallidal “link” in the indirect pathway is associated with an increase in subthalamic nucleus glutamatergic input to the substantia nigra pars reticulata and globus pallidus, and this results in changes in both thalamic activity and locomotor behavior opposite to those elicited by activation of the direct pathway [Albin et al., 1989; Alexander and Crutcher, 1990].
We believe that such analysis by a human brain mapping analyzer can help to understand the functional distribution of neuronal systems in the normal human brain and may be able to detect abnormal distributions of various neurochemicals in the diseased human brain. Furthermore, this basic information should help in the analysis of data obtained with functional magnetic resonance imaging and positron emission tomography.
REFERENCES
- Albin RL, Young AB, Penney JB (1989): The functional anatomy of basal ganglia disorders. Trends Neurosci 12: 366–375. [DOI] [PubMed] [Google Scholar]
- Alexander GE, Crutcher M (1990): Functional architecture of basal ganglia circuits: neuronal substrates of parallel processing. Trends Neurosci 13: 266–271. [DOI] [PubMed] [Google Scholar]
- Aoki C, Milner TA, Sheu KFR, Blass JP, Pickel VM (1987): Regional distribution of astrocytes with intense immunoreactivity for glutamate dehydrogenase in rat brain: implications for neuron‐glia interactions in glutamate transmission. J Neurosci 7: 2214–2231. [DOI] [PMC free article] [PubMed] [Google Scholar]
- Babb TL, Pretorius JK, Kupfer WR, Crandall PH (1989): Glutamate decarboxylase‐immunoreactive neurons are preserved in human epileptic hippocampus. J Neurosci 9: 2562–2574. [DOI] [PMC free article] [PubMed] [Google Scholar]
- Binder GA, Haughton VM, Ho KC (1979): Computed tomography of the brain in axial, coronal, and sagittal planes. Boston: Little, Brown. [Google Scholar]
- Bird ED, Gale JS, Spokes EG (1977): Huntington's chorea: Post mortem activity of enzymes involved in cerebral glucose metabolism. J Neurochem 29: 539–545. [DOI] [PubMed] [Google Scholar]
- Bondy SC, Purdy JL (1977): Putative neurotransmitters of the avian visual pathway. Brain Res 119: 417–426. [DOI] [PubMed] [Google Scholar]
- Brownstein MJ, Mroz EA, Tappaz ML, Leeman SE (1977): On the origin of substance P and glutamic acid decarboxylase (GAD) in the substantia nigra. Brain Res 135: 315–323. [DOI] [PubMed] [Google Scholar]
- Curtis DR, Duggan AW, Felix D, Johnston GAR, McLennan H (1971): Antagonism between bicuculline and GABA in the cat brain. Brain Res 33: 57–73. [DOI] [PubMed] [Google Scholar]
- Difazio MC, Hollingsworth Z, Young AB, Penney JB (1992): Glutamate receptors in the substantia nigra of Parkinson's disease brains. Neurology 42: 402–406. [DOI] [PubMed] [Google Scholar]
- Filla A, De Michele G, Morra VB, Palma V, Di Lauro A, Di Geronimo G, Campanella G (1986): Glutamate dehydrogenase in human brain: regional distribution and properties. J Neurochem 46: 422–424. [DOI] [PubMed] [Google Scholar]
- Fisher HF (1985): L‐Glutamate dehydrogenase from bovine liver In: Meister A, editor. Methods in enzymology, vol. 113, glutamate, glutamine, glutathione, and related compounds. Orlando, FL: Academic Press, p 16–27. [DOI] [PubMed] [Google Scholar]
- Fonnum F, Grofová I, Rinvik E, Storm‐Mathisen J, Walberg F (1974): Origin and distribution of glutamate decarboxylase in substantia nigra of the cat. Brain Res 71: 77–92. [DOI] [PubMed] [Google Scholar]
- Fonnum F (1984): Glutamate: a neurotransmitter in mammalian brain. J Neurochem 42: 1–11. [DOI] [PubMed] [Google Scholar]
- Gaspar P, Javoy‐Agid F, Ploska A, Agid Y (1980): Regional distribution of neurotransmitter synthesizing enzymes in the basal ganglia of human brain. J Neurochem 34: 278–283. [DOI] [PubMed] [Google Scholar]
- Guntern R, Vallet PG, Bouras C, Constantinidis J (1989): An improved immunohistostaining procedure for peptides in human brain. Experientia 45: 159–161. [DOI] [PubMed] [Google Scholar]
- Hattori T, McGeer PL, Fibiger HC, McGeer EG (1973): On the source of GABA‐containing terminals in the substantia nigra. Electron microscopic autoradiographic and biochemical studies. Brain Res 54: 103–114. [DOI] [PubMed] [Google Scholar]
- Hauber W (1998): Involvement of basal ganglia transmitter systems in movement initiation. Prog Neurobiol 56: 507–540. [DOI] [PubMed] [Google Scholar]
- Hazrati LN, Parent A, Mitchell S, Haber SN (1990): Evidence for interconnections between the two segments of the globus pallidus in primates: a PHA‐L anterograde tracing study. Brain Res 533: 171–175. [DOI] [PubMed] [Google Scholar]
- Hökfelt T, Elde R, Fuxe K, Johansson O, Ljungdahl Å, Goldstein M, Luft R, Efendic S, Nilsson G, Terenius L, Ganten D, Jeffcoate SL, Rehfeld J, Said S, Perez de la Mora M, Possani L, Tapia R, Teran L, Palacios R (1978): Aminergic and peptidergic pathways in the nervous system with special reference to the hypothalamus. Res Publ Assoc Res Nerv Ment Dis 56: 69–135. [PubMed] [Google Scholar]
- Javoy‐Agid F, Ploska A, Agid Y (1981): Microtopography of tyrosine hydroxylase, glutamic acid decarboxylase, and choline acetyltransferase in the substantia nigra and ventral tegmental area of control and Parkinsonian brains. J Neurochem 37: 1218–1227. [DOI] [PubMed] [Google Scholar]
- Jessell TM, Emson PC, Paxinos G, Cuello AC (1978): Topographic projections of substance P and GABA pathways in the striato‐ and pallido‐nigral system: a biochemical and immunohistochemical study. Brain Res 152: 487–498. [DOI] [PubMed] [Google Scholar]
- Kincaid AE, Penney JB Jr, Young AB, Newman SW (1991): Evidence for a projection from the globus pallidus to the entopeduncular nucleus in the rat. Neurosci Lett 128: 121–125. [DOI] [PubMed] [Google Scholar]
- Krnjevíc K (1974): Chemical nature of synaptic transmission in vertebrates. Physiol Rev 54: 418–540. [Google Scholar]
- Mai JK, Assheuer J, Paxinos G (1997): Atlas of the human brain. San Diego: Academic Press. [Google Scholar]
- Maker HS, Weiss C, Weissbarth S, Silides DJ, Whetsell W (1981): Regional activities of metabolic enzymes and glutamate decarboxylase in human brain. Ann Neurol 10: 377–383. [DOI] [PubMed] [Google Scholar]
- Marani E, Ruigrok TJH (1981): Enzyme histochemical changes in some optic projection areas of the goldfish after optic nerve lesions. Neurosci Lett 23: 233–238. [DOI] [PubMed] [Google Scholar]
- McGeer PL, McGeer EG (1976): Enzymes associated with the metabolism of catecholamines, acetylcholine and GABA in human controls and patients with Parkinson's disease and Huntington's chorea. J Neurochem 26: 65–76. [PubMed] [Google Scholar]
- Mesulam MM, Geula C (1988): Nucleus basalis (Ch4) and cortical cholinergic innervation in the human brain: observations based on the distribution of acetylcholinesterase and choline acetyltransferase. J Comp Neurol 275: 216–240. [DOI] [PubMed] [Google Scholar]
- Montero VM, Zempel J (1985): Evidence for two types of GABA‐containing interneurons in the A‐laminae of the cat lateral geniculate nucleus: a double‐label HRP and GABA‐immunocytochemical study. Exp Brain Res 60: 603–609. [DOI] [PubMed] [Google Scholar]
- Mugnaini E, Oertel WH (1985): An atlas of the distribution of GABAergic neurons and terminals in the rat CNS as revealed by GAD immunohistochemistry In: Björklund A, Hökfelt T, editors. Handbook of chemical neuroanatomy, vol. 4, GABA and neuropeptides in the CNS, part 1. Amsterdam: Elsevier, p 436–608. [Google Scholar]
- Ohm TG, Müller H, Ulfig N, Braak E (1990): Glutamic‐acid‐decarboxylase‐ and parvalbumin‐like‐immunoreactive structures in the olfactory bulb of the human adult. J Comp Neurol 291: 1–8. [DOI] [PubMed] [Google Scholar]
- Perides G, Lane WS, Andrews D, Dahl D, Bignami A (1989): Isolation and partial characterization of a glial hyaluronate‐binding protein. J Biol Chem 264: 5981–5987. [PubMed] [Google Scholar]
- Riley HA (1960): An atlas of the basal ganglia, brain stem and spinal cord: based on myelin‐stained material. New York: Hafner Publishing Company. [Google Scholar]
- Roberts M, Hanaway J (1970): Atlas of the human brain in section. Philadelphia: Lea & Febiger. [Google Scholar]
- Roberts E, Chase TN, Tower DB (1976): GABA in nervous system function. New York: Raven Press. [Google Scholar]
- Robledo P, Féger J (1990): Excitatory influence of rat subthalamic nucleus to substantia nigra pars reticulata and the pallidal complex: electrophysiological data. Brain Res 518: 47–54. [DOI] [PubMed] [Google Scholar]
- Rothe F, Wolf G, Schünzel G (1990): Immunohistochemical demonstration of glutamate dehydrogenase in the postnatally developing rat hippocampal formation and cerebellar cortex: comparison to activity staining. Neuroscience 39: 419–429. [DOI] [PubMed] [Google Scholar]
- Shaw PJ, Ince PG, Johnson M, Perry EK, Candy JM (1992): The quantitative autoradiographic distribution of [3H]MK‐801 binding sites in the normal human brainstem in relation to motor neuron disease. Brain Res 572: 276–280. [DOI] [PubMed] [Google Scholar]
- Sherwin AL (1999): Neuroactive amino acids in focally epileptic human brain: a review. Neurochem Res 24: 1387–1395. [DOI] [PubMed] [Google Scholar]
- Spokes EGS (1979): An analysis of factors influencing measurements of dopamine, noradrenaline, glutamate decarboxylase and choline acetylase in human post‐mortem brain tissue. Brain 102: 333–346. [DOI] [PubMed] [Google Scholar]
- Storm‐Mathisen J, Ottersen OP (1984): Neurotransmitters in the hippocampal formation In: Reinoso‐Suarez F, Ajmone‐Marsan C, editors. Cortical integration. New York: Raven Press, p 105–130. [Google Scholar]
- Sutoo D, Akiyama K, Maeda I (1988): The development of a high sensitivity and high linearity fluorescence microphotometry system for distribution analysis of neurotransmitter in the brain. Folia Pharmacol Jpn 91: 173–180. [DOI] [PubMed] [Google Scholar]
- Sutoo D, Akiyama K, Geffard M (1989): Central dopamine‐synthesis regulation by the calcium‐calmodulin‐dependent system. Brain Res Bull 22: 565–569. [DOI] [PubMed] [Google Scholar]
- Sutoo D, Akiyama K, Yabe K, Kohno K (1991a): Multiple analysis of tyrosine hydroxylase and calmodulin distributions in the forebrain of the rat using a microphotometry system. Brain Res Bull 26: 973–982. [DOI] [PubMed] [Google Scholar]
- Sutoo D, Akiyama K, Yabe K, Nishida N (1991b): Quantitative immunohistochemical distribution of choline acetyltransferase in the rostral forebrain of the rat. Neurosci Res 11: 63–70. [DOI] [PubMed] [Google Scholar]
- Sutoo D, Yabe K, Akiyama K (1991c): Atlas of the rat brain: quantitative distribution of the choline acetyltransferase. Kitasato Arch Exp Med 64: 221–262. [PubMed] [Google Scholar]
- Sutoo D, Akiyama K, Yabe K, Kohno K (1994): Quantitative analysis of immunohistochemical distributions of cholinergic and catecholaminergic systems in the human brain. Neuroscience 58: 227–234. [DOI] [PubMed] [Google Scholar]
- Sutoo D, Akiyama K, Yabe K (1998): Quantitative mapping analyzer for determining the distribution of neurochemicals in the human brain. J Neurosci Methods 85: 161–173. [DOI] [PubMed] [Google Scholar]
- Sutoo D, Yabe K, Akiyama K (1999): Quantitative imaging of substance P in the human brain using a brain mapping analyzer. Neurosci Res 35: 339–346. [DOI] [PubMed] [Google Scholar]
- Yates RA, Roberts PJ (1974): Effects of enucleation and intra‐ocular colchicine on the amino acids of frog optic tectum. J Neurochem 23: 891–893. [DOI] [PubMed] [Google Scholar]
- Zinner‐Feyerabend M, Braak E (1991): Glutamic acid decarboxylase (GAD)‐immunoreactive structures in the adult human lateral geniculate nucleus. Anat Embryol 183: 111– 117. [DOI] [PubMed] [Google Scholar]