

Abstract
It was shown recently that functional activation across brain motor areas during locomotion and foot movements are similar but differ substantially from activation related to upper extremity movement (Miyai [2001]: Neuroimage 14:1186–1192). The activation pattern may be a function of the behavioral context of the movement rather than of its mechanical properties. We compare motor system activation patterns associated with isolated single‐joint movement of corresponding joints in arm and leg carried out in equal frequency and range. Eleven healthy volunteers underwent BOLD‐weighted fMRI while performing repetitive elbow or knee extension/flexion. To relate elbow and knee activation to the well‐described patterns of finger movement, serial finger‐to‐thumb opposition was assessed in addition. After identifying task‐related voxels using statistical parametric mapping, activation was measured in five regions of interest (ROI; primary motor [M1] and somatosensory cortex [S1], premotor cortex, supplementary motor area [SMA] divided into preSMA and SMA‐proper, and cerebellum). Differences in the degree of activation across ROIs were found between elbow and knee movement. SMA‐proper activation was prominent for knee, but almost absent for elbow movement (P < 0.05); finger movement produced small but constant SMA‐proper activation. Ipsilateral M1 activation was detected during knee and finger movement, but was absent for the elbow task (P < 0.05). Knee movement showed less lateralization in M1 and S1 than other tasks (P < 0.05). The data demonstrate that central motor structures contribute differently to isolated elbow and knee movement. Activation during knee movement shows similarities to gait‐related activation patterns. Hum. Brain Mapping 17:131–140, 2002. © 2002 Wiley‐Liss, Inc.
Keywords: sensorimotor cortex, premotor cortex, cerebellum, supplementary motor area, functional imaging, brain activation
INTRODUCTION
The behavioral context of movement differs widely for upper and lower limbs. Whereas arm and hand are used for voluntary reaching, grasping or manipulation of objects, the legs are mostly involved in locomotion. Supraspinal centers dominate the control of upper limb movement, whereas rhythmic motion of gait is generated in spinal centers under the influence of supraspinal areas (for review, see Grillner, 1981). In the fMRI scanner motor paradigms are dissociated from behaviorally relevant action for reasons of task design or practicability. Often movement is reduced to a single or a few joints. Such isolated movements have simpler mechanical properties than compound motor tasks requiring multi‐joint coordination and postural control. If mechanical properties are major determinants of brain activation, isolated movement should produce very different activation patterns than complex tasks. Movements that share certain mechanical properties, e.g., elbow and knee movement, may be generated by similar brain circuitry, which would be reflected in a similar distribution of active voxels across various motor areas. We show that this is not the case.
Previous functional imaging studies have compared upper and lower limb movement with respect to somatotopy in various brain regions. Somatotopic maps with different degrees of intra‐ and interlimb segregation were identified in primary motor cortex (M1; Lotze et al., 2000), primary sensory cortex (S1; Bushara et al., 2001; Fink et al., 1997; Hlustik et al., 2001), supplementary motor area (SMA; Fink et al., 1997), and cerebellum (Rijntjes et al., 1999; Bushara et al., 2001; Grodd et al., 2001). As the objective of these studies was to characterize somatotopy, they did not report on differences in the distribution of activation across motor areas. Miyai et al. (2001) compared the distribution of activation during locomotion, isolated arm swing, and isolated foot dorsiflexion using near infrared spectroscopy (NIRS). The technique is unique in visualizing brain activation during gross movements like locomotion but has limited spatial resolution. Nevertheless, it is shown that walking as well as isolated foot flexion activate M1 (leg area on the medial surface) and SMA in both hemispheres, whereas isolated arm swing predominantly involves the lateral motor cortices of the contralateral hemisphere. As the study was designed to characterize locomotion‐related brain activity, it allows only limited comparisons between activation patterns associated with isolated upper vs. lower limb movement.
We investigate how isolated arm and leg movements of corresponding joints carried out in equal frequency and range, differ in the distribution and lateralization of activation across various structures of the sensorimotor system. To relate the findings to well‐described motor activation patterns, a finger‐tapping task was studied. We show that differences exist in how the brain uses its motor circuitry to produce voluntary upper and lower limb movements.
SUBJECTS AND METHODS
Subjects
Eleven healthy volunteers (6 men, 5 women; mean age, 46; range, 28–54 years) underwent fMRI testing after giving written informed consent. The study protocol and consent forms were approved by the Institutional Review Board of the Johns Hopkins University. None of the individuals had a history of neurological or cardiovascular disease. Handedness was assessed using the Edinburgh Inventory (Oldfield, 1971), and all participants were found to be right‐handed. Subjects were placed supine on the MRI stretcher with their legs inside a custom‐built device designed to limit head motion during lower extremity movement. The device consisted of a wedge‐shaped leg rest with attached harness to firmly restrain the subject's body to stretcher and device. Two stopper cushions limited the range of knee movements to 40 degrees. While inside the MRI scanner, the subject's head was fixed with molded cushions and straps around chin and forehead to further limit head motion. Before fMRI scanning, 7 of 11 subjects were videotaped during knee movement while the body was held by the device, but the head left unrestrained. Head motion was analyzed on video recordings and found to be <2 mm.
fMRI technique and paradigms
fMRI tests were carried out using a 1.5 T scanner (Gyroscan ACS‐NT; Philips) at the F.M. Kirby Center for Functional Brain Imaging, Kennedy Krieger Institute (Baltimore, MD). A T1‐weighted 3D‐MPRAGE sequence (TR 8.2 msec; TE 3.7 msec; flip angle 8 degrees; NEX 1; matrix 256 × 256; voxel‐resolution 1 × 1 × 1 mm3) was scanned for anatomical mapping. BOLD‐weighted EPI sequences (TR 3 seconds; TE 40 msec; matrix 64 × 64; slice thickness 5 mm; pixel resolution 3.75 × 3.75; 30–36 slices to obtain whole brain coverage, interleaved slice timing) were acquired in coronal orientation, aligned for posterior commissure and obex (Luft et al., 1998). For each movement paradigm, 60 scans were acquired over a period of 3 minutes without interscan delay. One measurement consisted of three cycles of rest and motion beginning with rest. Three motor tasks were acoustically cued by computer‐generated beeps (1 beep every 3 seconds, duration of beep 0.1 second, applied via headphone). Ten movements were carried out per block; one fMRI measurement included three blocks. Left‐ and right‐sided movement was assessed separately in random order. The movement tasks were as follows:
-
1
Extension–flexion of the knee: Subjects were cued every 3 seconds to lift the calf off a bottom cushion extending the knee until the shin reached an upper stop‐cushion. Without delay, the leg was returned to baseline. Ten movements were carried out per cycle. Flexion range was 40 degrees.
-
2
Flexion–extension of the elbow: Subject's shoulders and upper arms were immobilized using a harness while the hands were resting on the lower abdomen. Upon auditory cues, subjects flexed and then extended over a range of 40 degrees. The movement was cued every 3 seconds resulting in 10 movements per cycle.
-
3
Series of finger‐to‐thumb oppositions: In response to each auditory cue, subjects carried out one series of finger‐to‐thumb oppositions (1→2, 1→3, 1→4, 1→5). Shoulders and upper arms were immobilized and the forearms rested on the abdomen.
All paradigms were videotaped to monitor for compliance. Subjects were instructed to keep their eyes closed during the entire session (eye closure was monitored via the scanner's built‐in camera). One subject chose to terminate the experiment after completing the knee tasks.
After fMRI testing, EMG of bilateral hamstrings, medial, and lateral vastus muscles were obtained while subjects carried out knee movements in a setting identical to that in the scanner. Average root‐mean–square ratios (RMS‐r = RMS during movement/baseline RMS) were computed to control for coactivation of contralateral muscles. Coactivation may have occurred to counterbalance the lower part of the body. Although average RMS‐r on the side of movement was 2.8 ± 2.1, contralateral values (1 ± 0.1) indicated no coactivation.
fMRI analysis
Statistical parametric mapping (SPM99, www.fil. ion.ucl.ac.uk/spm/; Friston et al., 2000) was used to analyze functional and anatomic images. Differences in acquisition time of individual slices were corrected using phase‐shift computations implemented in SPM99. Spatial realignment of the entire image set was carried out using SPM99s motion correction algorithm (Friston et al., 1996). Image series were warped to Talairach space (Talairach and Tournoux, 1988) using the MNI template included in SPM99 and smoothed using Gaussian filtering (8 mm FWHM). A general linear model (GLM) was applied to extract foci of activity on a voxel‐by‐voxel basis (Friston et al., 2001). A boxcar function with hemodynamic response modulation was used to model sustained effects of movement during blocks of activity versus rest (Worsley and Friston, 1995). The effect of hand, elbow, or knee movement was probed by T‐contrast. High (120 seconds) and low‐pass filters (hemodynamic response function) were employed. T‐contrast maps were computed for each subject individually as well as for pooled data (all 11 or 10 subjects entered as separate sessions into a combined GLM). In pooled data analysis, a threshold of P < 0. 00001 (corrected) was used. Pooled maps were superimposed onto one Talairach‐warped mean image set constructed from individual T1‐weighted images.
Region of interest (ROI) analysis was carried out by automatically masking the SPM (uniform probability threshold for all subjects P = 0.001, uncorrected) with binary image sets defining each ROI. These binary sets were constructed from individual T1 images by manual tracing according to anatomical landmarks. M1 was defined as the posterior half of the precentral gyrus, medially from the fundus of the central sulcus (in the axial plane) to the lateral surface. To include the leg area, M1 extended into the interhemispheric fissure. The posterior border of the medial part of M1 was usually identified by the medial extension of the central sulcus. The anterior border separating M1 from SMA‐proper was defined arbitrarily according to a projection of Brodmann's map. The inferior extent of the medial M1 was the cingulate sulcus; the ventral border of the lateral M1 was defined as the first axial slice (browsing in dorso–ventral direction) not showing the hand notch configuration (inverted omega). SMA‐proper extended anteriorly up to a vertical plane through the anterior commissure (Zilles et al., 1995). The pre SMA was arbitrarily defined as extending 5 mm anterior to this plane. The primary sensory cortex (Brodmann areas 3, 1, 2) was defined as the postcentral gyrus excluding the area corresponding to the posterior parietal cortex (PPC; Grefkes et al., 2001). Premotor cortex (area 6aα) was defined as the anterior half of the precentral gyrus (Rizzolatti et al., 1998). The cerebellum was divided into two ROIs, left and right of the midline. To avoid ROI‐overlap, ROIs defined earlier were subtracted from original image sets before tracing subsequent ROIs.
Statistical analysis
The number of significant voxels and the mean effect size per ROI were measured using the image masking feature contained in SPM99. Masks are 3D‐image sets in which voxels belonging to a ROI have an intensity of one and background voxels an intensity of zero. One mask image set was created per ROI and per side by manual tracing as described above. By superimposing mask and statistical parametric map, SPM99 then delivered the number of activated voxels and the mean effect size (β) of all voxels inside the corresponding ROI. These parameters were used to compute an activation index (Lee et al., 2000) [AI = (activate voxel count × mean effect size in ROI)/(whole brain active voxel count × mean effect size in whole brain)]. The laterality index per ROI was defined as LI = (AI contra − AI ipsi)/(AI contra + AI ipsi). Differences between movement paradigms were tested using paired t tests. Probabilities represent two‐tailed Bonferroni‐corrected estimates (unless specified as non‐corrected – nc). All values are reported as mean ± SEM.
RESULTS
Pooled (Fig. 2a–c,e) and individual activation maps (Fig. 1a–c,e) demonstrate somatotopy in M1 and cerebellum. The somatotopic arrangement in contralateral M1 with the hand representation lateral to elbow and knee representations, was also evident by comparing centers of gravity of activation foci in the M1‐ROI: knee‐related activation (x = 13.8 ± 2.8 mm) was found medial to finger (x = 36.4 ± 1.6 mm, P < 0.05) and elbow foci (x = 33.5 ± 1.9 mm, P < 0.05). S1 activation was mainly observed during elbow and finger movement. S1‐somatotopy was evident by comparing focus coordinates (elbow: x = 36.8 ± 4.4; finger: x = 47.2 ± 2.7; P < 0.039 nc). In the cerebellum, the geometry of the somatotopic map was evident by comparing focus coordinates (knee: y = −41.5 ± 3.8; elbow: y = −53.5 ± 2.5; finger: y = 52.6 ± 2.0; knee–finger: P = 0.01 nc; knee–elbow: P = 0.07 nc). Infrequently, activation was also found in the posterior lobe of the cerebellum in association with either task (knee movement: contra, 25% of subjects; ipsi, 25%; elbow: contra, 30%; ipsi, 25%; finger: contra, 25%; ipsi, 30%; see Fig 2c,e). Somatotopic organizations were observed in the bilateral SMA‐proper (pooled maps, Fig. 1e–f; individual, Fig. 2d). Finger and elbow representations were located anterior to the knee area (y coordinates for knee: −4.1 ± 1.6, elbow: −1.2 ± 1.6, and finger: 0.2 ± 1.4).
Figure 2.
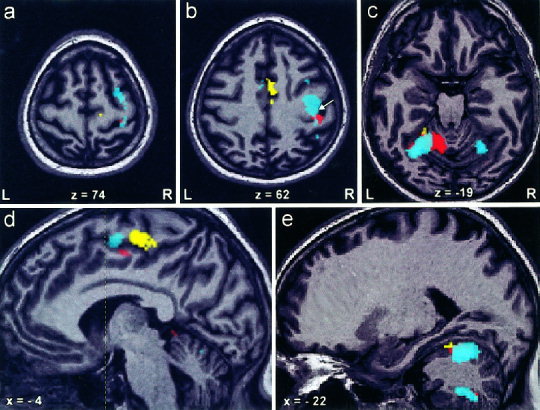
Activation maps of a representative subject performing left‐sided knee (yellow), elbow (red), and finger movement (cyan), demonstrate (a) premotor activation during finger movement. b: SMA activation during knee movement and M1 activation related to finger movement (white arrow indicates the position of the hand notch). c,e: Somatotopy in cerebellar anterior lobe with the knee representation anterior to elbow and finger areas. Additionally, finger‐related activation is found in the ipsilateral posterior lobe and contralateral anterior lobe of the cerebellum. d: Demonstrates somatotopy in the contralateral SMA‐proper (vertical line through the anterior commissure indicates the border between preSMA and SMA‐proper).
Figure 1.
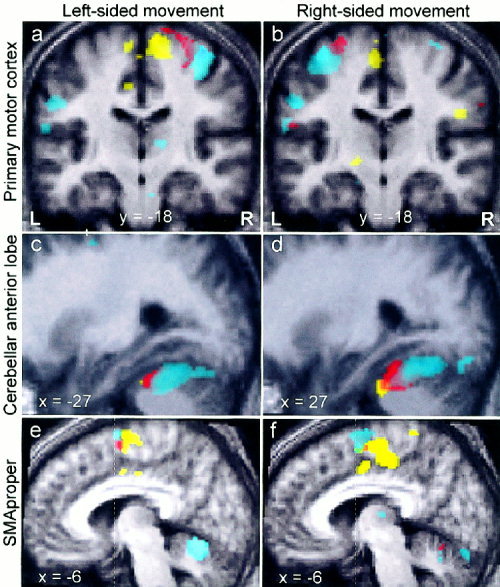
Pooled activation maps demonstrate the somatotopy of primary motor cortex (M1), cerebellum, and supplementary motor area (SMA). a,b: Contralateral M1 fields for fingers (cyan), elbow (red) and knee (yellow) are found in locations predicted by the M1‐homunculus. It is evident that upper extremity somatotopy is fairly symmetric between hemispheres. In contrast, there is asymmetry in knee representations, which may be an artifact of higher intersubject variability (size, location and strength) of the knee movement‐related contralateral M1 focus. c,d: In ipsilateral cerebellum, the knee representation is found anterior to elbow and hand representations. The latter two show substantial overlap (see Discussion). e,f: Somatotopic representations for hand (rostrodorsal), elbow (rostroventral), and knee (caudal) are observed in ipsi‐ and contralateral SMA‐proper (vertical line through the anterior commissure indicates the border between preSMA and SMA‐proper). Note that both images show the SMA‐proper of the same hemisphere while subjects move their left (e) or right limbs (f). Underlying anatomical images represent averages of T1‐scans of all subjects.
The mean activation index (AI) uncovered substantial differences in the contribution of certain ROIs to the movement tasks (Fig. 3, see P‐values). Finger movement was associated with highest activation of contralateral M1 and PM followed by elbow. Knee movement showed the least activation in these areas. In contrast, the knee task activated the ipsilateral M1, which was also active during finger movement. Elbow movement did not produce ipsilateral M1 activation. The level of activation in ipsilateral PM was higher than that in ipsilateral M1 for either task; especially, finger movement produced high ipsilateral PM activation. Notably, the relation of knee, elbow‐ and finger‐associated activation in M1, S1, and PM was similar both ipsi‐ and contralaterally: elbow movement showed the least ipsilateral activation in these areas and knee movement the lowest level of contralateral activation (Fig. 3). SMA‐proper was strongly activated by knee movement bilaterally with a slight contralateral predominance. Finger and elbow movement were associated with lesser activation in SMA. Almost no activation was found in pre SMA with either task. Activation in ipsilateral cerebellum was higher during upper limb than during knee movement, but the difference did not reach significance.
Figure 3.
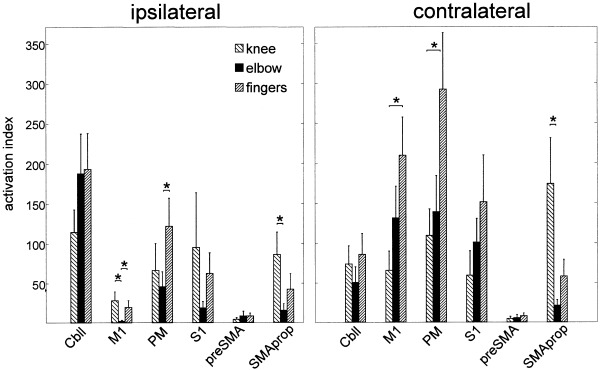
Mean activation indices (AI) plotted for each ROI and task. Knee movement activated SMA‐proper more than any other task. Contralateral M1 was strongly activated by finger movement, whereas knee movement produced little BOLD changes in contralateral M1. Ipsilateral M1 was active during knee and finger but not during elbow movement. PM was more activated by finger movement than by other tasks (*P < 0.05).
Differences between the three types of movements were also demonstrated by comparing the lateralization index (LI). For all ROIs, activation related to knee movement was less lateralized than elbow and finger associated activation. Significant differences in the lateralization index were found for M1 and S1 (Fig. 4).
Figure 4.
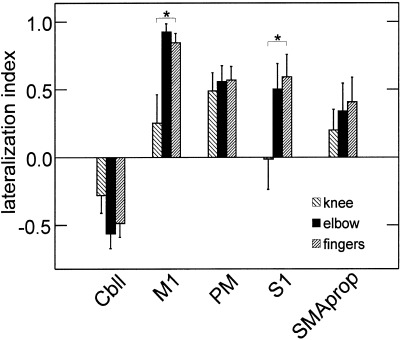
The lateralization index (LI) is plotted for different ROIs and movement tasks. FMRI‐activation during knee movement was less lateralized than activation associated with upper limb movement. This difference was significant for M1 and S1 (*P < 0.05). LIs for preSMA are omitted because less than half of the subjects showed activation in this area.
DISCUSSION
The data clearly show that the distribution of activation across motor areas differs for isolated movements of corresponding joints in upper and lower limbs. Differences exist beyond somatotopy: Tasks differ in the degree of involvement of certain motor areas, e.g., the predominant involvement of SMA‐proper in knee movement, as well as in the amount of lateralization of activation.
Previous functional imaging studies have characterized brain activation during various movement tasks. Their purpose was to identify the involvement of primary and non‐primary motor areas (Fink et al., 1997) or to demonstrate somatotopic organizations (Kawashima et al., 1995a; Lotze et al., 2000; Beisteiner et al., 2001; Hlustik et al., 2001; Indovina and Sanes, 2001). These data are compatible with our results that show the involvement of various primary and non‐primary areas and somatotopic organizations in M1, S1, and SMA. We add to these data the finding of somatotopy in the ipsilateral SMA relative to the limb in motion. Given the bilateral distribution of activation in SMA (lower lateralization index), this result seems expected. Fibers from contralateral M1 to the striatum were shown to converge with those originating in ipsilateral SMA, suggesting relevant interactions between these areas (Takada et al., 1998).
The degree of contralateral M1 somatotopy was recently debated (Sanes and Schieber, 2001). It is commonly accepted that somatotopic representations in M1 show higher overlap as compared to S1 representations (Hlustik et al., 2001). Although our movement paradigms were not designed to address this issue, the data support this notion by showing segregation of finger and elbow representations in S1 but not in M1. Somatotopy in the cerebellar anterior lobe was previously demonstrated by comparing hand, foot, and tongue movements (Nitschke et al., 1996; Grodd et al., 2001). In the anterior lobe, we found a small knee representation anterior and medial to larger representations of hand and elbow, which is consistent with previous data. Elbow and hand representations however, did almost completely overlap (mean y‐coordinates: −52.6 vs. −53.5). This contrasts with findings by Grodd et al. (2001) who were able to demonstrate a segregation of elbow, wrist, and finger representations in the anterior lobe in a larger cohort of subjects. Failure to demonstrate intralimb somatotopy in our study may be related to small cohort size and substantial interindividual variability that is also emphasized by Grodd et al. (2001).
Previous literature provides evidence for “fractured cerebellar somatotopy,” i.e., a mosaic‐like pattern of multiple small representations (Ellerman et al., 1994). Individual activation maps in the present study did not show fractured somatotopy but such patterns may have been smoothed by Gaussian filtering of EPI images (FWHM of 8 mm).
Involvement of ipsilateral M1 was previously demonstrated for finger movement (Kim et al., 1993; Babiloni et al., 1999; Kinoshita et al., 2000; Muellbacher et al., 2000). Although supporting this finding for the fingers, our data show no ipsilateral M1 activation during elbow movement. Knee movement, however, did activate ipsilateral almost as much as contralateral M1. It is possible that the latter finding reflects a spill‐over of contralateral activation as leg representations in M1 located on the medial surfaces of the hemispheres, are in close proximity. ROI mask analysis ensured, however, that only voxels to either side of the midline were counted. The midline was defined on high resolution anatomical images that were coregistered with EPI sets. Alternatively, activation of musculature contralateral to the moving limb may account for ipsilateral M1 activation. We found no evidence for such activation in video recordings of fMRI paradigms or while subjects carried out equivalent tasks under EMG monitoring. Therefore, we assume that ipsilateral M1 activation is pertinent to the task and not the result of contralateral co‐contraction (Kawashima et al., 1995b). Ipsilateral involvement in a simple motor task like knee movement (single joint, one dimension), stands against the interpretation that task complexity determines the degree of ipsilateral M1 activation (Chen et al., 1997). The nature of ipsilateral M1 contributions to finger and knee movement, however, is not clarified by the present data. Similar to M1 was knee movement‐related S1 activation distributed equally over both hemispheres (lateralization index close to zero). What was said in the interpretation of M1 findings also applies to S1. In a near‐infrared functional imaging study on gait and foot movement, Miyai et al. (2001) found highly symmetrical activation in sensory and motor cortices. Bilaterality of activation seems to be a feature of lower extremity movement regardless of joint and complexity.
Activation in PM was highest during finger movement. PM activation has been described for motor paradigms involving sensory cues as opposed to self‐paced movement (Passingham, 1985; Roland and Zilles, 1996). Attention and motor preparation have also been attributed to PM and may be spatially segregated (Boussaoud, 2001) within this heterogeneous area (Rizzolatti et al., 1998). In the present study, PM was not subdivided due to the lack of macroscopic landmarks; therefore only coarse interpretation is possible. It is plausible that, compared to elbow and knee flexion/extension, the serial finger opposition task required higher attention to somatosensory feedback to determine which finger to move next. Therefore, high PM activation seems compatible with previous studies.
PreSMA activation was rarely found in our data. Previous studies have described pre SMA activation when movements were freely selected and executed (Deiber et al., 1991; Passingham, 1996). This was not a feature of the paradigms used here.
What distinguished knee from elbow movement was the activation of SMA‐proper. This region corresponds to the area F3 in primates (Rizzolatti et al., 1998). Activation in SMA was shown during planning of learned motor sequences (Rao et al., 1993; Tyszka et al., 1994), motor imagery (Stephan et al., 1995), self‐generated movement (Larsson et al., 1996), and complex finger movement (Shibasaki et al., 1993). In accordance, we found higher SMA‐proper activation for the finger task than for the elbow task. The observation that knee movement activated SMA‐proper significantly stronger than any other task, is compatible with studies showing SMA involvement in postural control (Massion, 1992) and proximal movement (Matelli et al., 1993; Luppino et al., 1994; Rao et al., 1997). Miyai et al. (2001) describe in the above mentioned paper a strong SMA and M1 activation during human gait. Interestingly, the authors found similar SMA and M1 activation during alternating isolated foot movements. Likewise, knee movement may produce activation patterns that are similar to those present during locomotion. Although fMRI measurements in walking subjects remain impossible, repetitive knee or foot movement may be as close a model of gait as possible.
Alternatively, similarities between activation patterns of gait and isolated leg movement may reflect the subject's imagination of walking while moving the leg. Like for gait (Miyai et al., 2001), imagery was shown to share common activation patterns with actual performance in many studies (Leonardo et al., 1995; Decety, 1996; Porro et al., 1996; Luft et al., 1998; Lotze et al., 1999). This interpretation, however, is difficult to substantiate because no subject was told before or recalled images of walking after fMRI scanning.
Our study has limitations related to the comparability of elbow and knee movement: Motion was against gravity for knee but in an angle of approximately 45 degrees for elbow movement. Neither vertical elbow movement nor oblique knee movement were practicable given in the geometrical constraints of the scanner. Direction of movement in relationship to gravity as well as differing weights of upper and lower limbs may be the basis for activation pattern differences. Previous studies, however, have shown for arm movement that force determines the magnitude of the BOLD‐signal change (Peck et al., 2001) or the number of active voxel in M1 (Thickbroom et al., 1998) rather than the distribution of activation across different motor areas. In animals performing tasks that require both dynamic and static (gravity) force, the firing of motor cortex neurons is determined by dynamic component (Ashe, 1997). It therefore seems unlikely that differences in arm versus leg activation patterns observed here are related to dissimilar forces.
A second limitation is the manual definition of regions of interest (ROI). ROIs were traced based on anatomical landmarks where those existed. No landmarks separate M1 (leg representation) and SMA. High involvement of SMA‐proper in knee movement may consequently reflect inaccurate definition of the M1‐SMA‐proper border. Mean y‐coordinates, however, were clearly distinct between foci in the two regions (M1: −30.1 ± 3.2, SMA‐proper: y = −4.1 ± 1.6) and similar to values in the literature (Fink et al., 1997). SMA and M1 foci were separated on selected individual (where both foci were present, see Fig. 2b) and pooled activation maps (see Fig. 1f). We therefore think that activation in the SMA‐proper–ROI reflects true SMA‐proper activation.
In conclusion, elbow and knee movements differ in the degree of activation in various motor system structures despite the fact that the movements are similar in certain mechanical properties (corresponding one‐dimensional joints, frequency, range). The distribution of activation also showed differences between elbow and finger movement. Activation patterns associated with finger movement were similar to previous reports, supporting the validity of our findings. The results are in accordance with the notion that motor tasks are distinguished based on their profile of activation across elements of the central motor network (Roland and Zilles, 1996) and seem plausible in view of previous studies showing that movement‐related activation depends on task properties other than mechanical (Kawashima et al., 1994; Jahanshahi et al., 1995; Rao et al., 1997; Dassonville et al., 1998; Jancke et al., 2000; Krings et al., 2000). For isolated movements of upper and lower limbs, these activation profiles are substantially different and may reflect the movement's underlying behavioral context—as argued for knee movement and gait.
Acknowledgements
We thank the F.M. Kirby Center for Functional Brain Imaging, Kennedy Krieger Institute (Baltimore, MD), and its staff, especially Terry Brawner, Dr. J. Pekar, and Dr. P. van Zijl. Dr. Luft is supported by the Deutsche Forschungsgemeinschaft (DFG, Lu 748/2, 748/3). The study was funded by a grant from the Johns Hopkins General Clinical Research Center (Neurobehavioral Research Unit).
REFERENCES
- Ashe J (1997): Force and the motor cortex. Behav Brain Res 86: 1–15. [DOI] [PubMed] [Google Scholar]
- Babiloni C, Carducci F, Pizzella V, Indovina I, Romani GL, Rossini PM, Babiloni F (1999): Bilateral neuromagnetic activation of human primary sensorimotor cortex in preparation and execution of unilateral voluntary finger movements. Brain Res 827: 234–236. [DOI] [PubMed] [Google Scholar]
- Beisteiner R, Windischberger C, Lanzenberger R, Edward V, Cunnington R, Erdler M, Gartus A, Streibl B, Moser E, Deecke L (2001): Finger somatotopy in human motor cortex. Neuroimage 13: 1016–1026. [DOI] [PubMed] [Google Scholar]
- Boussaoud D (2001): Attention versus intention in the primate premotor cortex. Neuroimage 14: S40–S45. [DOI] [PubMed] [Google Scholar]
- Bushara KO, Wheat JM, Khan A, Mock BJ, Turski PA, Sorenson J, Brooks BR (2001): Multiple tactile maps in the human cerebellum. Neuroreport 12: 2483–2486. [DOI] [PubMed] [Google Scholar]
- Chen R, Cohen LG, Hallett M (1997): Role of the ipsilateral motor cortex in voluntary movement. Can J Neurol Sci 24: 284–291. [DOI] [PubMed] [Google Scholar]
- Dassonville P, Lewis SM, Zhu XH, Ugurbil K, Kim SG, Ashe J (1998): Effects of movement predictability on cortical motor activation. Neurosci Res 32: 65–74. [DOI] [PubMed] [Google Scholar]
- Decety J (1996): Do imagined and executed actions share the same neural substrate? Brain Res Cogn Brain Res 3: 87–93. [DOI] [PubMed] [Google Scholar]
- Deiber MP, Passingham RE, Colebatch JG, Friston KJ, Nixon PD, Frackowiak RS (1991): Cortical areas and the selection of movement: a study with positron emission tomography. Exp Brain Res 84: 393–402. [DOI] [PubMed] [Google Scholar]
- Ellerman JM, Flament D, Kim SG, Fu QG, Merkle H, Ebner TJ, Ugurbil K (1994): Spatial patterns of functional activation of the cerebellum investigated using high field (4 T) MRI. NMR Biomed 7: 63–68. [DOI] [PubMed] [Google Scholar]
- Fink GR, Frackowiak RS, Pietrzyk U, Passingham RE. 1997. Multiple nonprimary motor areas in the human cortex. J Neurophysiol, 77: 2164‐2174. [DOI] [PubMed] [Google Scholar]
- Friston K, Jezzard P, Turner R (2001): Analysis of functional MRI time series. Hum Brain Mapp 1: 153–171. [Google Scholar]
- Friston K, Worsley KJ, Poline JB, Frith CD, Frackowiak R (2000): Statistical parametric maps in functional imaging: a general linear approach. Hum Brain Mapp 2: 189–210. [Google Scholar]
- Friston KJ, Williams S, Howard R, Frackowiak RS, Turner R (1996): Movement‐related effects in fMRI time‐series. Magn Reson Med 35: 346–355. [DOI] [PubMed] [Google Scholar]
- Grefkes C, Geyer S, Schormann T, Roland P, Zilles K (2001): Human somatosensory area 2: observer‐independent cytoarchitectonic mapping, interindividual variability, and population map. Neuroimage 14: 617–631. [DOI] [PubMed] [Google Scholar]
- Grillner S (1981): Control of locomotion in bipeds, tetrapods and fish In: Brookhart JM, Mountcastle VB, editors. Handbook of physiology: motor control. Bethesda, MD: American Physiological Society; p 1179–1236. [Google Scholar]
- Grodd W, Hulsmann E, Lotze M, Wildgruber D, Erb M (2001): Sensorimotor mapping of the human cerebellum: fMRI evidence of somatotopic organization. Hum Brain Mapp 13: 55–73. [DOI] [PMC free article] [PubMed] [Google Scholar]
- Hlustik P, Solodkin A, Gullapalli RP, Noll DC, Small SL (2001): Somatotopy in human primary motor and somatosensory hand representations revisited. Cereb Cortex 11: 312–321. [DOI] [PubMed] [Google Scholar]
- Indovina I, Sanes JN (2001): On somatotopic representation centers for finger movements in human primary motor cortex and supplementary motor area. Neuroimage 13: 1027–1034. [DOI] [PubMed] [Google Scholar]
- Jahanshahi M, Jenkins IH, Brown RG, Marsden CD, Passingham RE, Brooks DJ (1995): Self‐initiated versus externally triggered movements. I. An investigation using measurement of regional cerebral blood flow with PET and movement‐related potentials in normal and Parkinson's disease subjects. Brain 118: 913–933. [DOI] [PubMed] [Google Scholar]
- Jancke L, Himmelbach M, Shah NJ, Zilles K (2000): The effect of switching between sequential and repetitive movements on cortical activation. Neuroimage 12: 528–537. [DOI] [PubMed] [Google Scholar]
- Kawashima R, Itoh H, Ono S, Satoh K, Furumoto S, Gotoh R, Koyama M, Yoshioka S, Takahashi T, Yanagisawa T (1995a): Activity in the human primary motor cortex related to arm and finger movements. Neuroreport 6: 238–240. [DOI] [PubMed] [Google Scholar]
- Kawashima R, Roland PE, O'Sullivan BT (1994): Fields in human motor areas involved in preparation for reaching, actual reaching, and visuomotor learning: a positron emission tomography study. J Neurosci 14: 3462–3474. [DOI] [PMC free article] [PubMed] [Google Scholar]
- Kawashima R, Roland PE, O'Sullivan BT (1995b): Functional anatomy of reaching and visuomotor learning: a positron emission tomography study. Cereb Cortex 5: 111–122. [DOI] [PubMed] [Google Scholar]
- Kim SG, Ashe J, Hendrich K, Ellermann JM, Merkle H, Ugurbil K, Georgopoulos AP (1993): Functional magnetic resonance imaging of motor cortex: hemispheric asymmetry and handedness. Science 261: 615–617. [DOI] [PubMed] [Google Scholar]
- Kinoshita H, Oku N, Hashikawa K, Nishimura T (2000): Functional brain areas used for the lifting of objects using a precision grip: a PET study. Brain Res 857: 119–130. [DOI] [PubMed] [Google Scholar]
- Krings T, Topper R, Foltys H, Erberich S, Sparing R, Willmes K, Thron A (2000): Cortical activation patterns during complex motor tasks in piano players and control subjects. A functional magnetic resonance imaging study. Neurosci Lett 278: 189–193. [DOI] [PubMed] [Google Scholar]
- Larsson J, Gulyas B, Roland PE (1996): Cortical representation of self‐paced finger movement. Neuroreport 7: 463–468. [DOI] [PubMed] [Google Scholar]
- Lee M, Reddy H, Johansen‐Berg H, Pendlebury S, Jenkinson M, Smith S, Palace J, Matthews PM (2000): The motor cortex shows adaptive functional changes to brain injury from multiple sclerosis. Ann Neurol 47: 606–613. [PubMed] [Google Scholar]
- Leonardo M, Fieldman J, Sadato N, Campbell G, Ibanez V, Cohen L, Deiber M‐P, Jezzard P, Pons T, Turner R, Le Bihan D, Hallet M (1995): A functional magnetic resonance imaging study of cortical regions associated with motor task execution and motor ideation in humans. Hum Brain Mapp 3: 83–92. [Google Scholar]
- Lotze M, Erb M, Flor H, Huelsmann E, Godde B, Grodd W (2000): fMRI evaluation of somatotopic representation in human primary motor cortex. Neuroimage 11: 473–481. [DOI] [PubMed] [Google Scholar]
- Lotze M, Montoya P, Erb M, Hulsmann E, Flor H, Klose U, Birbaumer N, Grodd W (1999): Activation of cortical and cerebellar motor areas during executed and imagined hand movements: an fMRI study. J Cogn Neurosci 11: 491–501. [DOI] [PubMed] [Google Scholar]
- Luft AR, Skalej M, Stefanou A, Klose U, Voigt K (1998): comparing motion and imagery related activation in the human cerebellum: a functional MRI study. Hum Brain Mapp 6: 105–113. [DOI] [PMC free article] [PubMed] [Google Scholar]
- Luppino G, Matelli M, Camarda R, Rizzolatti G (1994): Corticospinal projections from mesial frontal and cingulate areas in the monkey. Neuroreport 5: 2545–2548. [DOI] [PubMed] [Google Scholar]
- Massion J (1992): Movement, posture and equilibrium: interaction and coordination. Prog Neurobiol 38: 35–56. [DOI] [PubMed] [Google Scholar]
- Matelli M, Rizzolatti G, Bettinardi V, Gilardi MC, Perani D, Rizzo G, Fazio F (1993): Activation of precentral and mesial motor areas during the execution of elementary proximal and distal arm movements: a PET study. Neuroreport 4: 1295–1298. [DOI] [PubMed] [Google Scholar]
- Miyai I, Tanabe HC, Sase I, Eda H, Oda I, Konishi I, Tsunazawa Y, Suzuki T, Yanagida T, Kubota K (2001): Cortical mapping of gait in humans: a near‐infrared spectroscopic topography study. Neuroimage 14: 1186–1192. [DOI] [PubMed] [Google Scholar]
- Muellbacher W, Facchini S, Boroojerdi B, Hallett M (2000): Changes in motor cortex excitability during ipsilateral hand muscle activation in humans. Clin Neurophysiol 111: 344–349. [DOI] [PubMed] [Google Scholar]
- Nitschke MF, Kleinschmidt A, Wessel K, Frahm J (1996): Somatotopic motor representation in the human anterior cerebellum. A high‐resolution functional MRI study. Brain 119: 1023–1029. [DOI] [PubMed] [Google Scholar]
- Oldfield RC (1971): The assessment and analysis of handedness: the Edinburgh inventory. Neuropsychologia 9: 97–113. [DOI] [PubMed] [Google Scholar]
- Passingham RE (1985): Premotor cortex: sensory cues and movement. Behav Brain Res 18: 175–185. [DOI] [PubMed] [Google Scholar]
- Passingham RE (1996): Functional specialization of the supplementary motor area in monkeys and humans In: Luders HO, editor. Supplementary sensorimotor area. Philadelphia: Lippincott‐Raven; p 105–116. [PubMed] [Google Scholar]
- Peck KK, Sunderland A, Peters AM, Butterworth S, Clark P, Gowland PA (2001): Cerebral activation during a simple force production task: changes in the time course of the hemodynamic response. Neuroreport 12: 2813–2816. [DOI] [PubMed] [Google Scholar]
- Porro CA, Francescato MP, Diamond ME, Baraldi P, Zuiani C, Bazzocchi M, Di Prampero PE (1996): Primary motor and sensory cortex activation during motor performance and motor imagery: a functional magnetic resonance imaging study. J Neurosci 16: 7688–7698. [DOI] [PMC free article] [PubMed] [Google Scholar]
- Rao SM, Binder JR, Bandettini PA, Hammeke TA, Yetkin FZ, Jesmanowicz A, Lisk LM, Morris GL, Mueller WM, Estkowski LD, et al. (1993): Functional magnetic resonance imaging of complex human movements. Neurology 43: 2311–2318. [DOI] [PubMed] [Google Scholar]
- Rao SM, Harrington DL, Haaland KY, Bobholz JA, Cox RW, Binder JR (1997): Distributed neural systems underlying the timing of movements. J Neurosci 17: 5528–5535. [DOI] [PMC free article] [PubMed] [Google Scholar]
- Rijntjes M, Buechel C, Kiebel S, Weiller C (1999): Multiple somatotopic representations in the human cerebellum. Neuroreport 10: 3653–3658. [DOI] [PubMed] [Google Scholar]
- Rizzolatti G, Luppino G, Matelli M (1998): The organization of the cortical motor system: new concepts. Electroencephalogr Clin Neurophysiol 106: 283–296. [DOI] [PubMed] [Google Scholar]
- Roland PE, Zilles K (1996): Functions and structures of the motor cortices in humans. Curr Opin Neurobiol 6: 773–781. [DOI] [PubMed] [Google Scholar]
- Sanes JN, Schieber MH (2001): Orderly somatotopy in primary motor cortex: does it exist? Neuroimage 13: 968–974. [DOI] [PubMed] [Google Scholar]
- Shibasaki H, Sadato N, Lyshkow H, Yonekura Y, Honda M, Nagamine T, Suwazono S, Magata Y, Ikeda A, Miyazaki M (1993): Both primary motor cortex and supplementary motor area play an important role in complex finger movement. Brain 116: 1387–1398. [DOI] [PubMed] [Google Scholar]
- Stephan KM, Fink GR, Passingham RE, Silbersweig D, Ceballos‐Baumann AO, Frith CD, Frackowiak RSJ (1995): Functional anatomy of the mental representation of upper extremity movements in healthy subjects. J Neurophysiol 73: 373–386. [DOI] [PubMed] [Google Scholar]
- Takada M, Tokuno H, Nambu A, Inase M (1998): Corticostriatal input zones from the supplementary motor area overlap those from the contra rather than ipsilateral primary motor cortex. Brain Res 791: 335–340. [DOI] [PubMed] [Google Scholar]
- Talairach J, Tournoux P (1988): Co‐planar stereotactic atlas of the human brain. New York: Thieme. [Google Scholar]
- Thickbroom GW, Phillips BA, Morris I, Byrnes ML, Mastaglia FL (1998): Isometric force‐related activity in sensorimotor cortex measured with functional MRI. Exp Brain Res 121: 59–64. [DOI] [PubMed] [Google Scholar]
- Tyszka JM, Grafton ST, Chew W, Woods RP, Colletti PM (1994): Parceling of mesial frontal motor areas during ideation and movement using functional magnetic resonance imaging at 1.5 T. Ann Neurol 35: 746–749. [DOI] [PubMed] [Google Scholar]
- Worsley KJ, Friston KJ (1995): Analysis of fMRI time‐series revisited—again. Neuroimage 2: 173–181. [DOI] [PubMed] [Google Scholar]
- Zilles K, Schlaug G, Matelli M, Luppino G, Schleicher A, Qu M, Dabringhaus A, Seitz R, Roland PE (1995): Mapping of human and macaque sensorimotor areas by integrating architectonic, transmitter receptor, MRI, and PET data. J Anat 187: 515–537. [PMC free article] [PubMed] [Google Scholar]