

Abstract
Functional magnetic resonance imaging was performed on blind adults resting and reading Braille. The strongest activation was found in primary somatic sensory/motor cortex on both cortical hemispheres. Additional foci of activation were situated in the parietal, temporal, and occipital lobes where visual information is processed in sighted persons. The regions were differentiated most in the correlation of their time courses of activation with resting and reading. Differences in magnitude and expanse of activation were substantially less significant. Among the traditionally visual areas, the strength of correlation was greatest in posterior parietal cortex and moderate in occipitotemporal, lateral occipital, and primary visual cortex. It was low in secondary visual cortex as well as in dorsal and ventral inferior temporal cortex and posterior middle temporal cortex. Visual experience increased the strength of correlation in all regions except dorsal inferior temporal and posterior parietal cortex. The greatest statistically significant increase, i.e., ∼30%, was in ventral inferior temporal and posterior middle temporal cortex. In these regions, words are analyzed semantically, which may be facilitated by visual experience. In contrast, visual experience resulted in a slight, insignificant diminution of the strength of correlation in dorsal inferior temporal cortex where language is analyzed phonetically. These findings affirm that posterior temporal regions are engaged in the processing of written language. Moreover, they suggest that this function is modified by early visual experience. Furthermore, visual experience significantly strengthened the correlation of activation and Braille reading in occipital regions traditionally involved in the processing of visual features and object recognition suggesting a role for visual imagery. Hum. Brain Mapping 14:186–195, 2001. © 2001 Wiley‐Liss, Inc.
Keywords: Braille, blind, cortex, neural activation, functional magnetic resonance imaging
INTRODUCTION
Recent studies with positron emission tomography (PET) have shown that when people with severe visual disabilities read Braille, cortical regions are activated that are known to process visual input in sighted persons [Büchel et al., 1998a,b; Sadato et al., 1996, 1998]. Dynamic aspects of the activation, however, have not been examined. In the present study, functional magnetic resonance imaging (fMRI) [Kwong et al., 1992; Ogawa et al., 1992] was employed to explore whether the activated regions differ in the correlation of their time courses of activation with Braille reading. Cerebral activation was mapped in adults who had lost eyesight early in life. Half had experienced patterned vision, whereas the other half were blind from birth. A simple block design of resting and reading brailled nouns was chosen to minimize noise in the time courses of cerebral activation. In all subjects, foci of activation were identified in traditionally visual regions. The strength of correlation between time courses of cerebral activation and task differed significantly among these regions and seemed influenced by visual experience. These findings suggest that exposure to the visual world early in life may play a crucial role in the brain's processing of Braille.
METHODS
Subjects
Five female and five male subjects with severe visual disabilities participated in the present study (one Asian, three African Americans and six Caucasians). The subjects' participation was strictly voluntary. Informed consent was sought according to the regulations of the Institutional Review Board at Vanderbilt University. Before functional magnetic resonance imaging (fMRI), the subjects were extensively interviewed about the causes of their loss of eyesight, when the loss became severe, when they began to learn Braille, whether they had any visual memories and whether they could imagine pictures in front of their mind's eye. Only subjects without a history of chronic mental or physical illness were invited for fMRI. The visual disabilities of the participants included retinopathy of prematurity (four subjects), hereditary ocular misdevelopment (two subjects), postnatal macular degeneration, congenital glaucoma, Steven Johnson Syndrome and eye injury. The subjects were between 23 and 57 years of age (median = 43.5 years). Five subjects had no visual experience and could not evoke visual images. Five subjects had some visual function at birth, but developed a severe binocular dysfunction within seven (n = 4) or thirteen years (n = 1). Six of the 10 subjects could not recall visual memories. All subjects had begun to learn Braille between the ages of five and seven and were fluent readers reading 0.5–1.0 one‐syllable noun/s. They read with even strokes across the embossed words, touching the dots predominantly with digit 2, and sometimes, digit 3. Two subjects palpated the Braille dots with the left hand, all others used the right hand. After each scanning session, the subjects were debriefed about their thoughts while executing the task.
Stimuli
All participants were familiarized with the tasks and the scanner ambience in a mock setup before actual scanning. They wore earplugs and were under constant surveillance throughout the session. Anatomical scans were recorded before functional runs. The functional runs consisted of four epochs of 40‐s resting and 40‐s reading. During the first run, the subjects were asked to read aloud one‐syllable nouns that were embossed on dymo tape in grade I Braille, i.e., a letter‐by‐letter translation of the English alphabet. Ten percent of the nouns were abstract, e.g., ‘peace’; the rest were concrete, e.g., ‘tree’. The subjects advanced the dymo tape between guides on a pad cradled in their lap at their own pace by pulling or pushing with one hand and palpating the Braille dots with the fingers of the other hand. In contrast to reading at a pre‐determined fixed pace, self‐paced reading minimizes the impact of variations in fluency on local cerebral activation [D'Esposito et al., 1997]. During the second run, the subjects were asked to read nouns silently. Investigators standing by closely observed with what fingers the Braille was touched, how it was read, how many nouns were read and, if possible, where mistakes were made. The two runs were repeated in a second scanning session with different imaging planes. Only data from the runs of silent noun‐reading were used in the present study. Presence or absence of visual experience did not affect the subjects' reading fluency significantly (P = 0. 1573; Van der Waerden 2‐Sample Test). The 10 subjects read on the average 20 nouns per epoch during the first scanning session and were 2 nouns faster during the second session.
Scanning
The subjects were scanned with a General Electric Corp. Signa 1.5 T MR scanner. T1‐weighted anatomical images were obtained at 256 × 256 pixels in the sagittal and in the transaxial plane and six contiguous 5 mm‐thick slices were selected for functional imaging. In the first functional imaging session, the imaging plane was tilted ∼45° dorso‐rostrally so that the slices captured striate cortex as well as the primary somatic sensory and motor hand areas (Fig. 1). In the second session, the plane was oriented parallel to the line transecting the anterior and posterior commissure and the slices extended from the dorsal boundary of the thalamus to the superior colliculus (Fig. 1). T2*‐weighted images of the blood oxygenation level‐dependent (BOLD) signal [Ogawa et al., 1990] were acquired from the selected slices with a gradient echo EPI pulse sequence (flip angle 90°, TE = 60 msec, TR = 4 sec, FOV = 24 cm at 64 × 64 pixels). Hence, during each task 80 volumes of six images were recorded at a rate of one volume per 4 sec. At this acquisition rate the Nyquist frequency is 7.5 min−1 and changes in BOLD signal owing to cerebral pulsation caused by heart rate (∼60 min−1) and respiration (∼10 min−1) are excluded. Furthermore, the time of image acquisition was sufficiently long that cerebral activation was captured despite the latency between the change in BOLD signal and neural activation [Vanzetta and Grinvald, 1999]. Finally, at 3.75 × 3.75 × 5 mm the voxel size was sufficiently large to accommodate spatial mismatch between the change in BOLD signal and neural activation [Malonek and Grinvald, 1996].
Figure 1.

Maps of cerebral activation during Braille reading. (a) Anatomical scans in the sagittal plane. The lines indicate the six planes of functional imaging. Activation maps are from (b) a subject who had no eyesight from birth and (c) a subject who lost eyesight in early childhood. The local cerebral BOLD signal was recorded during resting and reading nouns embossed in Braille by touch silently. Voxels where the change in BOLD signal was correlated with resting and reading at r ≥ 0.45 are rendered in red/orange and superimposed on the corresponding stacks of anatomical scans. Regions of interest: V1, primary; V2, secondary visual cortex; log, lateral occipital cortex; otg, occipitotemporal cortex; itd, dorsal; itv, and ventral inferior temporal cortex; imt, inferior middle temporal cortex; pp, posterior parietal cortex; sm, primary somatic sensory/motor cortex. The black lines designate the boundaries of these regions near the middle of the stack. The time courses of the BOLD signal in the activated voxels contained within these lines were used for further analysis.
Data Analysis
The first volume of images of each functional run was discarded to account for the initial magnetization inequilibrium. The remaining image volumes were screened for spatially coherent motion and re‐aligned to the second volume with a free‐form transformation algorithm [Dawant et al., 1998]. No attempt was made to smooth the data temporally or spatially to exclude spurious BOLD spikes from cerebral activation maps. Instead, the percent change in BOLD signal from baseline at each pixel was correlated with the box car function of resting and reading using STIMULATE [Strupp, 1996] and only voxels with a correlation coefficient of r = 0.45 were considered to represent cerebral activation. Above this threshold, the probability for task‐unrelated increases in BOLD signal is P ≤ 0.005 [Young and Veldman, 1977]. Pixels with supra‐threshold BOLD signal were colored, smoothed round the edges and superimposed on the corresponding anatomical gray‐scale images (Fig. 1). A select number of cortical regions (Table I) were outlined on each composite image using anatomical landmarks. Only data from supra‐threshold pixels within the outlines were processed for further analyses. Broadband increases in BOLD signal in surface vessels of the brain and in the sagittal sinus [Bandettini et al., 1993] were carefully excluded.
Table I.
List of the cortical regions examined in the present study with their acronyms and locations according to the maps of Van Essen and Drury [1997]
| Cortical region | Location |
|---|---|
| Primary visual cortex (V1) | Cortex on both banks of the calcarine sulcus extending from the parietooccipital sulcus to the occipital pole. |
| Secondary visual cortex (V2) | Cortex extending from the occipital pole to the crest of the middle occipital gyrus. |
| Lateral occipital gyrus (log) | Cortex extending from the crest of the middle occipital gyus to the anterior bank of the lateral occipital sulcus. |
| Dorsal inferior temporal area (itd) | Cortex situated on the posterior bank and in the fundus of the posterior inferior temporal sulcus near angular gyrus. |
| Ventral inferior temporal area (itv) | Cortex situated on the posterior bank and in the fundus of the posterior inferior temporal sulcus at the location of MT+/V5. |
| Inferior middle temporal area (imt) | Cortex extending from the anterior bank of the posterior inferior temporal sulcus across the inferior and middle temporal gyri. |
| Occipitotemporal gyri (otg) | Cortex comprising the parahippocampal, lingual and fusiform gyri. |
| Posterior parietal cortex (pp) | Cortex situated on both banks of the intraparietal sulcus. |
| Primary somatic sensory and motor cortex (sm) | Cortex situated on the posterior and anterior banks of the central sulcus. |
As a measure of the expanse of the local cortical activation, the number of supra‐threshold voxels in a selected cortical region was counted on each hemisphere separately and the volume totals were calculated. As a measure of the magnitude of the activation, the BOLD signal was converted into z‐scores. The z‐scores were defined as the difference between the BOLD signal at each time point and the mean BOLD signal at ‘rest’ divided by the standard deviation of the BOLD signal at ‘rest’. This transformation accounted for variations in BOLD noise between regions, subjects and scanning sessions. Differences in local activation dynamics were determined by calculating the correlation coefficients for the correlation between the z‐scores and the box car curve of resting and reading at each time point for each region.
Statistics
Statistical analyses were carried out with SAS (SAS Institute, Cary, NC). Lateralization of the expanse of cortical activation was tested with a paired Student's t‐test on the ranks of percent side‐to‐side differences in the number of activated voxels between homotopic areas. In the first analysis of variance, local differences in magnitude of activation, volume of activated tissue and activation dynamics were tested using z‐scores, number of voxels and correlation coefficients as dependent variables, respectively. To account for differences in the frequency of supra‐threshold activation, the z‐scores and correlation coefficients were weighted by prevalence. The three dependent variables were normalized by transformation into Van der Waerden scores and analyzed with general linear models and type IV sums of squares, separately. Differences in magnitude and correlation among the selected cortical regions for the ten subjects were tested nesting side and subject with region. Reading fluency, i.e., the mean number of nouns read per 40‐sec epoch, was treated as covariate. Furthermore, the effect of the interaction between fluency and cortical region on local correlation coefficients was tested. Finally, one‐tailed pair‐wise comparisons between the ‘visual’ regions and primary somatic sensory/motor cortex contralateral to the reading hand were carried out with a Dunnett's t‐test and adjusted means at α = 0.10.
In the second analysis of variance, the influence of visual experience on local strengths of correlation was tested. Visual experience was incorporated into the model used in the first analysis. In addition, inter‐subject variability in BOLD response was controlled by using the correlation coefficient of somatic sensory/motor cortex as covariate. Somatic sensory/motor cortex was deemed appropriate because it constitutes the cortical region most directly involved in the processing of the tactile information and its activation most directly reflects each subject's reading effort. Local correlation coefficients were weighted by prevalence, converted into Van der Waerden scores and analyzed nesting side and visual experience with region. Further null‐hypotheses were tested for the effects of fluency alone and the interaction between fluency and visual experience on the strength of correlation. Pair‐wise comparisons were carried out with Bonferroni‐corrections and adjusted means at α = 0.10.
RESULTS
Reading Braille broadly activated primary somatic sensory and motor cortex on both hemispheres (Brodmann's areas {BA} 3 and 4, respectively [Brodmann, 1909]). The activation was contiguous and, thus, no attempt was made to distinguish between the two regions. In addition, foci of activation were found at the pole of the occipital lobe where primary visual (striate) cortex is located in sighted persons (Fig. 1) and in extrastriate visual cortex across the occipital, temporal and parietal lobes. Except for occipitotemporal cortex, cerebral activation was larger on the left hemisphere (Table II) consistent with this hemisphere's dominance for language processing [Geschwind, 1970]. On the average, 60% of the activated voxels were located there and this difference was highly significant (T = 15.52; P = 0. 0001).
Table II.
Prevalence and expanse of local cerebral activation as well as the correlation of its time course with resting and reading
| Cortical region | Side | Prevalence | Expanse | Correlation coefficient r c | Significance level (P)d | |
|---|---|---|---|---|---|---|
| [mm3]a | %b | |||||
| V1 | left | 8 | 766 | 57 | 0.55 | 0. 0277 |
| V1 | right | 7 | 766 | 0.48 | 0. 0094 | |
| V2 | left | 8 | 478 | 59 | 0.49 | 0. 0169 |
| V2 | right | 5 | 450 | 0.35 | 0. 0018 | |
| log | left | 9 | 485 | 63 | 0.59 | 0. 1163 |
| log | right | 9 | 387 | 0.49 | 0. 0324 | |
| itd | left | 6 | 169 | 69 | 0.36 | 0. 0034 |
| itd | right | 6 | 98 | 0.33 | 0. 0010 | |
| itv | left | 7 | 773 | 65 | 0.45 | 0. 0070 |
| itv | right | 8 | 499 | 0.48 | 0. 0110 | |
| imt | left | 6 | 436 | 68 | 0.37 | 0. 0031 |
| imt | right | 7 | 415 | 0.41 | 0. 0120 | |
| otg | left | 8 | 478 | 47 | 0.52 | 0. 0316 |
| otg | right | 8 | 675 | 0.56 | 0. 0626 | |
| pp | left | 10 | 1695 | 54 | 0.69 | 0. 3939 |
| pp | right | 9 | 1357 | 0.60 | 0. 2223 | |
| sm | left | 10 | 2159 | 51 | 0.70 | — |
| sm | right | 10 | 2363 | 0.71 | 0. 1760 | |
Mean volumes of activated tissue.
Median percent volume of activated tissue on the left hemisphere.
Prevalence‐weighted medians.
Significance levels for one‐tailed comparisons of local correlation coefficients with that of sm contralateral to the reading hand using side nested with cortical region as error term.
The time courses of cerebral activation varied considerably between cortical regions (Fig. 2) and this variation resulted in remarkable differences in local coefficients of correlation between cerebral activation and resting and reading (Table II). Analysis of variance showed that the strength of correlation was influenced significantly by region (F = 47.62; P = 0. 0001), side (F = 13.97; P = 0. 0003), subject (F = 6.54; P = 0. 0001), side‐nested‐with‐region (F = 3.58; P = 0. 0011) but not by fluency in Braille (F = 0.40; P = 0. 5296). Compared to magnitude or expanse of activation as dependent variables, strength of correlation provided the best fit of the analysis model (R 2 = 0.83) and the lowest variance of the estimated error (σ2 = 0.21). The substitution of correlation coefficients with z‐scores and voxels reduced R 2 by 8 and 30% and increased σ2 by 50 and 130%, respectively, substantially diminishing the significance of differences in cerebral activation.
Figure 2.
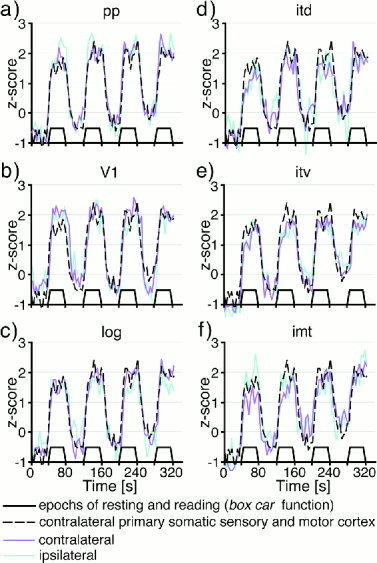
Time courses of local cerebral activation during Braille reading. The median time courses of cerebral activation in select regions of the 10 subjects contra‐ (magenta line) and ipsilateral to the reading hand (blue line). The box car function of resting and reading (black solid line) and the course of activation in the contralateral primary somatic sensory/motor cortex (black dashed line) were included in each plot. In posterior parietal (a) and striate cortex (b), changes in cerebral activity on both hemispheres appear as smooth peaks and troughs concomitant with resting and reading. These time courses are well in agreement with that of contralateral primary somatic sensory/motor cortex. In lateral occipital cortex (c), the peaks of activation diminish and excursions modulated onto the fundamental periodicity of resting and reading increase lowering the correlation with the box car function. This trend attains even more poignancy in the three temporal regions (d–f).
Local correlation coefficients were significantly higher on the hemisphere contralateral to the reading hand (P = 0. 0836). Compared to contralateral somatic sensory/motor cortex, however, all regions had significantly (P < 0.10) lower correlation coefficients except ipsilateral somatic sensory/motor cortex and bilateral posterior parietal cortex (Table II). Based on the significance of the differences in local strengths of correlation in pair‐wise comparisons, the regions could be divided into three groups: high, medium, and low responders. Somatic sensory/motor cortex and posterior parietal cortex constituted the top group at r > 0.60. Moderate correlation coefficients, i.e., 0.50 < r < 0.60, were found in lateral occipital (log; BA 19), occipitotemporal (otg; BA 19 and BA 37) and primary visual cortex (V1; BA 17). The strength of correlation was low, i.e., r < 0.50, in secondary visual cortex (V2; BA 18), dorsal (itd; BA 19 and 39) and ventral (itv; BA 19 and 37) inferior temporal cortex as well as in inferior middle temporal cortex (imt; BA 37 and posterior BA 22).
Including visual experience in the analysis of variance and treating the strength of correlation of somatic sensory/motor cortex as a covariate increased the fit of the model to R 2 = 0.86 and lowered the variance of the estimated error to σ2 = 0.19. The effect of visual experience on local strengths of correlation proved statistically significant (F = 16.24; P = 0. 0001). Furthermore, the strength of correlation of somatic sensory/motor cortex had a significant effect (F = 11.28; P = 0.011) whereas the effect of reading fluency remained insignificant (F = 2.45; P = 0. 1209). Consequently, the significance levels for region (F = 58.00; P = 0. 0001), side (F = 22.78; P = 0. 0001) and side‐nested‐with‐region (F = 16.24; P = 0. 0003) were raised. Visual experience strengthened the association between cerebral activation and Braille reading in almost all traditionally visual regions of cortex (Table III). Statistically significant increases between 19 and 27% were found in secondary visual and occipitotemporal cortex contralateral to the reading hand and in lateral occipital cortex ipsilateral to the reading hand. The greatest, most divergent impact of visual experience, however, was observed in the temporal lobe (Table III). Visual experience significantly increased correlation coefficients by ∼30% in inferior middle temporal and ventral inferior temporal cortex on both sides. Dorsal inferior temporal cortex, in contrast, showed an insignificant diminution of −5%.
Table III.
Influence of visual experience on the correlation of local cerebral activation contra‐ and ipsilateral to the reading hand with resting and reading
| Cortical region | Side | Visual experiencea | Prevalence | Correlation coefficientsb | Significance level (P)c | |
|---|---|---|---|---|---|---|
| V1 | contralateral | − | 4 | 0.69 | ||
| + | 4 | 0.78 | 13% | 0.19 | ||
| ipsilateral | − | 3 | 0.60 | |||
| + | 4 | 0.63 | 6% | 0.47 | ||
| V2 | contralateral | − | 4 | 0.54 | ||
| + | 3 | 0.69 | 27% | 0.03 | ||
| ipsilateral | − | 3 | 0.52 | |||
| + | 3 | 0.53 | 2% | 0.74 | ||
| log | contralateral | − | 5 | 0.79 | ||
| + | 4 | 0.84 | 6% | 0.47 | ||
| ipsilateral | − | 5 | 0.67 | |||
| + | 4 | 0.81 | 22% | 0.08 | ||
| itd | contralateral | − | 4 | 0.56 | ||
| + | 3 | 0.55 | −2% | 0.64 | ||
| ipsilateral | − | 3 | 0.41 | |||
| + | 2 | 0.38 | −7% | 0.90 | ||
| itv | contralateral | − | 3 | 0.51 | ||
| + | 4 | 0.65 | 27% | 0.03 | ||
| ipsilateral | − | 3 | 0.50 | |||
| + | 5 | 0.73 | 44% | 0.00 | ||
| imt | contralateral | − | 3 | 0.53 | ||
| + | 4 | 0.64 | 21% | 0.07 | ||
| ipsilateral | − | 2 | 0.44 | |||
| + | 4 | 0.58 | 32% | 0.07 | ||
| otg | contralateral | − | 4 | 0.73 | ||
| + | 5 | 0.86 | 19% | 0.04 | ||
| ipsilateral | − | 3 | 0.66 | |||
| + | 4 | 0.69 | 5% | 0.16 | ||
| pp | contralateral | − | 5 | 0.94 | ||
| + | 5 | 0.99 | 6% | 0.41 | ||
| ipsilateral | − | 4 | 0.89 | |||
| + | 5 | 0.86 | −3% | 0.72 | ||
−, absence of visual experience; +, presence of visual experience.
Prevalence‐weighted means normalized to matching sm and mean percent changes with visual experience.
Significance levels for pair‐wise comparisons in using side and visual experience nested with region as error term. Significance levels P ≤ 0.10 are printed in bold.
DISCUSSION
Both striate and extrastriate visual cortex have been shown to be metabolically hyperactive in subjects with early severe visual disabilities [Wanet‐Defalque et al., 1988]. In the present study, fMRI was used to examine regional differences in cerebral activation in visually disabled subjects reading Braille. Magnitude, volume, and the dynamics of activation were compared and activation dynamics, i.e., the strength of the correlation between the time courses of local cerebral activation and the task, proved to be the most powerful discriminant. The strength of correlation was greatest in the regions receiving the most direct tactile input from the ascending somatic sensory pathway, i.e., primary somatic sensory cortex and primary motor cortex, and statistically significantly smaller in all regions associated with the visual system, except posterior parietal cortex. There was no simple relationship between local strength and the distance to primary somatic sensory/motor cortex. In the eight subjects who had activation in the most remote area, i.e., striate cortex, the correlation coefficient was, on the average, only 2% smaller than that of the matching primary somatic sensory/motor cortex. In contrast, the greatest diminution and the most disparate effects of visual experience on the strength of correlation were observed in temporal regions closer to somatic sensory/motor cortex. Based on the strength of correlation, however, the activated ‘visual’ regions could be divided into three statistically distinct groups discussed below.
High Responders
Posterior parietal cortex was the ‘visual’ region with the highest correlation between activation and Braille reading. This finding is consistent with the notion that Brodmann's area (BA) 7 [Brodmann, 1909] receives input from the primary somatic sensory area and is connected with BA 5, BA 39, and BA 40 [Jeannerod, 1988]. BA 7, BA 39, and BA 40 have been shown to be activated during visual imagery [Roland and Friberg, 1985]. Posterior parietal cortex, however, may serve Braille reading in a more fundamental role. Recent activation and deactivation studies with PET [Sathian et al., 1997] and transcranial magnetic stimulation [Zangaladze et al., 1999], respectively, have demonstrated that left BA 7 is involved in the tactile discrimination of the orientation of gratings. Thus, BA 7 may fulfill a basic function in the identification of Braille letters.
Medium Responders
Medium responsiveness during Braille reading was observed in occipitotemporal, lateral occipital, and primary visual cortex. Occipitotemporal cortex has been shown to contain areas engaged in word recognition [Nobre et al., 1994] and may serve as a multimodal language region [Büchel et al. 1998a]. Moreover, this region is activated during visual mental imagery and has been implicated in the storage of visual memory [Kosslyn et al., 1993; Roland and Gulyás, 1994]. Lateral occipital cortex has been shown to be involved in the processing of kinetic boundaries and shapes [Van Oostende et al., 1997] as well as orthography [Petersen and Fiez, 1993; Pugh et al., 1996]. Furthermore, this region seems activated on the right hemisphere during visual mental imagery and the activation has been associated with the storage of pattern information that allows one to complete an incomplete visual presentation by imagination [Kosslyn et al., 1993].
Most strikingly, we detected foci of medium responsiveness in a region at the pole of the occipital lobe that constitutes primary visual (striate) cortex in sighted persons. In accord, Sadato et al. [1996] have demonstrated Braille‐related activation of the primary visual area in the early visually disabled with PET. In contrast, Büchel et al. [1998b] observed striate cortex activation only in persons who were visually disabled during adulthood and associated it with visual imagery. The discrepancy in observation may be explained by differences in stimulus protocols. Although the present study and that of Sadato et al. [1996] contrasted reading with resting, Büchel et al. [1998b] compared cerebral activation during real word‐ and nonsense word‐reading. The protocol of Büchel et al. [1998b] might have preferentially activated extrastriate areas that are involved in the extraction of phonologic and semantic content. In contrast, the activation of striate cortex obtained with the resting/reading paradigm suggests that this region may be engaged in more basic processing of tactile information, e.g., letter recognition. In support of this hypothesis, transcranial magnetic stimulation at the occipital poles has been demonstrated to degrade reading performance in the visually disabled [Cohen et al., 1997].
Low Responders
Responsiveness was low in the secondary visual cortex. This region has been shown to be co‐activated with primary visual cortex during visual mental imagery [Le Bihan et al., 1993; Kosslyn et al., 1995] and may have been engaged in Braille reading in conjunction with primary visual cortex.
The foci of activation with lowest responsiveness, however, were found in dorsal and ventral inferior temporal cortex as well as in inferior middle temporal cortex. In dorsal inferior temporal cortex, the foci were situated along the posterior temporo‐parietal boundary adjacent to angular gyrus. In the left hemisphere, this region seems to be engaged in the phonological processing of words [Petersen and Fiez, 1993]. In ventral inferior temporal cortex the sites of activation map onto human MT/V5 [Tootell et al., 1996] and in inferior middle temporal cortex they appear homotopic to the middle superior temporal area in monkeys [Kaas, 1997]. MT/V5 and middle superior temporal cortex are considered stations of the dorsal stream of the visual pathway that is specialized in the processing of motion [Ungerleider and Mishkin, 1982]. These regions are not as retinotopically organized as primary and secondary visual cortex or lateral occipital cortex and may serve as association areas that integrate more generalized, intrinsic features of visual stimuli [Courtney and Ungerleider, 1997]. They are near or in Wernicke's area in the left hemisphere [Bogen and Bogen, 1976; Geschwind, 1970; Mesulam, 1990] and have been observed to be activated during reading in multiple studies [Bookheimer et al., 1995; Eden and Zeffiro, 1998; Petersen et al., 1988; Pugh et al, 1996; Shaywitz et al., 1998]. In particular, left middle superior temporal cortex has been associated with semantic word analyses [Binder et al., 1996; Fiez and Petersen, 1998; Petersen and Fiez, 1993]. Taken together, the three temporal regions may, thus, represent higher stations of language processing that receive multi‐modal sensory input. It is intriguing that in the presence of early visual experience, cerebral activation was more strongly correlated with reading in the ventral than in the dorsal inferior temporal cortex, whereas the opposite was found in the absence of early visual experience. In conjunction with the above‐mentioned functions attributable to the two regions, our finding suggests that in the visually disabled phonological word processing may be emphasized in the absence of visual experience, whereas semantic word processing may be more prominent when visual experience exists.
CONCLUSIONS
The findings of the present study confirm that in the visually disabled traditionally visual cortical regions are activated during Braille reading. Furthermore, they provide evidence that the activated regions are not equally engaged in this process. A high association of activation with reading may be interpreted as an indication of a more immediate input from the somatic sensory pathway and an earlier stage of information processing. Hence, the high responsiveness of posterior parietal cortex is not surprising because of its direct connections with primary somatic sensory cortex. In contrast, the lowest association with reading found in the temporal lobe may be indicative of the highest stage of information processing in which re‐entrant or modulatory inputs with their own delays come to bear. That a medium level of responsiveness was attributable to activation in lateral occipital and primary visual cortex is intriguing. These regions do not receive direct tactile input. Yet, they seem to be involved in Braille reading in a fundamental way. Similarly secondary visual cortex was engaged, be it at a lower level. The three occipital regions are considered core visual areas [Courtney and Ungerleider, 1997; Tootell et al., 1996] and their function in the visually disabled needs further investigation. All activated areas examined in the present study, including striate cortex, have been shown to be so during mental visual imagery [Courtney and Ungerleider, 1997]. Visual imagery should account for the findings only in the five participants with visual experience. Mental imagery, however, may have occurred in the subjects without visual experience. These subjects reported having non‐visual associations with the nouns. Therefore, our findings are suggestive of a mental imagery that is independent of the modality of sensory input and support the interpretation that mental imagery consists of thinking in language rather than depictions.
Acknowledgements
This study was supported by National Institute of Neurological Orders and Stroke Grants NS‐25907‐06 and NS‐13031‐20 to F. Ebner. We are grateful for the help of S.L. Hartman and B.M. Dawant with image re‐alignment and the generous support of the John F. Kennedy Center for Research in Human Development at Vanderbilt University, the Vanderbilt Vision Research Center, the Hobbs Foundation and Dr. and Mrs. Irwin Eskind.
REFERENCES
- Bandettini PA, Jesmanowicz A, Wong EC, Hyde JS (1993): Processing strategies for time‐course data sets in functional MRI of the human brain. Mag Reson Med 30: 161–173. [DOI] [PubMed] [Google Scholar]
- Bookheimer SY, Zeffiro TA, Blaxton T, Gaillard W, Theodore W (1995): Regional cerebral blood flow during object naming and word reading. Hum Brain Mapp 3: 93–106. [Google Scholar]
- Binder JR, Frost JA, Hammeke TA, Rao SM, Cox RW (1996): Function of the left planum temporale in auditory and linguistic processing. Brain 119: 1239–1247. [DOI] [PubMed] [Google Scholar]
- Bogen JE; Bogen GM (1976): Wernicke's region—Where is it? Ann NY Acad Sci 280: 834–843. [DOI] [PubMed] [Google Scholar]
- Brodmann K (1909): Vergleichende Lokalisationslehre der Grosshirnrinde. Leipzig: Barth. [Google Scholar]
- Büchel C, Price C, Friston K (1998a): A multimodal language region in the ventral visual pathway. Nature 394: 274–277. [DOI] [PubMed] [Google Scholar]
- Büchel C, Price C, Frackowiak RSJ, Friston K (1998b): Different activation patterns in the visual cortex of late and congenitally blind subjects. Brain 121: 409–419. [DOI] [PubMed] [Google Scholar]
- Cohen LG, Celnik P, Pascual‐Leone A, Corwell B, Faiz L, Dambrosia J, Honda M, Sadato N, Gerloff C, Catalá MD, Hallett M (1997): Functional relevance of cross‐modal plasticity in blind humans. Nature 389: 180–183. [DOI] [PubMed] [Google Scholar]
- Courtney SM, Ungerleider LG (1997): What fMRI has taught us about human vision. Curr Opin Neurobiol 7: 554–561. [DOI] [PubMed] [Google Scholar]
- Dawant, BM , Thirion J‐P, Maes F, Vandermeulen D, Demaerel P (1998): Automatic 3D segmentation of internal structures of the head in MR images using a combination of similarity and free‐form transformations In: Hanson KM, editor. Medical imaging 1998: image processing, Proc SPIE, vol. 3338 Bellingham, WA: SPIE Press, p 545–554. [Google Scholar]
- D'Esposito M, Zarahn E, Aguirre GK, Shin RK, Auerbach P, Detre JA (1997): The effect of pacing of experimental stimuli on observed functional MRI activity. Neuroimage 6: 113–121. [DOI] [PubMed] [Google Scholar]
- Eden GF, Zeffiro TA (1998): Neural systems affected in developmental dyslexia revealed by functional neuroimaging. Neuron 21: 279–282. [DOI] [PubMed] [Google Scholar]
- Fiez JA, Petersen SE (1998): Neuroimaging studies of word reading. Proc Natl Acad Sci USA 95: 914–921. [DOI] [PMC free article] [PubMed] [Google Scholar]
- Geschwind N (1970): The organization of language and the brain. Science 170: 940–944. [DOI] [PubMed] [Google Scholar]
- Jeannerod M (1988): The neural and behavioral organization of goal‐directed movements In: Broadbent DE, McGaugh JL, Mackintosh NJ, Posner MI, Tulving E, Weiskrantz L, editors. Oxford psychology series, vol. 15 Oxford: Clarendon Press, p 228–244. [Google Scholar]
- Kaas JH (1997): Theories of visual cortex organization in primates In: Rockland KS, Kaas JH, Peters A, editors. Cerebral cortex, vol. 12 New York: Plenum Press, p 91–125. [Google Scholar]
- Kosslyn SM, Thompson WL, Kim IJ, Alpert NM (1995): Topographical representations of mental images in primary visual cortex. Nature 378: 496–498. [DOI] [PubMed] [Google Scholar]
- Kosslyn SM, Alpert NM, Thompson WL, Maljkovic V, Weise SB, Chabris CF, Hamilton SE, Rauch SL, Buonanno FS (1993): Visual mental imagery activates topographically organized visual cortex: PET investigations. J Cogn Neurosci 5: 263–287. [DOI] [PubMed] [Google Scholar]
- Kwong KK, Belliveau JW, Chesler DA, Goldberg IE, Weisskopf RM, Poncelet BP, Kennedy DN, Hoppel BE, Cohen MS, Turner R (1992): Dynamic magnetic resonance imaging of human brain activity during primary sensory stimulation. Proc Natl Acad Sci USA 89: 5675–5679. [DOI] [PMC free article] [PubMed] [Google Scholar]
- Le Bihan D, Turner R, Zeffiro TA, Cuénod CA, Jezzard P, Bonnerot V (1993): Activation of human primary visual cortex during visual recall: a magnetic resonance imaging study. Proc Natl Acad Sci USA 90: 11802–11805. [DOI] [PMC free article] [PubMed] [Google Scholar]
- Malonek D, Grinvald A (1996): Interactions between electrical activity and cortical microcirculation revealed by imaging spectroscopy: implications for functional brain mapping. Science 1996 272: 551–554. [DOI] [PubMed] [Google Scholar]
- Mesulam M‐M (1990): Large‐scale neurocognitive networks and distributed processing for attention, language and memory. Ann Neurol 28: 597–613. [DOI] [PubMed] [Google Scholar]
- Nobre AC, Allison T, McCarthy G (1994): Word recognition in the human inferior temporal lobe. Nature 372: 260–263. [DOI] [PubMed] [Google Scholar]
- Ogawa S, Lee TM, Nayak AS, Glynn P (1990): Oxygenation‐sensitive contrast in magnetic resonance imaging of rodent brain at high magnetic fields. Magn Res Med 14: 68–78. [DOI] [PubMed] [Google Scholar]
- Ogawa S, Tank DW, Menon RS, Ellermann J, Kim S, Merkle H, Ugurbil K (1992): Intrinsic signal changes accompanying sensory stimulation: functional brain mapping with magnetic resonance imaging. Proc Natl Acad Sci USA 89: 5951–5955. [DOI] [PMC free article] [PubMed] [Google Scholar]
- Petersen SE, Fiez JA (1993): The processing of single words studied with positron emission tomography. Annu Rev Neurosci 16: 509–530. [DOI] [PubMed] [Google Scholar]
- Petersen SE, Fox PT, Posner MI, Mintun MA, Raichle ME (1988): Positron emission tomographic studies of the cortical anatomy of single‐word processing. Nature 331: 585–589. [DOI] [PubMed] [Google Scholar]
- Pugh KR, Shaywitz BA, Shaywitz SE, Constable RT, Skudarski P, Fulbright RK, Bronen RA, Shankweiler DP, Katz L, Fletcher JM, Gore JC (1996): Cerebral organization of component processes in reading. Brain 119: 1221–1238. [DOI] [PubMed] [Google Scholar]
- Roland PE, Gulyás B (1994): Visual imagery and visual representation. Trends Neurosci 17: 281–287. [DOI] [PubMed] [Google Scholar]
- Roland PE, Friberg L (1985): Localization of cortical areas activated by thinking. J Neurophysiol 53: 1219–1243. [DOI] [PubMed] [Google Scholar]
- Sadato N, Pascual‐Leone A, Grafman J, Deiber M‐P, Ibanez V, Hallett M (1998): Neural networks for Braille reading by the blind. Brain 121: 1213–1229. [DOI] [PubMed] [Google Scholar]
- Sadato N, Pascual‐Leone A, Grafman J, Ibanez V, Deiber M‐P, Dold G, Hallett M (1996): Activation of the primary visual cortex by Braille reading in blind subjects. Nature 380: 526–528. [DOI] [PubMed] [Google Scholar]
- Sathian K, Zangaladze A, Hoffman JM, Grafton ST (1997): Feeling with the mind's eye. Neuroreport 8: 3877–3881. [DOI] [PubMed] [Google Scholar]
- Shaywitz SE, Shaywitz BA, Pugh KR, Fulbright RK, Constable RT, Mencl WB, Shankweiler DP, Liberman, AM , Skudlarski P, Fletcher JM, Katz L, Marchione KE, Lacadie C, Gatenby C, Gore JC (1998): Functional disruption in the organization of the brain for reading in dyslexia. Proc Natl Acad Sci USA 95: 2636–2641. [DOI] [PMC free article] [PubMed] [Google Scholar]
- Strupp JP (1996): Stimulate: a GUI based fMRI analysis software package. Neuroimage 3: S607. [Google Scholar]
- Tootell RBH, Dale AM, Sereno MI, Malach R (1996): New images from human visual cortex. Trends Neurosci 19: 481–489. [DOI] [PubMed] [Google Scholar]
- Ungerleider LG, Mishkin M (1982): Two cortical visual systems In: Ingle DG, Goodale MA, Mansfield RJQ, editors. Analysis of visual behavior. Cambridge: MIT Press, p 549–586. [Google Scholar]
- Van Essen DC, Drury HA (1997): Structural and functional analyses of human cerebral cortex using a surface–based atlas. J Neurosci 17: 7079–7102. [DOI] [PMC free article] [PubMed] [Google Scholar]
- Van Oostende S, Sunaert S, Van Hecke P, Marchal G, Orban GA (1997): The kinetic occipital (KO) region in man: a fMRI study. Cereb Cortex 7: 690–701. [DOI] [PubMed] [Google Scholar]
- Vanzetta I, Grinvald A (1999): Increased cortical oxidative metabolism due to sensory stimulation: Implications for functional brain imaging. Science 286: 1555–1558. [DOI] [PubMed] [Google Scholar]
- Wanet‐Defalque M‐C, Veraart C, De Volder A, Metz R, Michel C, Dooms G, Goffinet A (1988): High metabolic activity in the visual cortex of early blind human subjects. Brain Res 446: 369–373. [DOI] [PubMed] [Google Scholar]
- Young RK, Veldman DJ (1977): Introductory statistics for the behavioral sciences. New York: Holt, Rinehart and Winston, p 576. [Google Scholar]
- Zangaladze A, Epstein CM, Grafton ST, Sathian K (1999): Involvement of visual cortex in tactile discrimination of orientation. Nature 401: 587–590. [DOI] [PubMed] [Google Scholar]